
INTRODUCTION
Oropharyngeal and hypopharyngeal squamous cell carcinoma (OHSCC) are common cancers of the head and neck region. These neoplasms have contiguous anatomical origins and share similar lymphatic drainage and treatment regimens. OHSCC usually manifests as the advanced disease (stage III-IV) at presentation and is primarily treated with an organ-preservation approach based on definitive chemoradiotherapy [1, 2]. However, local failure remains a significant problem, with the reported local failure rates ranging from 20% to 30% [2–5]. Early prediction of treatment failure may enable therapeutic modification, including earlier salvage surgery for suitable cases and upfront intensification of chemotherapy or radiotherapy [6]. Therefore, the identification of reliable imaging biomarkers predicting treatment effects will enable improved prognosis stratification of patients undergoing chemoradiotherapy.
While computed tomography (CT) and magnetic resonance imaging (MRI) are commonly used to evaluate tumor extent of head and neck squamous cell carcinoma (HNSCC), MRI is more preferred in the delineation of anatomical tumor extent in the OHSCC by its high soft tissue contrast resolution. Proton magnetic resonance (1H MR) spectroscopy is an advanced MRI technique with a potential to relate molecular biochemistry to the biological behavior of normal and malignant tissues. 1H MR spectroscopy has been introduced clinically in patients with HNSCC, with choline being one of the most important metabolites [7–11]. Mukherji et al. reported that the choline/creatine ratios in primary tumors and their metastatic nodes were significantly elevated above those in normal muscle structures [7]. Bisdas et al. [9] have found that percentage changes in choline levels following chemoradiotherapy helped differentiate recurrent disease from post-therapeutic inflammatory tissues. However, King et al. [11] revealed that the presence of choline in a post-treatment mass, instead of its percentage changes, may serve as a marker of residual cancer. With the development in 1H MR spectroscopy technology, magnetic field strength and quantification modeling, some other metabolites including lipids, glutamine and glutamate (Glx), and myo-inositol have been found to elevate in tissue specimens of HNSCC [7, 12–15]. However, whether these metabolites can be identified using in vivo high magnetic field MR spectroscopy, and to what extent they help prediction of tumor control of OHSCC patients undergoing chemoradiotherapy have not been investigated.
Nowadays, [18F]-fluorodeoxyglucose positron emission tomography/CT (18F-FDG PET/CT) has become increasingly popular in the evaluation OHSCC because it provides anatomical and functional information for the entire body. Its quantitative parameters, including maximum standardized uptake value (SUVmax), metabolic tumor volume (MTV), and total lesion glycolysis (TLG) have been used to correlate with tumor control of HNSCC after chemoradiotherapy; however, variable results have been reported [5, 16–22]. SUVmax has been identified to be the independent predictor [5, 16–18]. However, some other studies observed that SUVmax was not related to treatment response, whereas MTV [19, 21], TLG [22], or both [20] were found to be adverse prognostic factors for local failure. More recently, the measurement of texture indices from tumor PET images has also been proposed to show the FDG uptake distribution within the tumor. In the post-hoc analysis of 124 cases collected from previous research projects [23], we demonstrated that FDG uptake heterogeneity was superior to traditional PET parameters in prognostic stratification of advanced OHSCC patients treated with chemoradiotherapy. Accordingly, we conducted a prospective study to determine whether pretreatment in vivo 1H MR spectroscopy at 3 Tesla (T) and 18F-FDG PET/CT can offer predictive power regarding the local control of advanced OHSCC patients treated with definitive chemoradiotherapy.
RESULTS
Between August 2013 and September 2015, a total of 77 OHSCC patients underwent MR spectroscopy and 18F-FDG PET/CT. Nineteen patients were excluded from the analysis, 16 of whom CRLB values of methyl resonance at 1.3 parts per million (ppm) exceeding the 30% range, and 3 died before the definitive diagnosis of recurrence could be made. Therefore, a total of 58 patients were eligible for the analysis. Male were predominant (N=56, 96.5%) with the median age 53.8 years. The primary tumor sites consisted of 31 (53.5%) oropharynx and 27 (46.5%) hypopharynx, and all were in advanced T categories with 14 (24.1%) T3, 38 (65.6%) T4a and 6 (10.3%) T4b. Patient characteristics are summarized in Table 1. All patients underwent definitive chemoradiotherapy and were closely monitored. The median follow-up time for the entire cohort was 17.4 months and 20.1 months for the survivors. In posttreatment 3-month MRI follow-up, complete response of the primary tumor was noted in 47 of our 58 (81%) patients, while 7 (12.1%), 2 (3.5%), and 2 (3.5%) patients had partial response, stable disease, and progressive disease, respectively, based on the RECIST criteria. The volume changes of our seven patients of partial response ranged from -72.7% to -87.3% (median: -82.9%). The volume changes of our two patients with progressive disease were 187.2% and 193.6%. respectively. At the end of observation, 36 (62.1%) patients were alive, and 22 (37.9%) were dead. Forty-five (77.6%) patients achieved durable local control, whereas 13 (22.4%) patients had local failures (pathological confirmation, N=7; disease progression in serial imaging studies, N=6). The 2-year local control rate and overall survival rate were 54.9% and 72.1%, respectively.
Table 1: Demographic information of enrolled patents (n = 58)
Characteristic |
n (%) |
|---|---|
Sex |
|
Male |
56 (96.6) |
Female |
2 (3.4) |
Age, years, median (range) |
53.8 (30–79) |
Tumor site |
|
Oropharynx |
31 (53.4) |
Hypopharynx |
27 (46.6) |
Pathologic differentiation |
|
Well |
2 (3.4) |
Moderate |
30 (51.7) |
Poor |
16 (27.6) |
N/A |
10 (17.2) |
Tumor status |
|
T3 |
14 (24.1) |
T4a |
38 (65.6) |
T4b |
6 (10.3) |
Nodal status |
|
N0 |
5 (8.6) |
N1 |
7 (12.1) |
N2a |
0 (0.0) |
N2b |
26 (44.8) |
N2c |
12 (20.7) |
N3 |
8 (13.8) |
Stage |
|
III |
5 (8.6) |
IVA |
41 (70.7) |
IVB |
12 (20.7) |
N/A: not available.
Pearson's correlation analysis revealed that tumor size was modestly correlated with levels of lipid methylene (1.3 ppm) and levels of lipid unsaturated fatty acyls (2.0 ppm) on MR spectroscopy (correlation coefficients = -0.272 and -0.260, and p = 0.039 and 0.049 respectively), as well as with TLG and MTV (correlation coefficients = 0.706 and 0.690 respectively, and p both < 0.001) on 18F-FDG PET/CT. Among the metabolites detected on MR spectroscopy, choline level was significant correlated with creatine level (p < 0.001) and myo-inositol level (p = 0.003). The resonance level of Glx was found to have significant correlation with lipids levels at 1.3 and 2.0 ppm (p both <0.001). Lipid methylene (1.3 ppm) level was modestly correlated with TLG (p = 0.05) and MTV (p = 0.048), while Glx level did not correlate with any 18F-FDG PET/CT parameters.
Log-rank test of Kaplan-Meier survival analysis for 2-year local tumor recurrence revealed that age > 60 years (p=0.041), creatine level ≦ 6.02 mM on MR spectroscopy (p = 0.041), Glx level > 3.31 mM on MR spectroscopy (p = 0.001) and TLG > 402.24 g/mL × mL on 18F-FDG PET/CT (p = 0.002) were significantly correlated with poor 2-year local control rate (Table 2). The remaining variables, including age, tumor site, T status, N status, tumor size, creatine, choline, myo-inositol, lipid methyl (0.9 ppm), lipid methylene (1.3 ppm), and lipid unsaturated fatty acyls (2.0 ppm), SUVmax, and MTV, showed no significant impacts on local control. Univariate Cox regression analysis also identified Glx (p = 0.005) and TLG (p = 0.005) as significant predictors of 2-year local control rate, and age (p = 0.053) as borderline significant predictor of 2-year local control. In multivariate Cox regression, age (p = 0.017), Glx (p = 0.021), and TLG (p = 0.028) remained as significant independent predictors of 2-year local control (Table 3). We further assessed whether combination of these three independent predictors could help predict local control of OHSCC after chemoradiotherapy. A prognostic scoring system was constructed based on the sum of the three predictors, including age > 60 years, Glx level on MR spectroscopy > 3.31 mM, and TLG level on 18F-FDG PET/CT > 402.24 g/mL × mL. The presence of each risk factor assigned a score of 1 while an absence of a risk factor scored 0, resulting in a total score of 0, 1, 2 or 3. It was found that patients with cumulated scores of 0, 1, 2 and 3 differed significantly regarding 2-year local control rates (95.0%, 77.8%, 42.9% and 0%, respectively, Figure 1). Patients with scores of 0–1 had significantly better 2-year local control rates than patients with scores of 2–3 (86.8% versus 33.3%, p=0.003). Multivariate Cox proportional hazard analysis demonstrated a poorer local control rate in patients with a score of 1–2 than those with a score of 0 (hazard ratio [HR] = 5.220 and 21.494; p = 0.140 and 0.006, respectively), while patients with a score of 3 showed the poorest local control rate (HR = 314.834; p < 0.001) (Table 4).
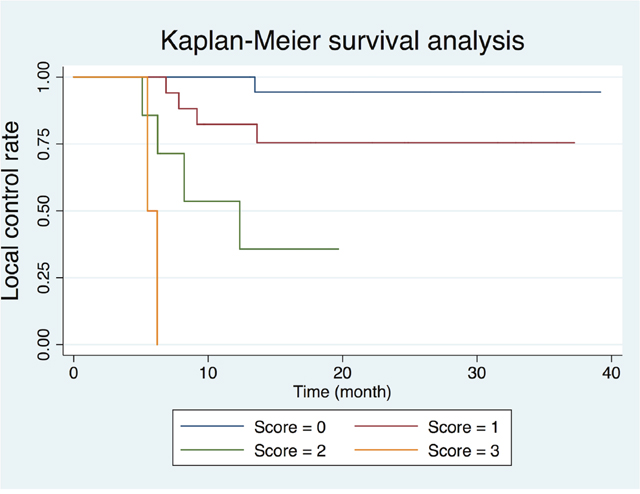
Figure 1: Kaplan-Meier plot based on the risk score generated by age, glutamine and glutamate (Glx) on MR spectroscopy, and total lesion glycolysis on 18F-FDG PET/CT.
Table 2: Kaplan-Meier analysis of parameters and two-year local control rates
Parameters |
n |
2-year local |
p value |
|---|---|---|---|
Age (years) |
|
|
0.041 |
≤ 60 |
45 |
82.2 |
|
> 60 |
13 |
17.8 |
|
Primary tumor site |
|
|
0.651 |
Oropharynx |
31 |
80.6 |
|
Hypopharynx |
27 |
74.1 |
|
T status |
|
|
0.323 |
T3 |
14 |
85.7 |
|
T4 |
44 |
75.0 |
|
N status |
|
|
0.855 |
N0-1 |
12 |
75.0 |
|
N2-3 |
46 |
78.3 |
|
Tumor size (cm)# |
|
|
0.095 |
≤ 4.71 |
25 |
88.0 |
|
> 4.71 |
33 |
69.7 |
|
Creatine (mM)* |
|
|
0.041 |
≤ 6.02 |
36 |
69.4 |
|
> 6.02 |
22 |
90.9 |
|
Choline (mM)* |
|
|
0.111 |
≤ 3.33 |
38 |
73.7 |
|
> 3.33 |
20 |
85.0 |
|
Myo-Inositol (mM)* |
|
|
0.219 |
≤ 6.05 |
34 |
82.4 |
|
> 6.05 |
24 |
70.8 |
|
Glx (mM)* |
|
|
0.001 |
≤ 3.31 |
34 |
88.2 |
|
> 3.31 |
24 |
62.5 |
|
Lipid methyl (δ 0.9 ppm, mM)* |
|
|
0.772 |
≤ 0.093 |
27 |
81.5 |
|
> 0.093 |
31 |
74.2 |
|
Lipid methylene (δ 1.3 ppm, mM)* |
|
|
0.205 |
≤ 734.31 |
47 |
74.5 |
|
> 734.31 |
11 |
90.9 |
|
Lipid unsaturated (δ 2.0 ppm, mM)* |
|
|
0.342 |
≤ 0.016 |
23 |
73.9 |
|
> 0.016 |
35 |
80.0 |
|
Standardized uptake value (g/mL)+ |
|
|
0.154 |
≤17.28 |
25 |
72.0 |
|
>17.28 |
31 |
80.6 |
|
Metabolic tumor volume (mL)+ |
|
|
0.092 |
≤ 18.07 |
15 |
93.3 |
|
> 18.07 |
41 |
70.7 |
|
Total lesion glycolysis (g/mL × mL)+ |
|
|
0.002 |
≤ 402.24 |
42 |
83.3 |
|
> 402.24 |
14 |
57.1 |
|
# Measurement based on gadolinium-enhanced fat-saturated T1-weighted MR images.
* Measurement based on MR spectroscopy.
+ Measurement based on 18F-Fluorodeoxyglucose-positron emission tomography.
Glx: glutamine and glutamate; ppm: parts per million; mM: millimole.
Table 3: Cox regression analysis of parameters associated with 2-year local control rate
Local failure (n=13) |
Univariate analysis |
Multivariate stepwise |
||||
|---|---|---|---|---|---|---|
Parameter |
HR |
95% CI |
p value |
HR |
95% CI |
p value |
Age (> 60 vs ≤ 60) |
3.246 |
0.986 - 10.692 |
0.053 |
4.823 |
1.327 - 17.536 |
0.017 |
Primary tumor site |
1.314 |
0.400 - 4.310 |
0.652 |
|
|
|
T status (T4 vs T3) |
2.131 |
0.459 - 9.890 |
0.334 |
|
|
|
N status (N2-3 vs N0-1) |
0.884 |
0.234 - 3.337 |
0.855 |
|
|
|
Tumor size# |
2.950 |
0.779 - 11.165 |
0.111 |
|
|
|
Creatine* |
0.155 |
0.020 - 1.213 |
0.076 |
|
|
|
Choline* |
0.219 |
0.028 - 1.710 |
0.148 |
|
|
|
Myo-Inositol* |
2.075 |
0.632 - 6.808 |
0.229 |
|
|
|
Glx* |
8.954 |
1.926 - 41.619 |
0.005 |
6.449 |
1.319 - 31.519 |
0.021 |
Lipid methyl (δ 0.9 ppm)* |
1.191 |
0.363 - 3.907 |
0.773 |
|
|
|
Lipid methylene (δ 1.3 ppm)* |
0.287 |
0.037 - 2.249 |
0.235 |
|
|
|
Lipid unsaturated (δ 2.0 ppm)* |
0.567 |
0.173 - 1.857 |
0.348 |
|
|
|
Standardized uptake value+ |
0.420 |
0.123 - 1.436 |
0.167 |
|
|
|
Metabolic tumor volume+ |
4.922 |
0.629 - 38.492 |
0.129 |
|
|
|
Total lesion glycolysis+ |
5.861 |
1.685 - 20.387 |
0.005 |
4.840 |
1.183 - 19.811 |
0.028 |
# Measurement based on gadolinium-enhanced fat-saturated T1-weighted MR images.
* Measurement based on MR spectroscopy.
+ Measurement based on 18F-Fluorodeoxyglucose-positron emission tomography.
Glx: glutamine and glutamate; HR: hazard ratio; CI: confidence interval; ppm, parts per million.
Table 4: Risk score based on Glx on MR spectroscopy and total lesion glycolysis on 18F-FDG PET/CT
Score |
No. of patients |
HR |
95% CI |
p value |
|---|---|---|---|---|
0 |
23 |
1.000 |
Reference |
|
1 |
22 |
5.220 |
0.583 - 46.770 |
0.140 |
2 |
10 |
21.494 |
2.375 - 194.554 |
0.006 |
3 |
3 |
314.834 |
14.268 - 6947.230 |
< 0.001 |
Glx: glutamine and glutamate; HR: hazard ratio; CI: confidence interval.
DISCUSSION
Our results demonstrated the value of pretreatment 1H MR spectroscopy at 3 T and 18F-FDG PET/CT for patients with advanced OHSCC for predicting local control following chemoradiotherapy. Elevated Glx levels on 1H MR spectroscopy, old age and high TLG on 18F-FDG PET/CT were adversely correlated with the 2-year local control rate. Glutamine is the most abundant amino acid in the body and can be an essential nutrient for cell growth and viability. It is a major anaplerotic substrate in proliferating cells by conversion into α-ketoglutarate for biosynthesis. Independent lines of investigation have demonstrated that cancer cells may be addicted to glutamine [24–26]. Elevation of Glx levels due to glutamine scavenge of tumors is supported by several ex vivo 1H MR spectroscopy studies from investigating tissue samples [12–14, 24–26], primarily for differentiating cancer from normal tissues. Yuneva et al. [26] reported that some proto-oncogene MYC transformation were dependent on glutamine, and understanding the linkage of glutamine metabolism to cell viability may provide new insights for cancer treatment. In a study exploring the metabolic signatures of HNSCC, Somashekar et al. [13] reported that elevated levels of Glx and choline-containing compounds were found in HNSCC tissues, suggesting their association with active glycolysis, increased amino acids influx into the tricarboxylic acid cycle, altered energy metabolism, and membrane choline phospholipid metabolism. To our knowledge, our study is the first in vivo 1H MR spectroscopy investigation to demonstrate elevated Glx resonance levels in OHSCC patients as a possible adverse prognostic factor.
Choline and its derivatives are important constituents in phospholipid metabolism of cell membranes and identified as markers of cell proliferation. Previous in vitro and in vivo 1H MR spectroscopy studies showed that the choline-to-creatine ratio was significantly higher in HNSCC than in normal tissue or post-therapeutic tissue [7, 9]. In a study by Bezabeh et al. [8], significantly elevated choline-to-creatine ratio was observed in tumor tissue specimens of HNSCC patients with treatment failure, suggesting that ex vivo 1H MR spectroscopy of tissue samples has the potential to predict response to the treatment in HNSCC. in vivo 1H MR spectroscopy studies of HNSCC with 1.5T MR scanner, King et al reported that both the pretreatment choline and change in choline early during a course of treatment did not predict clinical outcome [10], while the presence of choline in a post-treatment mass, instead of a percentage change in choline ratios, may serve as a marker of residual cancer [11]. In the present prospective in vivo 1H MR spectroscopy study of OHSCC using a 3 T MR scanner, the pretreatment tumor not choline level did not demonstrate prognostic value for tumor control after chemoradiotherapy.
Myo-inositol is a precursor in the phosphatidylinositol cycle and a source of several second messengers. Myo-inositol is involved in the activation of protein C kinase. Protein C kinase leads to the production of protylotic enzymes, which are found more often in malignant and aggressive primary tumors. Elevation of myo-inositol may occur either by rapid cellular proliferation or cellular distraction [27]. Previous studies have showed that myo-inositol acts as a cancer chemoprevention agent [28, 29]. On the other hand, lipids function as energy storage molecules, structural components of cell membranes, and signaling molecules involved in cell growth. Increased lipid biosynthesis is a characteristic feature of cancer [30]. In an in vivo 1H MR spectroscopy study at 3 T, Lin et al. [15] identified elevated lipid resonance levels in uterine cervical carcinomas, which help to predict persistent disease following chemoradiotherapy. However, in the present study, neither myo-inositol nor lipid resonance levels had prognostic value in local tumor control of OHSCC after chemoradiotherapy.
It is difficult to explain why Cho, myo-inositol and lipid resonance levels did not demonstrate significant predictive values in our study. We thought that some of our OHSCC cases presented with intratumoral heterogeneity, in terms of cellular proliferation, vascularity or necrosis, contributing to variable results about Cho, myo-inositol and lipid metabolites on MR spectroscopy. Therefore, it should be cautious to use MR spectroscopy alone to predict prognosis of OHSCC. MR spectroscopy should be viewed together with other parameters, being age and TLG in our cases.
18F-FDG PET/CT, an imaging modality that incorporates both anatomical localization and functional information, and it is now increasingly used for pretreatment evaluation of OHSCC patients. It can provide three quantitative parameters, including SUV which reflects glucose utilization, MTV which reflects tumor burden, and TLG which integrates both glucose utilization and tumor burden. However, the prognostic significance of these parameters in HNSCC patients still remains controversial. Pretreatment SUVmax of 18F-FDG PET has been reported to be an independent prognostic factor of local control in HNSCC treated by radiotherapy or chemotherapy [5, 16–18]. However, some other studies showed that MTV and TLG, instead of SUVmax, were adverse prognostic factors for local failure [19–22]. In the present study, we found that tumor TLG had a better prognostic value than SUVmax or MTV, consistent with those studies showing the superior usefulness of tumor TLG in predicting treatment outcome in oropharyngeal SCC [20, 22]. This can be plausibly explained by tumor TLG incorporating both metabolic activity and active tumor volume and, hence, better reflection of tumor characteristics. Indeed, our data also revealed that T stage and tumor size were not significant prognostic parameters. T stage for OHSCC takes into account only the greatest single dimension of the primary tumor (T1–T3) or infiltration of surrounding tissue (T4) based on clinical examination and morphological imaging. However, neither clinical examination nor morphological imaging can differentiate active tumor reliably from contiguous inflammatory tissue or tumor-related edema. Therefore, their size measurements might not always indicative the actual active tumor burden, and, hence, would not significantly imply the probability of local control.
The use of chemoradiotherapy has increased substantially in the elderly patients of head and neck cancer [31]. Although the addition of chemotherapy to radiation has proven efficacious in many randomized controlled trials, it may be less effective for head and neck cancer in an older patient population [32, 33]. Our patients in this prospective cohort study were uniformly treated with cisplatin-based concurrent chemoradiation therapy, and our results showed that advanced age was associated with local failure within 2 years. Furthermore, our study showed that the combination of old age with high TLG and elevated Glx levels in the primary tumor signified a subgroup of OHSCC patients at high risk of local failure after chemoradiation. An early prediction of failure in such patients may urge close surveillance of posttreated primary sites to ensure timely detection of potentially salvageable lesions, or, alternatively, may allow for therapeutic modification, including the selection of suitable candidates for surgery or trials of novel treatment approaches.
The primary limitation of the present study was that the head and neck is a technically difficult anatomical region in which to obtain high-quality MR spectra consistently because of motion and susceptibility artifacts. Sixteen of our 77 (20.7%) patients were excluded from the analysis due to suboptimal spectra. Further refinement of respiratory gating and anti-susceptibility technology is warranted. Second, the sample size was limited in this prospective study. Further study with more subjects is suggested to draw more persuasive arguments. In addition, only primary tumors with shortest axial diameters >15 mm were investigated. Moreover, we did not have smaller tumors or normal controls for comparison because interpretable MR spectra are exceedingly difficult to obtain in such thin pharyngeal walls. Finally, the sample size in this study might not large enough to draw a definite conclusion. Further large-scale studies are needed to establish the predictive role of 3T MR spectroscopy in OHSCC.
In conclusion, Glx on 1H MR spectroscopy at 3 T was the independent prognostic factor for local control of OHSCC patients treated with chemoradiotherapy, and its combination with age and TLG may help identify a subgroup of patients at high risk of developing local failure.
MATERIALS AND METHODS
Patients
The study protocol was approved by the Institutional Review Board of our Hospital. All participants provided informed written consent, and the study adhered to the tenets of Declaration of Helsinki. From August 2013 to September 2015, patients with histologically proven OHSCC, who were scheduled to receive definitive chemoradiotherapy with curative intent, were eligible for this prospective study. The study subjects underwent a thorough pretreatment evaluation, including MRI and 18F-FDG PET/CT. The inclusion criteria included the following: the presence of primary tumors with shortest axial diameters > 15 mm on MR images; adults aged; ability to provide informed consent; and no contraindications to MR scanning, such as claustrophobia or cardiac pacemaker. Patients with previous cancers, a synchronous malignant tumor, or distant metastasis at presentation were excluded.
All participants underwent intensity-modulated radiotherapy or volumetric modulated arc therapy using 6-MV photon beams at a daily fraction of 2 Grays (Gy), with five fractions per week. The radiotherapy dose was 46-50 Gy for all subclinical risk areas and 72 Gy for gross tumor areas. Concurrent chemotherapy consisted of intravenous cisplatin (50 mg/m2) on day 1, oral tegafur (800 mg/day) plus oral leucovorin (60 mg/day) from day 1 to day 14. This regimen was delivered every 14 days through the course of radiotherapy [34]. After treatment, patients underwent a routine clinical follow-up every 1 to 3 months. Posttreatment MRI was performed three months after completion of chemoradiotherapy, and follow-up MRI or CT has performed alternatively every six months after that or in response to clinical deterioration. The endoscopic biopsy was performed, if possible, for any suspicious residual/recurrent tumors. Patients without pathological-proven local failure were monitored over a minimum follow-up of 12 months after initial treatment or until death.
MRI and MR spectroscopy
MRI was performed using a 3-T scanner (Magnetom Trio with TIM, Siemens, Erlangen, Germany) with head and neck matrix coil. All patients underwent conventional head and neck MRI before and after gadolinium-diethylenetriaminepenta-acetic acid (Gd-DTPA) injection. Unenhanced T1-weighted turbo spin echo (TSE) images (TE ms/TR ms: 11/400 ; flip angle: 150 degree) and T2-weighted fat-suppressed TSE images (TE ms/TR ms: 88/5380, flip angle: 120 degree) were acquired in the axial and coronal planes. Field of view (FOV) was 220 mm in axial projection and was 300 mm in coronal projection. After Gd-DTPA intravenous injection, T1-weighted fat-suppressed axial, sagittal, and coronal TSE sequences (TE ms/TR ms: 11/415 ; flip angle: 130 degree) were obtained sequentially.
After that, triplane localizer MR spectroscopy with point-resolved spectroscopy (PRESS) was performed by selecting a 12 mm × 12 mm × 12 mm spectroscopic volume prescribed by a neuroradiologist with more than 20 years’ experience in head and neck radiology. With MRI guidance, the volume of interest was meticulously placed within the primary tumor, while visually cystic or necrotic areas were avoided. The B0 shimming parameters were optimized using a rapid B0 mapping method which takes advantage of the combination of dynamic shimming and continuous frequency updates [35]. For each voxel placement, automated optimization of gradient shimming was performed. The water line width within the PRESS box was measured after shimming. If the value was > 15 Hz, the PRESS box was repositioned and re-shimmed. B0 maps (dual gradient-echo; TR 50 ms, TEs 7.6 ms, and 17.6 ms) were then obtained to ensure there was no significant B0 inhomogeneity or susceptibility artifacts. MR spectroscopy was acquired using the following parameters: TR/TE, 2000 ms/35 ms; 128 averages; vector size, 1024 points; and bandwidth, 1200 Hz. Water suppression was achieved using band selective inversion with gradient dephasing. Non-water suppressed spectra as concentration references were also measured with the same scan parameters, except with the acquisition of only four signal averages to reduce scan time to 16 second. The flip angle was 90 degree and TR was 2000 ms for both non-water suppressed and water suppressed scans. The total scan time for MR spectroscopy was approximately 7 minutes.
18F-FDG PET/CT
18F-FDG PET/CT scans were performed using an integrated PET/CT system (Discovery ST 16, GE Healthcare, Milwaukee, WI). The axial and transaxial fields of view (FOVs) of the PET component are 15.7 and 70 cm, respectively. The transaxial resolution is 6.1-mm full width at half maximum (FWHM) 1 cm off center. The length of the PET table is 275 cm. Patients were instructed to fast for at least 6 hours before the examination. Before PET acquisition, helical CT from the head to the proximal thigh was performed using the following parameters: 100 mA, 100 kVp, collimation 16 mm x 3 mm, tube rotation time 0.5 s, pitch 1.5, and table speed 35 mm/s. Subsequently, PET emission scans were performed between 50 min and 70 min after injection of 18F-FDG (370 MBq) with the coverage from the head to the proximal thigh. Images were acquired in the two-dimensional mode, with 3-min per table position. The PET emission data were reconstructed using CT data for attenuation correction using the ordered subsets expectation maximization method with 10 subsets and 4 iterations.
Data analysis
1H MR spectroscopy data were analyzed using LCModel software, version 6.3-0K (Stephen Provencher Inc, Canada) on a Linux workstation, and eddy current correction was performed. Spectra were phased and analyzed based on the “Tumor” basis of the LCModel software, which applied a linear combination of multiple spectra defined on the “Tumor” basis, by generating a Gaussian peak between a minimum and expected linewidth for each simulated peak, then applying a Lorentzian line-broadening to them all (LCModel User’s Manual). The resonances were quantified relative to the water signal. The Cramer-Rao lower bound (CRLB) value, which simultaneously accounts for both line width and signal-to-noise ratio, was calculated as an estimate of the error in metabolite quantification. MR spectra were excluded if the CRLB exceeded 20% for creatine (δ 3.0 and 3.9 ppm), choline (δ 3.2 ppm), myo-Inositol (δ 3.5 ppm), lipid methyl (δ 0.9 ppm) and lipid methylene (δ 1.3 ppm), and 30% for Glx (δ 2.2-2.4 ppm), lipid unsaturated (δ 2.0 ppm). A representative processing of the MR spectrum is shown in Figure 2.
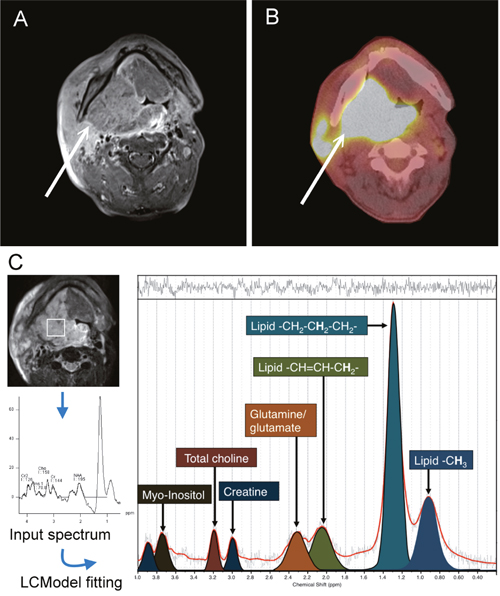
Figure 2: A 54-year-old man with right tonsillar squamous cell carcinoma. (A) Axial contrast-enhanced fat-saturated T1-weighted MR image. (B) The corresponding 18F-FDG PET/CT image. (C) The corresponding 1H-MR spectrum of this subject. Resonances of lipid δ 0.9 ppm (methyl, -CH3), δ 1.3 ppm (-CH2-CH2-CH2-), δ 2.0 ppm (-CH=CH-CH2-), glutamate and glutamine (Glx) δ 2.2-2.4 ppm, creatine δ 3.0 and 3.9 ppm, total choline resonance δ 3.2 ppm and myo-inositol δ 3.5 ppm, were quantified using LCModel software (Stephen Provencher, Canada).
For 18F-FDG PET/CT analysis, the SUV and MTV values of primary tumors were measured from attenuation-corrected 18F-FDG PET images using PMOD software (PMOD Technologies Ltd, Zurich, Switzerland). The boundaries were drawn sufficiently wide to include the primary tumor in axial, coronal, and sagittal 18F-FDG PET scans. An SUV threshold of 2.5 was used for the delineation of MTV [21, 36]. The contour around the target lesion inside the boundaries was automatically produced and the voxels were presenting SUV intensity > 2.5 within the contouring margin were incorporated to define MTV. TLG was calculated as the product of lesion mean SUV and MTV. The SUV, MTV, and TLG of the target lesions were automatically determined by the PMOD 3.2 software package (PMOD Technologies Ltd, Zurich, Switzerland).
Outcome determination and statistical analysis
Local control was measured from the first day of chemoradiotherapy treatment to the time of local failure or the last follow-up. Local failure was determined by histological confirmation or by a serial increase in lesion size on follow-up imaging. The potential predicting local control parameters included age, tumor site, T status, N status, tumor size, creatine, choline, myo-inositol, Glx, lipid methyl (0.9 ppm), lipid methylene (1.3 ppm), and lipid unsaturated fatty acyls (2.0 ppm) on 1H MR spectroscopy as well as SUVmax, MTV, and TLG on 18F-FDG PET/CT. The optimal cutoff values of these variables were determined using areas under the receiver operating characteristic curve (AUC). Correlations among the variables were assessed using Pearson’s correlation. ROC curve analysis was performed for age, tumor size, levels of metabolites on MR spectroscopy and 18F-FDG PET/CT parameters to get the optimal cut-off values of theses parameters to predict the occurrence of local recurrence within 2 years. These continuous variables were transformed into binary variables as “higher” and “equal or lower” than the cut-off values determined by ROC curve analysis. In univariate analysis, local control rates according to the associated parameters were plotted using the Kaplan-Meier method with the log-rank test for comparing the significance. Univariate Cox regression analysis was used to identify predictors of the two-year local control rates. Variables in univariate analyses were then entered into the multivariate Cox regression model, and a stepwise forward selection was used to identify significant independent predictors. A p value less than 0.05 was considered to be statistically significant. Data were analyzed using SPSS version 20.0.0 (IBM Corp. Released 2011. IBM SPSS Statistics for Mac, Version 20.0. Armonk, NY: IBM Corp.).
Abbreviations
AUC: areas under the receiver operating characteristic curve; CRLB: Cramer-Rao lower bound; CT: computed tomography; DTPA: gadolinium diethylenetriaminepenta-acetic acid; 18F-FDG PET/CT: [18F]-fluorodeoxyglucose positron emission tomography/CT; FOVs: fields of view; FWHM: full width at half maximum; Glx: glutamine and glutamate; Gy: Grays; 1H MR: proton magnetic resonance; HNSCC: head and neck squamous cell carcinoma; mM: millimole; MRI: magnetic resonance imaging; MTV: metabolic tumor volume; OHSCC: oropharyngeal and hypopharyngeal squamous cell carcinoma; ppm: parts per million; PRESS: point-resolved spectroscopy; SUV: standardized uptake value; T: tesla; TLG: total lesion glycolysis; TSE: turbo spin echo.
Author contributions
Chih-Hua Yeh: Design of the work, data collection, data analysis and interpretation, drafting the article, critical revision of the article, and final approval of the version to be published.
Gigin Lin: Design of the work, data collection, data analysis and interpretation, drafting the article, critical revision of the article, and final approval of the version to be published.
Jiun-Jie Wang: Data analysis and interpretation, critical revision of the article, and final approval of the version to be published.
Chien-Yu Lin: Data collection, drafting the article, and final approval of the version to be published.
Shang-Yueh Tsai: Data analysis and interpretation, and final approval of the version to be published.
Yu-Chun Lin: Data collection, data analysis, and final approval of the version to be published.
Yi-Ming Wu: Data collection, data analysis, and final approval of the version to be published.
Sheung-Fat Ko: Critical revision of the article, and final approval of the version to be published.
Hung-Ming Wang: Data collection, and final approval of the version to be published.
Sheng-Chieh Chan: Data collection, data analysis, and final approval of the version to be published.
Tzu-Chen Yen: Data collection, data analysis, and final approval of the version to be published.
Chun-Ta Liao: Data collection and final approval of the version to be published.
Shu-Hang Ng: Conception and design of the work, data interpretation, critical revision of the article, and final approval of the version to be published.
CONFLICTS OF INTEREST
The authors have declared no conflicts of interest.
FUNDING
This work was supported by grants from the National Science Council-Taiwan (102-2314-B-182A-098-MY2) and Chang Gung Medical Foundation grant CIRPG3E0022.
REFERENCES
1. Wilson L, Enepekides D, Higgins K. Management of oropharyngeal cancer: a cross-sectional review of institutional practice at a large Canadian referral centre. J Otolaryngol Head Neck Surg. 2014; 43:19. https://doi.org/10.1186/1916-0216-43-19.
2. Urba SG, Moon J, Giri PG, Adelstein DJ, Hanna E, Yoo GH, Leblanc M, Ensley JF, Schuller DE. Organ preservation for advanced resectable cancer of the base of tongue and hypopharynx: a Southwest Oncology Group Trial. J Clin Oncol. 2005; 23:88-95. https://doi.org/10.1200/JCO.2005.04.017.
3. Studer G, Lutolf UM, El-Bassiouni M, Rousson V, Glanzmann C. Volumetric staging (VS) is superior to TNM and AJCC staging in predicting outcome of head and neck cancer treated with IMRT. Acta Oncol. 2007; 46:386-94. https://doi.org/10.1080/02841860600815407.
4. Ohnishi K, Shioyama Y, Hatakenaka M, Nakamura K, Abe K, Yoshiura T, Ohga S, Nonoshita T, Yoshitake T, Nakashima T, Honda H. Prediction of local failures with a combination of pretreatment tumor volume and apparent diffusion coefficient in patients treated with definitive radiotherapy for hypopharyngeal or oropharyngeal squamous cell carcinoma. J Radiat Res. 2011; 52:522-30. https://doi.org/JST.JSTAGE/jrr/10178.
5. Ng SH, Lin CY, Chan SC, Yen TC, Liao CT, Chang JT, Ko SF, Wang HM, Huang SF, Lin YC, Wang JJ. Dynamic contrast-enhanced MR imaging predicts local control in oropharyngeal or hypopharyngeal squamous cell carcinoma treated with chemoradiotherapy. PLoS One. 2013; 8:e72230. https://doi.org/10.1371/journal.pone.0072230.
6. Kim S, Loevner LA, Quon H, Kilger A, Sherman E, Weinstein G, Chalian A, Poptani H. Prediction of response to chemoradiation therapy in squamous cell carcinomas of the head and neck using dynamic contrast-enhanced MR imaging. AJNR Am J Neuroradiol. 2010; 31:262-8. https://doi.org/10.3174/ajnr.A1817.
7. Mukherji SK, Schiro S, Castillo M, Kwock L, Muller KE, Blackstock W. Proton MR spectroscopy of squamous cell carcinoma of the extracranial head and neck: in vitro and in vivo studies. AJNR Am J Neuroradiol. 1997; 18:1057-72.
8. Bezabeh T, Odlum O, Nason R, Kerr P, Sutherland D, Patel R, Smith IC. Prediction of treatment response in head and neck cancer by magnetic resonance spectroscopy. AJNR Am J Neuroradiol. 2005; 26:2108-13.
9. Bisdas S, Baghi M, Huebner F, Mueller C, Knecht R, Vorbuchner M, Ruff J, Gstoettner W, Vogl TJ. In vivo proton MR spectroscopy of primary tumours, nodal and recurrent disease of the extracranial head and neck. Eur Radiol. 2007; 17:251-7. https://doi.org/10.1007/s00330-006-0294-2.
10. King AD, Yeung DK, Yu KH, Mo FK, Bhatia KS, Tse GM, Vlantis AC, Wong JK, Hu CW, Ahuja AT. Pretreatment and early intratreatment prediction of clinicopathologic response of head and neck cancer to chemoradiotherapy using 1H-MRS. J Magn Reson Imaging. 2010; 32:199-203. https://doi.org/10.1002/jmri.22224.
11. King AD, Yeung DK, Yu KH, Mo FK, Hu CW, Bhatia KS, Tse GM, Vlantis AC, Wong JK, Ahuja AT. Monitoring of treatment response after chemoradiotherapy for head and neck cancer using in vivo 1H MR spectroscopy. Eur Radiol. 2010; 20:165-72. https://doi.org/10.1007/s00330-009-1531-2.
12. El-Sayed S, Bezabeh T, Odlum O, Patel R, Ahing S, MacDonald K, Somorjai RL, Smith IC. An ex vivo study exploring the diagnostic potential of 1H magnetic resonance spectroscopy in squamous cell carcinoma of the head and neck region. Head Neck. 2002; 24:766-72. https://doi.org/10.1002/hed.10125.
13. Somashekar BS, Kamarajan P, Danciu T, Kapila YL, Chinnaiyan AM, Rajendiran TM, Ramamoorthy A. Magic angle spinning NMR-based metabolic profiling of head and neck squamous cell carcinoma tissues. J Proteome Res. 2011; 10:5232-41. https://doi.org/10.1021/pr200800w.
14. Yonezawa K, Nishiumi S, Kitamoto-Matsuda J, Fujita T, Morimoto K, Yamashita D, Saito M, Otsuki N, Irino Y, Shinohara M, Yoshida M, Nibu K. Serum and tissue metabolomics of head and neck cancer. Cancer Genomics Proteomics. 2013; 10:233-8.
15. Lin G, Lai CH, Tsai SY, Lin YC, Huang YT, Wu RC, Yang LY, Lu HY, Chao A, Wang CC, Ng KK, Ng SH, Chou HH, et al. 1H MR spectroscopy in cervical carcinoma using external phase array body coil at 3.0 Tesla: prediction of poor prognostic human papillomavirus genotypes. J Magn Reson Imaging. 2017; 45:899-907. https://doi.org/10.1002/jmri.25386.
16. Allal AS, Dulguerov P, Allaoua M, Haenggeli CA, El-Ghazi el A, Lehmann W, Slosman DO. Standardized uptake value of 2-[(18)F] fluoro-2-deoxy-D-glucose in predicting outcome in head and neck carcinomas treated by radiotherapy with or without chemotherapy. J Clin Oncol. 2002; 20:1398-404.
17. Allal AS, Slosman DO, Kebdani T, Allaoua M, Lehmann W, Dulguerov P. Prediction of outcome in head-and-neck cancer patients using the standardized uptake value of 2-[18F]fluoro-2-deoxy-D-glucose. Int J Radiat Oncol Biol Phys. 2004; 59:1295-300. https://doi.org/10.1016/j.ijrobp.2003.12.039.
18. Torizuka T, Tanizaki Y, Kanno T, Futatsubashi M, Naitou K, Ueda Y, Ouchi Y. Prognostic value of 18F-FDG PET in patients with head and neck squamous cell cancer. AJR Am J Roentgenol. 2009; 192:W156-60. https://doi.org/10.2214/AJR.08.1429.
19. La TH, Filion EJ, Turnbull BB, Chu JN, Lee P, Nguyen K, Maxim P, Quon A, Graves EE, Loo BW Jr, Le QT. Metabolic tumor volume predicts for recurrence and death in head-and-neck cancer. Int J Radiat Oncol Biol Phys. 2009; 74:1335-41. https://doi.org/10.1016/j.ijrobp.2008.10.060.
20. Lim R, Eaton A, Lee NY, Setton J, Ohri N, Rao S, Wong R, Fury M, Schoder H. 18F-FDG PET/CT metabolic tumor volume and total lesion glycolysis predict outcome in oropharyngeal squamous cell carcinoma. J Nucl Med. 2012; 53:1506-13. https://doi.org/10.2967/jnumed.111.101402.
21. Seol YM, Kwon BR, Song MK, Choi YJ, Shin HJ, Chung JS, Cho GJ, Lee JC, Lee BJ, Wang SG, Kim HJ, Kim WT, Kim SJ, et al. Measurement of tumor volume by PET to evaluate prognosis in patients with head and neck cancer treated by chemo-radiation therapy. Acta Oncol. 2010; 49:201-8. https://doi.org/10.3109/02841860903440270.
22. Cheng NM, Chang JT, Huang CG, Tsan DL, Ng SH, Wang HM, Liao CT, Lin CY, Hsu CL, Yen TC. Prognostic value of pretreatment (1)(8)F-FDG PET/CT and human papillomavirus type 16 testing in locally advanced oropharyngeal squamous cell carcinoma. Eur J Nucl Med Mol Imaging. 2012; 39:1673-84. https://doi.org/10.1007/s00259-012-2186-9.
23. Chan SC, Cheng NM, Hsieh CH, Ng SH, Lin CY, Yen TC, Hsu CL, Wan HM, Liao CT, Chang KP, Wang JJ. Multiparametric imaging using F-18-FDG PET/CT heterogeneity parameters and functional MRI techniques: prognostic significance in patients with primary advanced oropharyngeal or hypopharyngeal squamous cell carcinoma treated with chemoradiotherapy. Oncotarget. 2017; 8:62606-21. https://doi.org/10.18632/oncotarget.15904.
24. DeBerardinis RJ, Mancuso A, Daikhin E, Nissim I, Yudkoff M, Wehrli S, Thompson CB. Beyond aerobic glycolysis: transformed cells can engage in glutamine metabolism that exceeds the requirement for protein and nucleotide synthesis. Proc Natl Acad Sci U S A. 2007; 104:19345-50. https://doi.org/10.1073/pnas.0709747104.
25. Wise DR, DeBerardinis RJ, Mancuso A, Sayed N, Zhang XY, Pfeiffer HK, Nissim I, Daikhin E, Yudkoff M, McMahon SB, Thompson CB. Myc regulates a transcriptional program that stimulates mitochondrial glutaminolysis and leads to glutamine addiction. Proc Natl Acad Sci U S A. 2008; 105:18782-7. https://doi.org/10.1073/pnas.0810199105.
26. Yuneva M, Zamboni N, Oefner P, Sachidanandam R, Lazebnik Y. Deficiency in glutamine but not glucose induces MYC-dependent apoptosis in human cells. J Cell Biol. 2007; 178:93-105. https://doi.org/10.1083/jcb.200703099.
27. Kousi E, Tsougos I, Tsolaki E, Fountas KN, Theodorou K, Fezoulidis I, Kapsalaki E, Kappas C. Spectroscopic evaluation of glioma grading at 3T: the combined role of short and long TE. ScientificWorldJournal. 2012; 2012:546171. https://doi.org/10.1100/2012/546171.
28. Vucenik I, Shamsuddin AM. Cancer inhibition by inositol hexaphosphate (IP6) and inositol: from laboratory to clinic. J Nutr. 2003; 133:3778S-84S.
29. Kassie F, Melkamu T, Endalew A, Upadhyaya P, Luo X, Hecht SS. Inhibition of lung carcinogenesis and critical cancer-related signaling pathways by N-acetyl-S-(N-2-phenethylthiocarbamoyl)-l-cysteine, indole-3-carbinol and myo-inositol, alone and in combination. Carcinogenesis. 2010; 31:1634-41. https://doi.org/10.1093/carcin/bgq139.
30. Mori N, Wildes F, Takagi T, Glunde K, Bhujwalla ZM. The tumor microenvironment modulates choline and lipid metabolism. Front Oncol. 2016; 6:262. https://doi.org/10.3389/fonc.2016.00262.
31. Baxi SS, O'Neill C, Sherman EJ, Atoria CL, Lee NY, Pfister DG, Elkin EB. Trends in chemoradiation use in elderly patients with head and neck cancer: changing treatment patterns with cetuximab. Head Neck. 2016; 38:E165-71. https://doi.org/10.1002/hed.23961.
32. Pignon JP, le Maitre A, Maillard E, Bourhis J, MACH-NC Collaborative Group. Meta-analysis of chemotherapy in head and neck cancer (MACH-NC): an update on 93 randomised trials and 17,346 patients. Radiother Oncol. 2009; 92:4-14. https://doi.org/10.1016/j.radonc.2009.04.014.
33. VanderWalde NA, Meyer AM, Deal AM, Layton JB, Liu H, Carpenter WR, Weissler MC, Hayes DN, Fleming ME, Chera BS. Effectiveness of chemoradiation for head and neck cancer in an older patient population. Int J Radiat Oncol Biol Phys. 2014; 89:30-7. https://doi.org/10.1016/j.ijrobp.2014.01.053.
34. Wang HM, Wang CS, Chen JS, Chen IH, Liao CT, Chang TC. Cisplatin, tegafur, and leucovorin: a moderately effective and minimally toxic outpatient neoadjuvant chemotherapy for locally advanced squamous cell carcinoma of the head and neck. Cancer. 2002; 94:2989-95. https://doi.org/10.1002/cncr.10570.
35. Keating B, Ernst T. Real-time dynamic frequency and shim correction for single-voxel magnetic resonance spectroscopy. Magn Reson Med. 2012; 68:1339-45. https://doi.org/10.1002/mrm.24129.
36. Chan SC, Hsu CL, Yen TC, Ng SH, Liao CT, Wang HM. The role of 18F-FDG PET/CT metabolic tumour volume in predicting survival in patients with metastatic nasopharyngeal carcinoma. Oral Oncol. 2013; 49:71-8. https://doi.org/10.1016/j.oraloncology.2012.07.016.