
INTRODUCTION
Gastric cancer (GC) is the fourth most common cancer and the second leading cause of cancer death worldwide [1]. At present, the main treatments for GC include surgical resection, chemotherapy and radiotherapy [2]. However, these treatments have only modest efficacy for advanced or metastatic GC and they have a range of side effects, such as hair and hearing loss and kidney damage. Therefore, it is necessary to develop novel chemotherapies that are highly effective and less toxic.
Mitogen-activated protein kinase (MAPK) family, which mainly consists of extracellular-signal-regulated kinase (ERK), c-jun N-terminal kinase (JNK), and p38 are mediators of intracellular signals involved in the regulation of processes including cell growth and apoptosis [3-5]. ERK, JNK and p38 are all serine/threonine kinases that are directed by a proline residue. Along with the pathways in which these three MAP kinases are activated share similarity by extracellular or intracellular stimuli, such as reactive oxygen species (ROS) [6]. ROS such as oxygen ions, superoxide and hydrogen peroxide (H2O2) or hydroxyl radicals which mediate intracellular signaling cascades may trigger redox signaling pathways, such as oxidative stress, apoptosis, and cell cycle arrest [7, 8]. According to these recent studies, many chempreventive and chemotherapeutic agents can increase the generation of ROS and induced cancer cell apoptosis via mitochondrial-dependent signaling pathway. In addition, distribution of the mitochondrial transmembrane potential is considered to be one of the apoptotic processes induced by chemotherapeutic drugs.
Cryptotanshinone (CT) is a major active component of Salvia miltiorrhiza Bunge (Danshen) [9], which has been applied to treat cardiovascular diseases, Alzheimer’s disease and inflammation [10-12]. CT may have anticancer activity via the inhibition of proliferation of various tumor cells or via induction of apoptosis in MCF7 breast cancer cells, A2058, A375 and A875 melanoma cells, BxPC-3 pancreatic cancer cells and A549 lung cancer cells [13-16]. Thus, we seek to understand whether CT induces apoptosis and inhibits tumor growth in GC cells, thereby blocking GC tumors.
In the present study, we investigated antitumor activities effect of CT on GC cells and attempted to explain underlying mechanisms. Our results showed that CT inhibited growth of AGS, MKN-28, MKN-45 and 9 other GC cells. CT also suppressed tumors derived from MKN-45 cells inoculated in nude mice. The antitumor effect of CT may be attributed to accumulated ROS leading to p-JNK and p-p38 increasing and p-ERK, p-Akt and p-STAT3 decreasing, finally induced apoptosis and G2/M phase arrest. These data suggest that CT is worthy of further study for the treatment of GC.
RESULTS
CT inhibited proliferation and induced apoptosis of GC cells
Figure 1 showed that CT treatment dose-dependently decreased GC cell viability and the cytotoxic effects of CT was less than those of 5-FU in normal liver L-02 and QSG-7701 cells. IC50 values for CT and 5-FU for each cell line appear in Table 1. AGS, MKN-28 and MKN-45 cells were more sensitive to CT compared (Figure 1A and Table 1). Therefore, we used AGS, MKN-28, and MKN-45 cells. Figure 2A shows that compared with controls, treatment with CT for 24 h caused cell shrinkage and membrane blebbing. Annexin V-FITC and PI staining showed increased fluorescence with increased treatment time with CT in AGS cells. This was significantly different that fluorescence in 5-FU treated cells (Figure 2B). Flow cytometry (Figure 2C and 2D) showed increased apoptosis in a time-dependent manner. Finally, CT increased Bad and cleaved-caspase-3 expression but decreased pro-caspase-3 and Bcl-2 protein expression in a time dependent manner (Figure 2E and 2F). Thus, cytotoxic effects of CT on GC cells are attributable to mitochondrial-mediated apoptosis.
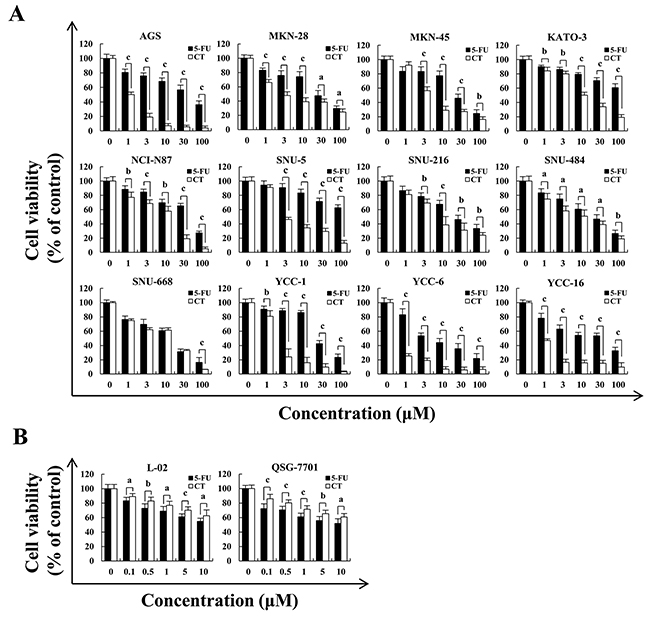
Figure 1: Cytotoxic effects of CT on multiple GC cell lines. (A) AGS, MKN-28, MKN-45, KATO-3, NCI-N87, SNU-5, SNU-216, SNU-484, SNU-668, YCC-1, YCC-6 and YCC-16 cells were treated with 1, 3, 10, 30 and 100 μM of 5-FU or CT for 24 h, then cell viability was measured by MTT assay. (B) Human liver L-02 and QSG-7701 cells were treated with 0.1, 0.5, 1, 5 and 10 μM of 5-FU or CT for 24 h, then cell viability was measured by MTT assay. Error bars indicate means ± SD of three independent experiments (ap<0.05, bp<0.01, cp<0.001 indicated significant differences).
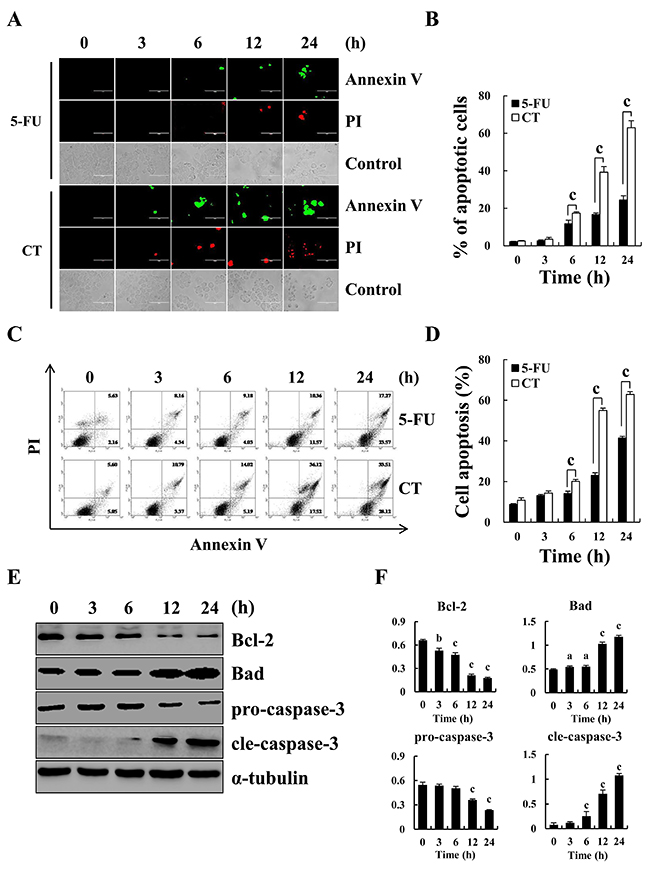
Figure 2: Apoptosis induced by CT in GC cells. (A) Induction of apoptosis in human gastric cancer AGS cells by Annexin V-FITC/PI double staining and observed under a fluorescence microscope after treatment with 10 μM CT for 3, 6, 12 and 24 h, respectively. Scale bar 100 μm. (B) Quantification of fluorescent intensity. (C) AGS cells treated with 10 μM CT for 3, 6, 12 and 24 h, respectively. Apoptotic cells were stained with Annexin V-FITC and PI, and measured using flow cytometry (D) Quantification of apoptotic cells in (C). (E) Apoptosis-related protein Bcl-2, Bad, pro-caspase-3 and cleaved-caspase-3 was measured using western blot, respectively. (F) Quantification of the band density was analyzed by ImageJ software (ap<0.05, bp<0.01, cp<0.001 indicated significant differences).
Table 1: IC50 value of 5-FU and CT in 12 GC cell lines
5-FU (μM) |
CT (μM) |
|
|---|---|---|
AGS |
31.86±0.04 |
0.95±0.05 |
MKN-28 |
28.05±0.05 |
2.11±0.03 |
MKN-45 |
27.48±0.04 |
4.63±0.04 |
KATO-3 |
>100 |
10.06±0.03 |
NCI-N87 |
57.63±0.04 |
11.53±0.03 |
SNU-5 |
>100 |
2.27±0.06 |
SNU-216 |
26.22±0.05 |
7.41±0.04 |
SNU-484 |
25.21±0.04 |
11.5±0.05 |
SNU-668 |
17.47±0.04 |
19.89±0.04 |
YCC-1 |
26.67±0.04 |
2.13±0.05 |
YCC-6 |
5.78±0.05 |
0.67±0.03 |
YCC-16 |
41.56±0.03 |
0.81±0.04 |
CT triggered cell cycle arrest at G2/M phase
To explore whether cell cycle arrest led to apoptosis, MKN-28 cells were stained with PI and the cell cycle was assayed. Figure 3A shows that after treatment with 10 μM CT at the indicated time points, G2/M phase arrest occurred in a time-dependent manner and that fewer cells had G0/G1 and S DNA content. Next, western blot results showed that CT treatment decreased expression levels of p27, CDK1/2, cyclinB1 and cyclin A, and increased expression level of p21 consistent with G2/M cell cycle arrest (Figure 3C and 3D).
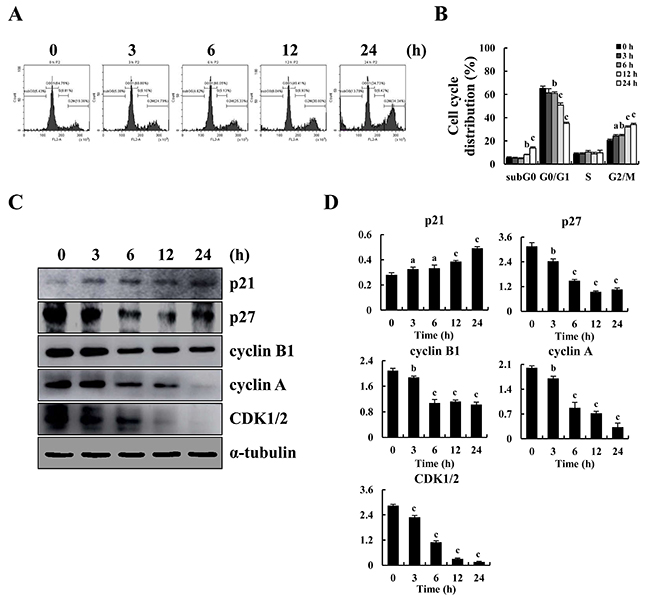
Figure 3: G2/M cycle arrest induced by CT and altered expression of cell cycle-regulatory protein in MKN-28 cells. (A) Cell cycle distribution of MKN-28 cells monitored by flow cytometer after treatment with 10 μM CT for 3, 6, 12 and 24 h, respectively. (B) Representative histograms from flow cytometry in human gastric cancer MKN-28 cells treated with CT. Assays performed in triplicate. (C) Expression of G2/M cell cycle proteins p21, p27, cyclin B1, cyclin A and CDK1/2 were assayed by western blot after treatment with 10 μM CT for 3, 6, 12 and 24 h, respectively. α-tubulin was used as internal control. (D) Western blot results from (C) was calculated and represented as percent of control (ap<0.05, bp<0.01, cp<0.001 indicated significant differences).
CT induced apoptosis and cell cycle arrest via MAPK and AKT signaling pathway
Western blot was used to confirm that expression of MAPK, AKT and STAT3 (Figure 4A-4E) significantly decreased, and p-JNK and p-p38 expression was increased in AGS cells. Thus, CT induced apoptosis and cell cycle arrest through MAPK and AKT signaling pathways.
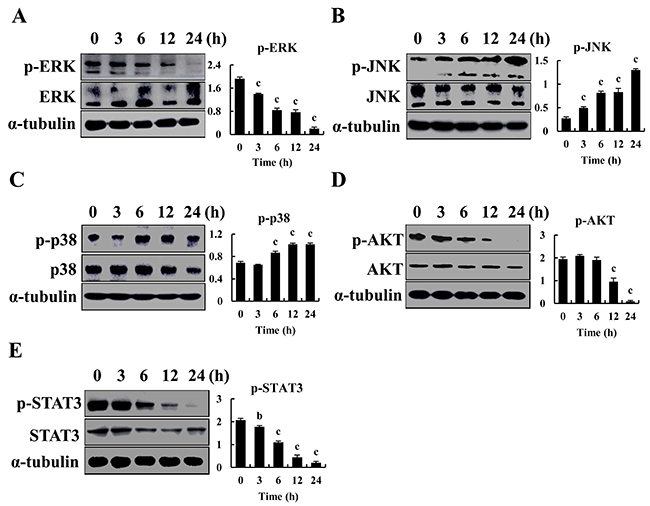
Figure 4: Regulates MAPK, AKT and STAT3 signaling pathways by CT in GC cells. (A-E) p-ERK, p-JNK, p-p38, p-AKT and p-STAT3 was measured by western blot after treatment with 10 μM CT for 3, 6, 12 and 24 h, respectively in AGS cells (ap<0.05, bp<0.01, cp<0.001 indicated significant differences).
CT induced ROS accumulation which participated in apoptosis of MKN-28 cells
Figures 5A and 5B show that CT significantly increased fluorescent intensity of MKN-28 cells in time-dependent manner, indicating that CT potentiated elevation of intracellular ROS. Also, pretreatment with NAC significantly inhibited CT-induced increased apoptosis (Figure 5C and 5D). NAC blocked CT-induced decreased expression of p-ERK, p-AKT and p-STAT3 and increased expression of p-JNK and p-p38 and cleaved-caspase-3 (Figure 5E and 5F). Therefore, CT-induced ROS generation is an early event that induces MAPK and Akt activation and triggers mitochondrial apoptotic pathways in MKN-28 cells.
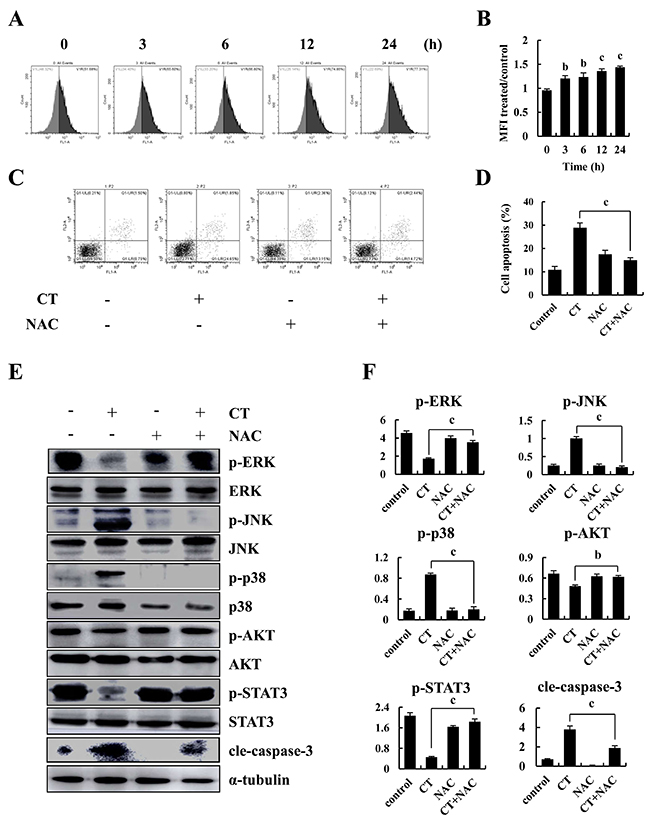
Figure 5: Intracellular ROS generation and apoptosis induced by CT in human gastric cancer cell. (A-B) Intracellular ROS generation induced by CT was measured in MKN-28 cells using DCFH-DA (10 μM) and flow cytometry. (C-D) Blocking ROS generation abolished CT-induced apoptosis. MKN-28 cells were pre-incubated with/without 5 mM of NAC for 30 min before exposure to CT (10 μM) for 24 h. Apoptosis was measured by flow cytometry. (E-F) MKN-28 cells were pretreated with/without 5 mM of NAC for 30 min before exposure to CT (10 μM) for 24 h. p-ERK, p-JNK, p-p38, p-AKT and p-STAT3 protein expression was measured by western blot (ap<0.05, bp<0.01, cp<0.001 indicated significant differences).
CT suppressed tumor growth in mouse xenograft models
Figure 6A and 6B show that tumors after CT treatment were smaller and fewer than in controls. On days 12–20 day, tumors were suppressed (Figure 6C). 5-FU inhibited tumor growth, but mouse weight decreased, in contrast to CT treatment which caused weight to increase (Figure 6D). During treatment (21 days), no mouse appeared to have toxic side effects and hematological assays confirmed no changes in experimental animals (See Table 2). No morphological changes were observed in organs of tumor-bearing mice treated with CT according to H&E staining (Figure 6E and 6F).
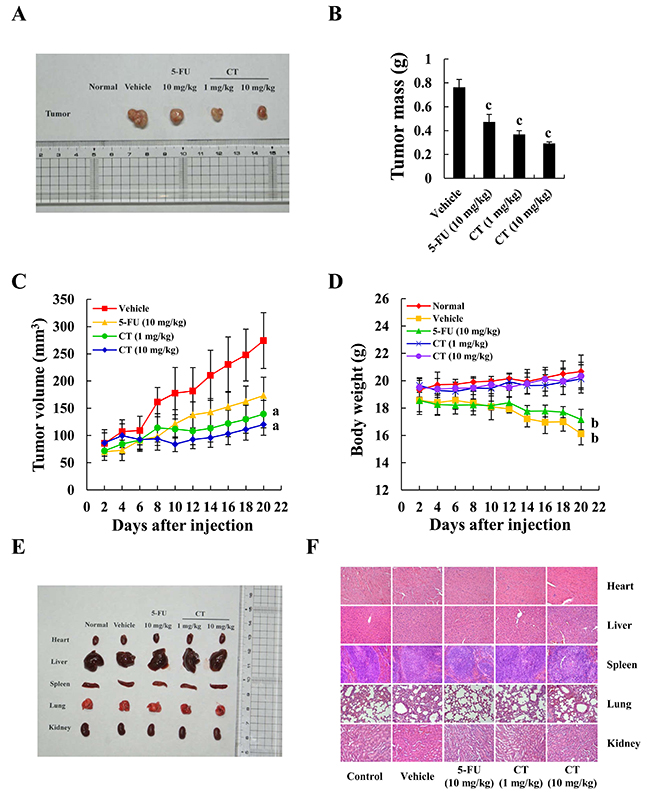
Figure 6: Inhibition of gastric cancer tumor xenograft growth by CT. MKN-45 cells in equal amount were inoculated subcutaneously into the flanks nude mice. (A) Tumors were removed and images were captured. (B) Tumor weight after injection. (C) Tumor size was recorded once every two days using Vernier caliper measurements and calculated as [(length×width2)/2]. (D) Animal weight was recorded once every two days. (E) Organ images after injection. (F) Structural changes according to H&E staining under a light microscope. Scale bar 100 μm (ap<0.05, bp<0.01, cp<0.001 indicated significant differences).
Table 2: Hematological parameters of nude mice bearing MKN-45 cell xenograft tumors
Hematological parameters |
Normal |
Vehicle |
5-FU 10 mg/kg |
CT |
Standard |
|
|---|---|---|---|---|---|---|
1 mg/kg |
10 mg/kg |
|||||
White blood cells (109/L) |
9.98±1.54 |
9.48±3.14 |
10.75±1.78 |
10.29±1.11 |
10.82±1.39 |
4.0-12.0 |
Lymphocytes percentage (%) |
65.01±17.02 |
50±17.74 |
69±10.6 |
73.65±7.2 |
70.85±13.55 |
54.0-85.0 |
Middle cells percentage (%) |
1.59±0.77 |
1.43±0.82 |
1.54±0.53 |
1.19±0.47 |
1.65±0.07 |
0.0-20.0 |
Granulocyte percentage (%) |
33.4±6.74 |
27.7±8.47 |
19.3±5.78 |
16.17±7.25 |
22.5±3.48 |
12.0-44.0 |
Lymphocytes (109/L) |
6.72±1.58 |
6.46±2.1 |
7.75±0.78 |
5.09±1.05 |
5.46±1.59 |
3.0-8.5 |
Middle cells (109/L) |
0.15±0.12 |
0.11±0.06 |
0.09±0.04 |
0.02±0.05 |
0.07±0.01 |
0.0-2.0 |
Granulocyte (109/L) |
2.12±1.58 |
3.33±1.65 |
2.86±1.58 |
4.19±1.31 |
2.27±2.23 |
0.7-5.0 |
Red blood cells (1012/L) |
10.46±0.13 |
10.6±0.08 |
10.38±0.20 |
9.89±1.21 |
9.06±1.04 |
7.0-12.5 |
Hemoglobin (g/L) |
152.57±14.16 |
161.25±3.77 |
159.45±5.26 |
170.15±2.99 |
149±15.25 |
100-190 |
Mean corpuscular volume (fL) |
57.57±0.53 |
56.25±0.5 |
56.55±0.52 |
56.38±0.65 |
55.5±0.71 |
51.0-65.0 |
Hematokrit (L/L) |
0.5±0.01 |
0.49±0.03 |
0.48±0.01 |
0.51±0.01 |
0.46±0.05 |
0.35-0.55 |
Mean corpuscular hemoglobin (Pg) |
18.1±5.57 |
19.8±1.27 |
20.01±0.36 |
18.93±1.74 |
18±1.41 |
12.0-30.0 |
Mean corpuscular hemoglobin concentration (g/L) |
314.86±6.89 |
285.75±3.86 |
295±6.93 |
270.62±13.18 |
301.5±10.51 |
230-330 |
Red blood cell distribution width_SD (fL) |
41.4±0.27 |
40.63±0.39 |
40.85±0.41 |
40.3±1.19 |
39.15±2.05 |
15.0-55.0 |
Red blood cell distribution width_CV (%) |
21.83±0.08 |
21.93±0.13 |
21.9±0.09 |
21.68±0.43 |
21.25±0.78 |
12.0-30.0 |
Blood platelet (109/L) |
186.29±34.43 |
144.25±29.96 |
218.91±21.02 |
214.38±47.93 |
200.5±54.45 |
100-300 |
Mean platelet volume (fL) |
6.67±0.7 |
6.95±0.49 |
7.25±0.33 |
7.1±0.81 |
7.2±0.57 |
6.1-12.0 |
Thrombocytocrit (L/L) |
0.12±0.04 |
0.1±0.03 |
0.16±0.02 |
0.15±0.04 |
0.14±0.03 |
0.10-0.60 |
Platelet distribution width (%) |
15.89±0.37 |
15.15±0.21 |
15.46±0.24 |
15.67±0.35 |
15.14±0.37 |
1.0-30.0 |
Note: Blood samples were taken after CT or 5-FU treatment for 20 days.
CT regulated the expression of MAPK, STAT3 and cleaved-caspase-3 in xenograft mice
CT induced apoptosis and inhibited tumor growth in GC cells. The immunohistochemistry staining result showed that expression levels of p-JNK, p-p38 and cleaved-caspase-3 were increased, whereas the expression levels of p-ERK and p-STAT3 were decreased in CT-treated xenograft tissues (Figure 7A). The western blot analyses of protein lysates from tumor tissue showed the similar results with IHC (Figure 7B). Taken together, these data demonstrate that CT has potent in vivo antitumor activity via MAPKs and STAT3 signaling pathway.
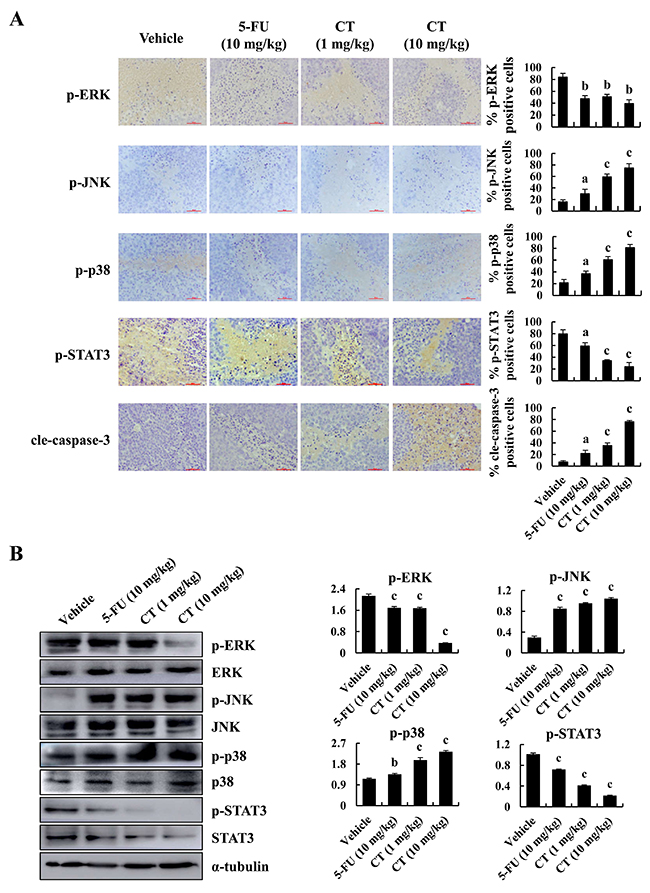
Figure 7: Immunohistochemical detection of key molecules in MAPK signaling pathways in xenograft tumor tissues. (A) p-ERK p-JNK, p-p38, p-STAT3 and cleaved-caspase-3 expression in tumor tissues was measured by immunohistochemistry under a light microscope. Scale bar 50 μm (ap<0.05, bp<0.01, cp<0.001 indicated significant differences). (B) p-ERK p-JNK, p-p38 and p-STAT3 expression in tumor tissues was measured by western blot (ap<0.05, bp<0.01, cp<0.001 indicated significant differences).
DISCUSSION
Cryptotanshinone, tanshinones I, IIA, IIB and dihydrotanshinone are the most abundant constituents of the root of S. miltiorrhiza. Most studies have focused on the antioxidant and anti-inflammatory effect of tanshinones I and IIA, which may have anti-cancer effects [17, 18]. Recently, studies reported that CT could inhibit HL-60 human leukemic cell viability [19] and we report here that CT significantly inhibited the viability of AGS and other 11 GC cell lines (Figure 1). AGS, MKN-28 and MKN-45 cells were more sensitive than other gastric cancer cell lines. To identify how this occurs, we studied cell cycle distribution, cell cycle checkpoint protein expression, MAPK pathways, and the induction of apoptosis after treatment with CT on AGS, MKN-28 and MKN-45, respectively.
Apoptosis occurs chiefly through the extrinsic pathway (death receptor pathway) and the intrinsic pathway (mitochondrial pathway) [20]. In the extrinsic pathway, caspase-8 is activated, whereas caspase-9 is involved in the intrinsic pathway [21-23]. Changes in expression of pro-apoptotic protein (Bad) versus anti-apoptotic proteins (Bcl-2) activate the intrinsic apoptotic pathway [24]. It has been reported that CT can increase the expression levels of cleaved-caspase-3 and pro-apoptotic protein Bax while decrease Bcl-2 via the ROS-mitochondrial apoptotic pathway, and arrest the cell cycle at the G2/M phase in A375 melanoma cells [15]. Our data indicated that CT increased apoptosis in a time-dependent manner. On the molecular level, CT administration promoted cleaved-caspase-3 and expression of Bad and pro-caspase-3 and Bcl-2 were significantly decreased in a time-dependent manner after treatment with CT. Thus, CT may inhibit GC cell growth by inducing mitochondrial-mediated apoptosis.
Another main regulatory mechanism to control cell growth and induced cell apoptosis is through cell cycle control and several cytotoxic agents that arrest the cell cycle are currently used as antitumor drugs [25, 26]. In eukaryotes, the cell cycle is regulated by cyclins and cyclin-dependent kinases (CDKs) reduced activity of CDK1/2 and cyclinB1 is the hallmark of cell cycle arrest at the G2/M phase [27, 28]. Additionally, Akt kinase and signal transducer and activator of transcription (STAT3) contribute to cell survival, proliferation and cell cycle regulation [29, 30]. It has been reported that apoptosis is protected by Akt activity during the G2/M transition and it is necessary for effective entry to mitosis during unperturbed cell cycles [31]. STAT3 induces G2/M cycle arrest via regulating its downstream targets including p27, p21, cyclin B1 and so on [32-34]. Our results showed that CT reduced activation of Akt and STAT3 (Figure 3C and 3D & Figure 4D and 4E). Consequently, a significant accumulation occurred at the G2/M phase in MKN-28 cells after CT treatment, and this was associated with a significant decrease in cells at the G2/M phase.
Low ROS is important for cellular function and survival signaling and excessive ROS-elicited oxidative stress leads to cell death via apoptosis. Accumulated evidence indicates that chemotherapeutic agents can induce apoptosis via ROS production in various cancer cells [35]. Numerous anti-cancer drugs such as capsaicin, Khz-cp and apigenin could increase ROS production and induce cancer cells apoptosis by activating NADPH oxidase ROS catalytic subunit [36-38]. It has been reported that Nrf2 (Nrythroid-derived 2) activity could affect the function of two different sources of mitochondrial ROS production and production of ROS via NADPH oxidase [39]. Whether CT-induced gastric cancer cells apoptosis which caused by NADPH oxidase increasing the generation of ROS or the ROS production by mitochondria need to further study. Our result showed that CT-induced apoptosis was accompanied by ROS accumulation (Figure 5A and 5B), but that NAC reversed CT-induced apoptosis, indicating that apoptosis induced by CT was ROS-independent (Figure 5C and 5D).
The MAPK family has crucial roles in maintenance of cell survival and induction of apoptosis. In most cancer cells, ERK activated by growth factors is associated with cell proliferation. In contrast, JNK and p38 mediate cellular responses to stress and involved in proliferation, differentiation or apoptosis depending on the cell type and the stimuli. It has been reported that CT can activate p38/JNK and inhibit ERK1/2 via generation of ROS, leading to caspase-independent cell death in Rh30, DU145, and MCF-7 cells [40]. We report that CT induced phosphorylation of p38, JNK, and decreased phosphorylation of ERK in AGS cells in a time-dependent manner. NAC could also rescue MAPK activation. Thus, CT induces ROS-mediated MAPK activation and leads to apoptosis in GC cells.
In the previous study, we established AGS, MKN-28 and MKN-45 gastric cancer model of nude mice. But the tumor formation rate of the AGS and MKN-28 cells was lower than MKN-45 cells. Therefore, we choose MKN-45 cell to make a xenograft model. Our nude mice model bearing MKN-45 tumors showed that CT suppressed tumor growth significantly (Figure 6A-6C). Compared with controls, CT did not influence body weight (Figure 6D) and there was no hematological (Table 2) or organ toxicity (Figure 6E and 6F). Therefore CT had notable antitumor activity and was safe for this mouse model.
In summary, the molecular mechanism underlying the action of CT-induced inhibitory activity in human gastric cancer cells (Figure 8) may include ROS generation and subsequently inhibit activation of MAPK and AKT signaling pathways, which increase cell cycle arrest and caspase-dependent apoptosis. All of these ultimately lead to the inhibition of tumor growth. These data strongly suggest the value of further study on the application of CT as a potential treatment for GC.
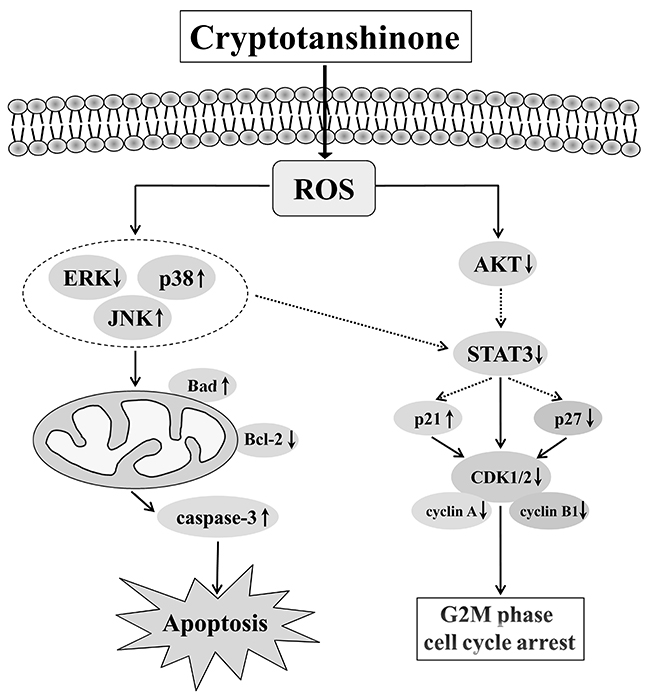
Figure 8: Schematic presentation of the signaling pathways in GC cells affected by CT. A proposed mechanism of CT anticancer activity as related to the signal pathways and evidenced by our study.
MATERIALS AND METHODS
Chemicals and reagents
CT (Sigma-Aldrich; St. Louis, MO, U.S.) and 5-FU (MedChem Express; Princeton, NJ) was dissolved (20 mM in 100% DMSO; Sigma-Aldrich, St. Louis, MO, U.S.) as a stock solution, and stored at −20°C. This was diluted with cell culture media before use. The final DMSO concentration did not exceed 0.1% throughout the study. All other chemicals were of analytical grade.
Cell line and cell culture
Human gastric cancer cells and normal liver cells were purchased from American Type Culture Collection (ATCC; Rockville, MD). AGS, MKN-28, MKN-45, KATO-3, SNU-5, SNU-216, SNU-484, SNU-668, L-02 and QSG-7701 cells were cultured in RPMI 1640 medium. NCI-N87, YCC-1, YCC-6 and YCC-16 cells were cultured in DMEM medium. Medium contained 10% heat-inactivated fetal bovine serum (FBS, Gibco; Auckland, NZ), 100 U/mL penicillin and 100 μg/mL streptomycin. Cells were maintained at 37°C in a humidified atmosphere with 5% CO2.
Cell viability assay
The effects of CT on GC cell viability were measured using an MTT assay. Cells (1×10⁴) were seeded in 96-well culture plates, and treated various concentrations (1, 3, 10, 30 and 100 μM) of CT or 5-FU for 24 h. And then, 15 μL of MTT solution (5 mg/mL) was added to each well and incubated at 37°C for 2 h, each well was then removed, and 100 μL DMSO was added to each well to dissolve formazan crystals. Absorption intensity was analyzed using an automatic microplate reader (BioTek Instruments Inc., Winooski, VT) at 490 nm, and results were used to calculate cell viability.
Cell apoptosis analysis
Annexin V-FITC and propidium iodide (PI) double stain and flow cytometry were used to assay apoptosis. AGS cells were collected after treatment with 10 μM CT at different time points (3, 6, 12 and 24 h). AGS cells were washed with PBS twice and fixed with 195 μL Annexin V binding buffer, followed by the addition of 3 μL Annexin V and 2 μL PI (Annexin V-FITC Apoptosis Detection Kits; Beyotime Institute Biotechnology, Shanghai, China). After incubation for 10 min in the dark, PBS was added to bring the total volume to 500 μL. Then, an EVOS FL Auto Cell Imaging System (Thermo Fisher Scientific, Inc., Waltham, MA) and flow cytometer (Beckman Coulter, Inc., Brea, CA, USA) were used to quantify apoptosis.
Cell cycle analysis
MKN-28 cells were treated with 10 μM CT at different time points (3, 6, 12 and 24 h). Cells were fixed in 70% cold ethanol at 4°C overnight, then washed with cold PBS and incubated with RNase (10 μg/ml) and PI (10 μg/ml) (Cell Cycle Detection Kits; Beyotime Institute Biotechnology, Shanghai, China) at 37°C for 30 min in the dark. Samples were analyzed with a flow cytometer.
Measurement of ROS generation
MKN-28 cells were treated with 10 μM CT for different time points (3, 6, 12 and 24 h). Then, cells were collected and suspended in 10 μM DCFH-DA (Merck, Shanghai, China) at 37°C for 30 min. After incubating, cells were washed twice with PBS and resuspended in PBS for ROS accumulation measurement using flow cytometry.
Western blotting analysis
After treatment with 10 μM CT for 3, 6, 12 and 24 h, AGS cell protein was extracted with cell lysis buffer for 30 min and centrifuged at 12,000 rpm for 30 min at 4°C. Equivalent protein (30 μg) were separated on 8–12% SDS-PAGE and transferred onto a nitrocellulose membrane which was incubated in blocking solution (TBS with 0.05% Tween 20 and 0.5% nonfat milk) for 1 h at room temperature and reacted with primary antibodies (all from Santa Cruz Biotechnology, Inc., Dallas, TX, USA) against mouse monoclonal α-tubulin (1:2,500; cat. no. sc-8035), Bad (1:1,500; cat. no. sc-8044), Bcl-2 (1:1,500; cat. no. sc-7382), caspase-3 (1:1,500; cat. no. sc-373730), p-ERK (1:1,500; cat. no. sc-7383), p-JNK (1:1,500; cat. no. sc-6254), JNK (1:1,500; cat. no. sc-7345), p-p38 (1:1,500; cat. no. sc-7973), p-STAT3 (1:1,500; cat. no. sc-8059), STAT3 (1:1,500; cat. no. sc-8091), p21 (1:2,500; cat. no. sc-397), p27 (1:2,500; cat. no. sc-258), cyclin A (1:2,500; cat. no. sc-751), cyclin B1 (1:2,500; cat. no. sc-245) and CDK1/2 (1:2,500; cat. no. sc-53219). Rabbit polyclonal ERK2 (1:1,500; cat. no. sc-154), p38α/β (1:1,500; cat. no. sc-7194), Akt1/2/3 (1:1,500; cat. no. sc-8312), p-Akt1/2/3 (1:2,500; cat. no. sc-7985-R) overnight at 4°C. Membranes were then incubated with appropriate horseradish peroxidase-conjugated secondary antibodies. Goat anti-mouse IgG (1:5,000; cat. no. ZB-2305) and goat anti-rabbit IgG (1:5,000; cat. no. ZB-2301) were used as secondary antibodies for 2 h, washed with TBST and visualized by using Pierce ECL Western Blotting Substrate (Thermo Fisher Scientific, Inc., Waltham, MA) on AI600 (GE, Fairfield, CT). Proteins were semi-quantified using Image J software.
Tumor xenograft study
Male 5–6-week-old BALB/c nude mice (18–20 g) purchased from Beijing Vital River Laboratory Animal Technology Company were kept on a 12:12 h light-dark cycle with access to food and water and raised in independent ventilation Cage (IVC). MKN-45 cells (2×10⁶ cells/50 μL) were subcutaneously injected into the flanks of the nude mice at 6–7 weeks-of-age. Once the tumor volume reached 100 mm3, mice were randomized into four groups and given: (1) vehicle (DMSO, i.p., once every two days), (2) 5-FU (10 mg/kg, i.p., once every two days), (3) CT (1 mg/kg, i.p., once every two days), (4) CT (10 mg/kg, i.p., once every two days). After 20 days, mice were sacrificed and xenografts were dissected and immediately snap frozen in liquid nitrogen and stored at −80°C until processing. Tumor growth was monitored every two days, and tumor volume (mm3) was defined as (l×w2)/2, where l is the length and w is the width (mm) of the tumor.
Hematological assay
On day 20, blood was drawn by puncturing the retro-orbital area of the nude mice in all groups and analyzed using an automatic animal hematology analyzer (Nanjing Perlong Medical, Inc., Beijing, China).
H&E staining and immunohistochemistry
Organs and tumor tissues from mice were fixed with 10% neutral buffered formalin for 24 h, and then embedded in paraffin, sectioned at a thickness of 5 μm. Slides were stained with hematoxylin and eosin (H&E) followed by dehydration in graded alcohol.
Tumors slides were deparaffinized and rehydrated and antigen was retrieved. After blocking nonspecific protein with BSA, slides were incubated with primary antibodies include p-ERK (1:500), p-JNK (1:500), p-p38 (1:500), p-STAT3 (1:500), and cleaved-caspase-3 (1:500) for 40 min. Horseradish-peroxidase-labeled anti-mouse or rabbit IgG was subjected to DAB staining (Dako North American, Inc., Carpentaria, CA, U.S.) and incubated at room temperature for 30 min. Tissue sections were counterstained with H&E for 40 s. After drying, slides were observed under a light microscope. The relative quantities of p-ERK, p-JNK, p-p38, p-STAT3 and cleaved-caspase-3-positive cells were quantified by counting brown-stained cells within total number of cells in three arbitrarily selected fields.
Statistical analysis
Statistical analyses were performed according to the Statistical Package for Social Science (SPSS) 19.0. Data are expressed as means ± standard deviation (SD) and analyzed using a one-way ANOVA (p<0.05 was considered statistically significantly different).
Abbreviations
CT, cryptotanshinone; GC, gastric cancer; ROS, reactive oxygen species; NAC, N-acetyl-L-cysteine; JNK, c-Jun N-terminal kinase; ERK, extracellular regulated protein kinases; STAT3, signal transducer and activator of transcription 3; MAPK, mitogen-activated protein kinase; H2O2, hydrogen peroxide; DMSO, dimethyl sulfoxide; MTT, 3-(4,5-dimethyl-2-thiazolyl)-2,5-diphenyl-2-H-tetrazolium bromide; PI, propidium iodide; Bcl-2, B-cell lymphoma-2; CDKs, cyclin-dependent kinases.
Author contributions
Cheng-Hao Jin and Yu-Dong Cui conceived and designed the experiments. Chang Liu, Hu-Nan Sun, Ying-Hua Luo and Xian-Ji Piao wrote the paper and participated the experiment. Dan-Dan Wu and Ling-Qi Meng assessed the cytotoxic effects. Yue Wang, Yi Zhang and Jia-Ru Wang performed the apoptotic analysis. Hao Wang, Wan-Ting Xu, Jin-Qian Li and Yang Liu performed cell cycle analysis. Yi-Qin Wu, Ying-Hao Han, Gui-Nan Shen and Yan-Qing Zang participated in animal studies. Mei-Hua Jin, Jing-Chun Li and Nan-Zhu Fang analyzed the data. All authors read and approved the final version of the manuscript.
ACKNOWLEDGMENTS
We would like to thank our partners, field workers and participants in China.
CONFLICTS OF INTEREST
The authors declare that there are no conflicts of interest.
FUNDING
This work was funded by the Nature Science Foundation of Heilongjiang Province of China (LC2015036), the Program of Cultivation and Support Projects of Heilongjiang Bayi Agricultural University (XA2015-04), the Research Project of Heilongjiang Bayi Agricultural University (XYB2013-24 and the Scientific Research Innovation Program for College Graduates of Heilongjiang Bayi Agricultural University (YJSCX2017-Y72).
REFERENCES
1. Torre LA, Bray F, Siegel RL, Ferlay J, Lortet-Tieulent J, Jemal A. Global cancer statistic. CA Cancer J Clin. 2012. 2015; 65:87–108. https://doi.org/10.3322/caac.21262.
2. Song H, Zhu J, Lu D. Molecular-targeted first-line therapy for advanced gastric cancer. Cochrane Database Syst Rev. 2016; 7:CD011461. https://doi.org/10.1002/14651858.
3. Deschênes-Simard X, Kottakis F, Meloche S, Ferbeyre G. ERKs in cancer: friends or foes? Cancer Res. 2014; 74:412–9. https://doi.org/10.1158/0008-5472.
4. Haagenson KK, Wu GS. Mitogen activated protein kinase phosphatases and cancer. Cancer Biol Ther. 2010; 9:337–340.
5. Yang SH, Sharrocks AD, Whitmarsh AJ. MAP kinase signalling cascades and transcriptional regulation. Gene. 2013; 513:1–13. https://doi.org/10.1016/j.gene.2012.10.033.
6. Zhang J, Wang X, Vikash V, Ye Q, Wu D, Liu Y, Dong W. ROS and ROS-mediated cellular signaling. Oxid Med Cell Longev. 2016; 2016:4350965. https://doi.org/10.1155/2016/4350965.
7. Gupta SC, Hevia D, Patchva S, Park B, Koh W, Aggarwal BB. Upsides and downsides of reactive oxygen species for cancer: the roles of reactive oxygen species in tumorigenesis, prevention, and therapy. Antioxid Redox Signal. 2012; 16:1295–322. https://doi.org/10.1089/ars.2011.4414.
8. Sullivan LB, Chandel NS. Mitochondrial reactive oxygen species and cancer. Cancer Metab. 2014; 2:1–12. https://doi.org/10.1186/2049-3002-2-17.
9. Wang JW, Wu JY. Tanshinone biosynthesis in salvia miltiorrhiza and production in plant tissue cultures. Appl Microbiol Biotechnol. 2010; 88:437–49. https://doi.org/10.1007/s00253-010-2797-7.
10. Ahmad Z, Ng CT, Fong LY, Bakar NA, Hussain NH, Ang KP, Ee GC, Hakim MN. Cryptotanshinone inhibits TNF-α-induced early atherogenic events in vitro. J Physiol Sci. 2016; 66:213–20. https://doi.org/10.1007/s12576-015-0410-7.
11. Oche B, Chen L, Ma YK, Yang Y, Li CX, Geng X, Qiu LZ, Gao XM, Wang H. Cryptotanshinone and wogonin up-regulate eNOS in vascular endothelial cells via erα and down-regulate iNOS in LPS stimulated vascular smooth muscle cells via ERβ. Arch Pharm Res. 2016; 39:249–58. https://doi.org/10.1007/s12272-015-0671-y.
12. Mei Z, Yan P, Situ B, Mou Y, Liu P. Cryptotanshinione inhibits β-amyloid aggregation and protects damage from β-amyloid in SH-SY5Y cells. Neurochem Res. 2012; 37:622–8. https://doi.org/10.1007/s11064-011-0652-6.
13. Ge Y, Yang B, Chen Z, Cheng R. Cryptotanshinone suppresses the proliferation and induces the apoptosis of pancreatic cancer cells via the STAT3 signaling pathway. Mol Med Rep. 2015; 12:7782–8. https://doi.org/10.3892/mmr.2015.4379.
14. Hao W, Zhang X, Zhao W, Zhu H, Liu ZY, Lu J, Chen X. Cryptotanshinone induces pro-death autophagy through JNK signaling mediated by reactive oxygen species generation in lung cancer cells. Anticancer Agents Med Chem. 2016; 16:593–600.
15. Ye T, Zhu S, Zhu Y, Feng Q, He B, Xiong Y, Zhao L, Zhang Y, Yu L, Yang L. Cryptotanshinone induces melanoma cancer cells apoptosis via ROS-mitochondrial apoptotic pathway and impairs cell migration and invasion. Biomed Pharmacother. 2016; 82:319–26. https://doi.org/10.1016/j.biopha.2016.05.015.
16. Zhou J, Xu XZ, Hu YR, Hu AR, Zhu CL, Gao GS. Cryptotanshinone induces inhibition of breast tumor growth by cytotoxic CD4+ T cells through the JAK2/STAT4/ perforin pathway. Asian Pac J Cancer Prev. 2014; 15:2439–45.
17. Ma ZL, Zhang BJ, Wang DT, Li X, Wei JL, Zhao BT, Jin Y, Li YL, Jin YX. Tanshinones suppress AURKA through up-regulation of miR-32 expression in non-small cell lung cancer. Oncotarget. 2015; 6:20111–20. https://doi.org/10.18632/oncotarget.3933.
18. Tao S, Zheng Y, Lau A, Jaramillo MC, Chau BT, Lantz RC, Wong PK, Wondrak GT, Zhang DD. Tanshinone I activates the Nrf2-dependent antioxidant response and protects against As(III)-induced lung inflammation in vitro and in vivo. Antioxid Redox Signal. 2013; 19:1647–61. https://doi.org/10.1089/ars.2012.5117.
19. Ni W, Qian W, Tong X. Cryptotanshinone induces apoptosis of HL-60 cells via mitochondrial pathway. 2014; 13:545–51. https://doi.org/10.4314/tjpr.v13i4.9.
20. Li Y, Xu Y, Lei B, Wang W, Ge X, Li J. Rhein induces apoptosis of human gastric cancer SGC-7901 cells via an intrinsic mitochondrial pathway. Braz J Med Biol Res. 2012; 45:1052–9.
21. Shimizu Y, Miyakura R, Otsuka Y. Nuclear receptor subfamily 4, group A, member 1 inhibits extrinsic apoptosis and reduces caspase-8 activity in H2O2-induced human HUC-F2 fibroblasts. Redox Rep. 2014; 20:81–8. https://doi.org/10.1179/1351000214Y.034986R10109.
22. Yan F, Liu Y, Wang W. Matrine inhibited the growth of rat osteosarcoma UMR-108 cells by inducing apoptosis in a mitochondrial-caspase-dependent pathway. Tumor Biol. 2013; 34:2135–40. https://doi.org/10.1007/s13277-013-0744-9.
23. Yang TM, Qi SN, Zhao N, Yang YJ, Yuan HQ, Zhang B, Jin S. Induction of apoptosis through caspase-independent or caspase-9-dependent pathway in mouse and human osteosarcoma cells by a new nitroxyl spin-labeled derivative of podophyllotoxin. Apoptosis. 2013; 18:727–38. https://doi.org/10.1007/s10495-013-0819-5.
24. Alabsi AM, Lim KL, Paterson IC, Ali-Saeed R, Muharram BA. Cell cycle arrest and apoptosis induction via modulation of mitochondrial integrity by Bcl-2 family members and caspase dependence in dracaena cinnabari-treated H400 human oral squamous cell carcinoma. Biomed Res Int. 2016; 2016:4904016. https://doi.org/10.1155/2016/4904016.
25. He D, Guo X, Zhang E, Zi F, Chen J, Chen Q, Lin X, Yang L, Li Y, Wu W, Yang Y, He J, Cai Z. Quercetin induces cell apoptosis of myeloma and displays a synergistic effect with dexamethasone in vitro and in vivo xenograft models. Oncotarget. 2016; 7:45489–99. https://doi.org/10.18632/oncotarget.9993.
26. Wu X, Wang Y, Wang H, Wang Q, Wang L, Miao J, Cui F, Wang J. Quinacrine inhibits cell growth and induces apoptosis in human gastric cancer cell line SGC-7901. Curr Ther Res Clin Exp. 2012; 73:52–64. https://doi.org/10.1016/j.curtheres.2012.02.003.
27. Murray AW. Recycling the cell cycle: cyclins revisited. Cell. 2004; 116:221–34.
28. Stark GR, Taylor WR. Analyzing the G2/M checkpoint [M]//SCH NTHAL A H. checkpoint controls and cancer: volume 1: reviews and model systems. Totowa, NJ; Humana Press. 2004:51–82.
29. Subramaniam A, Shanmugam MK, Perumal E, Li F, Nachiyappan A, Dai X, Swamy SN, Ahn KS, Kumar AP, Tan BK, Hui KM, Sethi G. Potential role of signal transducer and activator of transcription (STAT)3 signaling pathway in inflammation, survival, proliferation and invasion of hepatocellular carcinoma. Biochim Biophys Acta. 2013; 1835:46–60. https://doi.org/10.1016/j.bbcan.2012.10.002.
30. Lohberger B, Leithner A, Stuendl N, Kaltenegger H, Kullich W, Steinecker-Frohnwieser B. Diacerein retards cell growth of chondrosarcoma cells at the G2/M cell cycle checkpoint via cyclin B1/CDK1 and CDK2 downregulation. BMC Cancer. 2015; 15:1–11. https://doi.org/10.1186/s12885-015-1915-4.
31. Xu N, Lao Y, Zhang Y, Gillespie DA. Akt: a double-edged sword in cell proliferation and genome stability. J Oncol. 2012; 2012:951724. https://doi.org/10.1155/2012/951724.
32. Liang J, Slingerland JM. Multiple roles of the PI3K/PKB (Akt) pathway in cell cycle progression. Cell cycle. 2003; 2:339–45.
33. Xiong H, Chen ZF, Liang QC, Du W, Chen HM, Su WY, Chen GQ, Han ZG, Fang JY. Inhibition of DNA methyltransferase induces G2 cell cycle arrest and apoptosis in human colorectal cancer cells via inhibition of JAK2/STAT3/STAT5 signalling. J Cell Mol Med. 2009; 13:3668–79. https://doi.org/10.1111/j.1582-4934.20 09.00661.x.
34. Su Y, Li G, Zhang X, Gu J, Zhang C, Tian Z, Zhang J. JSI-124 inhibits glioblastoma multiforme cell proliferation through G(2)/M cell cycle arrest and apoptosis augment. Cancer Biol Ther. 2008; 7:1243–9.
35. Lo YL, Wang W. Formononetin potentiates epirubicin-induced apoptosis via ROS production in HeLa cells in vitro. Chem Biol Interact. 2013; 205:188–97. https://doi.org/10.1016/j.cbi.2013.07.003.
36. Wang HM, Chuang SM, Su YC, Li YH, Chueh PJ. Down-regulation of tumor-associated NADH oxidase, tNOX (ENOX2), enhances capsaicin-induced inhibition of gastric cancer cell growth. Cell Biochem Biophys. 2011; 61:355–66. https://doi.org/10.1007/s12013-011-9218-0.
37. Kim TH, Kim JS, Kim ZH, Huang RB, Chae YL, Wang RS. Khz-cp (crude polysaccharide extract obtained from the fusion of Ganoderma lucidum and Polyporus umbellatus mycelia) induces apoptosis by increasing intracellular calcium levels and activating P38 and NADPH oxidase-dependent generation of reactive oxygen species in SNU-1 cells. BMC Complement Altern Med. 2014; 14:236. https://doi.org/10.1186/1472-6882-14-236.
38. Choi SI, Jeong CS, Cho SY, Lee YS. Mechanism of apoptosis induced by apigenin in HepG2 human hepatoma cells: involvement of reactive oxygen species generated by NADPH oxidase. Arch Pharm Res. 2007; 30:1328–35.
39. Kovac S, Angelova PR, Holmström KM, Zhang Y, Dinkova-Kostova AT, Abramov AY. Nrf2 regulates ROS production by mitochondria and NADPH oxidase. Biochim Biophys Acta. 2015; 1850:794–801. https://doi.org/10.1016/j.bbagen.2014.11.021.
40. Chen W, Liu L, Luo Y, Odaka Y, Awate S, Zhou H, Shen T, Zheng S, Lu Y, Huang S. Cryptotanshinone activates p38/JNK and inhibits Erk1/2 leading to caspase-independent cell death in tumor cells. Cancer Prev Res (Phila). 2012; 5:778–87. https://doi.org/10.1158/1940-6207.