
INTRODUCTION
Dairy product is a vital source of nutrition; ruminant milk contains special active proteins, lipids, immunoglobulins, cytokines, antimicrobial peptides, hormones, and growth factors [1, 2]. Compared to bovine milk, goat milk is more digestible, and more easily triggers the body’s innate and adaptive immune systems [3, 4, 5]. However, breeding and milk production of dairy goats are carried out at a lower scale compared to those of the dairy cow. Therefore, dairy goat milk production needs to be more closely monitored in terms of performance and quality.
Several considerable studies have revealed that DNA methylation (DNAm) plays critical roles in mammary gland development and lactation function. Genome-wide methylation patterns in human mammary epithelial cells demonstrate that DNAm participates in the control of human mammary epithelial cell polarity and cellular differentiation [6]. DNAm studies on lactation are gaining increasing attention, suggesting that epigenetics plays an important role in mammary gland development and function [7-9]. However, the specific methylation patterns and genes related to goat mammary gland development and function were rarely reported.
DNAm, the most common epigenetic modification, is involved in diverse processes [10, 11]. CpG islands, which normally remain unmethylated [12], are the most prominent features of DNAm patterns in livestock. The methylation levels CpG islands are generally hypomethylated, and a small number of methylation sites are randomly distributed. The CpG islands of highly expressed genes, such as housekeeping and tissue-specific genes, maintain a low methylation status. DNAm in mammals, mainly targeted in the CG sequence context, mediates gene expression. To date, non-CpG (e.g. CpA, CpT, and CpC) methylations are functional and commonly occur in plant cells; however, there have been few studies in this regard in animal cells. Recently, mammalian cells have been verified to contain non-CpG methylation (CpGm) patterns [13]. A comprehensive analysis of non-CpG methylation across human pluripotent and differentiated cells detected a strong correlation between non-CpG methylation and DNMT3 (DNA (cytosine-5)-methyltransferase 3) expression levels, suggesting that non-CpG methylation may be linked to CpG methylation [14]. Despite the different mechanisms of CG methylation (CGm) and non-CGm, the DNAm of gene promoters is involved in influencing gene expression [15]. There are few studies on DNAm patterns in goats compared to those in humans, cattle, pigs, and sheep [16-20]. Reduced representation bisulfite sequencing (RRBS) is an economical, accurate, and efficient method to obtain DNAm profiles. This method enriches the promoter and CpG island regions by restriction endonuclease digestion [21]. The CpG-rich restriction fragments, after the bisulfite conversion of unmethylated cytosine, are then sequenced. High-resolution detection of the DNAm status and high-efficiency utilization of the sequencing data are achieved [22].
The RRBS method was first proposed in 2005 [22], and was adopted by numerous researchers. Due to the high single-base resolution and acceptable cost, RRBS has become a widely used method for detecting DNAm. In 2008, analyses of genome-scale DNAm profiles in mouse embryonic stem cells, embryonic stem cell-derived neural stem cells, primary neural cells, and eight other primary tissues were generated using RRBS [23], further verifying that RRBS is an effective technology for the analysis of epigenetic profiles.
Herein, we compared the methylation profiles of the lactation and dry periods of goat mammary glands using the RRBS method. We analyzed the differential methylated genes between the two periods to determine some of the important genes associated with lactation or mammary gland development, with the aim of providing essential information regarding the epigenetic regulation of mammary glands in dairy goats.
RESULTS
Data filtering and reads alignment
High quality and clean reads were mapped to goat reference genome (NCBI) by BSMAP (version: 2.90) software. Before alignment to the reference genome, the raw reads were filtered, which included trimming the adapter sequences, adapter contamination, and low-quality reads. The average clean reads, which were 23.01 M in the dry period samples and 20.83 M in the lactation period samples, were then used for subsequent analysis (Table 1). The clean reads were mapped to the goat reference genome. Every hit of a single placement with a minimum numbers of mismatches and a clear strand assignment was defined as an unambiguous alignment (uniquely mapped read). Uniquely mapped reads with restriction enzyme cutting sites were used for further analysis. The rate of the clean reads mapped to the reference genome in the four samples was approximately 64%, and the rate of enzyme cutting site uniqueness was greater than 89% (Table 1). We listed the numbers of reads that each cytosine type (CG, CHG and CHH, H represents non-C base) were covered by (Supplementary Table 1). We obtained a large amount of sites for all cytosine types (CG, CHG and CHH) in 3′ UTR, 5′ UTR, CDS, intron, and the 2-kb downstream and 2-kb upstream regions. This result suggests that there was a considerable number of non-CG sequence contexts located in the genomic regions. Furthermore, there were similar CG, CHG, and CHH coverage rates of approximately 47%–60% in each genomic region, suggesting that non-mCG sequence contexts might exist in mammals.
Table 1: Data production and reads alignment
Sample |
Insert size |
Read length |
Clean reads |
Clean base |
Mapped reads |
Map rate |
Enzyme cutting reads |
Enzyme cutting rate |
|---|---|---|---|---|---|---|---|---|
D1 |
0-250 |
100 bp |
21.52 M |
3.67 Gb |
16.00 M |
74.35 % |
14.33 M |
89.56 % |
D2 |
0-250 |
100 bp |
24.50 M |
3.62 Gb |
15.27 M |
62.33 % |
13.73 M |
89.91 % |
M1 |
0-250 |
100 bp |
20.14 M |
2.68 Gb |
12.02 M |
59.68 % |
10.77 M |
89.60 % |
M2 |
0-250 |
100 bp |
21.52 M |
2.84 Gb |
13.16 M |
61.15 % |
11.81 M |
89.74 % |
D1 and D2 are the samples of goat dry period mammary glands; M1 and M2 are the samples of goat lactation period mammary glands; Enzyme cutting rate: the percentage of unique reads which have enzyme cutting site.
Cumulative distribution and proportion of CG, CHG, and CHH sequence contexts
In this study, methylated cytosine bases distributed across the genomes contained three forms: mCG, mCHG, and mCHH. The amount and proportion of methylcytosines in different components of the genome of two periods were similar (Table 2 and Figures 1-2). Methylcytosine identification was according to the method and correction algorithm of Lister [24]. The proportion of mCG was higher than the other two sequence contexts, in both the lactation and dry periods (Figure 1). For the different regions, mCG in the 3′ UTR was the highest, followed by in the gene body (CDS and intron) region, while the 5′ UTR, 2-kb upstream region and 2-kb downstream region were hypomethylated. Moreover, the methylation levels of CHG and CHH in all regions were low (Supplementary Table 2).
Table 2: The amount and proportion of different types of methylcytosines in analyzed goat genome of lactation and dry periods mammary glands
Sample |
Pattern |
mCG |
mCHG |
mCHH |
|---|---|---|---|---|
D1 |
Number |
121365 |
3071 |
4722 |
Proportion (%) |
93.96 |
2.38 |
3.66 |
|
D2 |
Number |
153746 |
5249 |
7892 |
Proportion (%) |
92.12 |
3.15 |
4.73 |
|
M1 |
Number |
107593 |
2501 |
3782 |
Proportion (%) |
94.48 |
2.20 |
3.32 |
|
M2 |
Number |
93185 |
2244 |
3692 |
Proportion (%) |
94.02 |
2.26 |
3.72 |
D1 and D2 are the samples of goat dry period mammary glands; M1 and M2 are the samples of goat lactation period mammary glands.
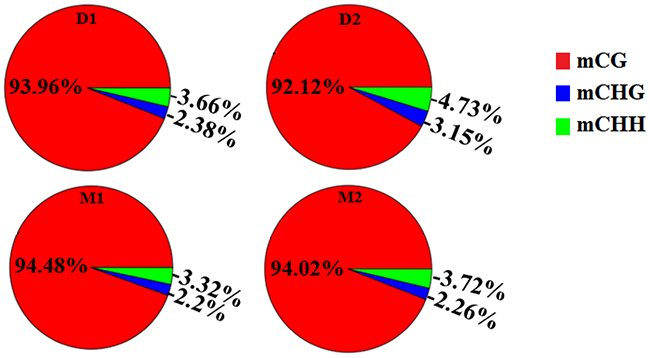
Figure 1: Proportion of different methyl-cytosine patterns in analyzed goat genome of lactation period and dry period mammary glands. Note: D1 and D2 are the samples of goat dry period mammary glands; M1 and M2 are the samples of goat lactation period mammary glands.
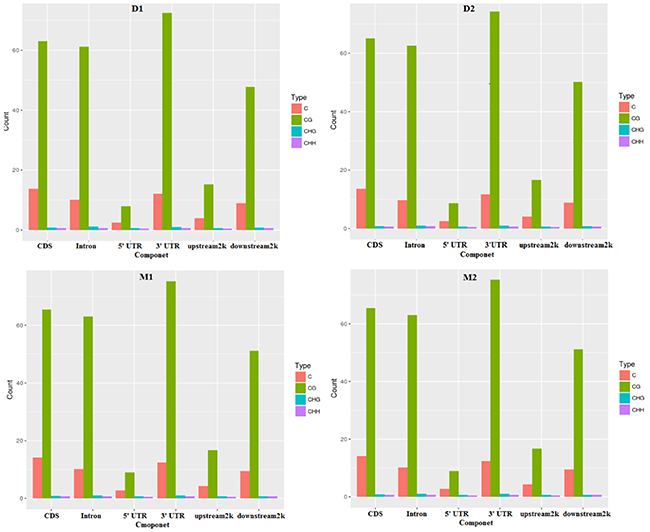
Figure 2: The different kinds of methyl-cytosines distribution in different components of the genome in two periods. Note: D1 and D2 are the samples of goat dry period mammary gland; M1 and M2 are the samples of goat lactation period mammary gland.
The mCGs were enriched at a high methylation level (>90%), and the percentage of methylated CG was rapidly increased to above 30%. Both non-CG sequence contexts were enriched only at a low methylation level (Figure 3). In the dry period, the percentages of mCHG and mCHH were increased and then decreased below 40% and retained a low methylation percentage. However, in the lactation period, the percentages of mCHG and mCHH were represented as a wavy line. The heat map indicated that the average methylation level of cytosine in CpG was inversely proportional to the CpG density patterns (Supplementary Figure 1).
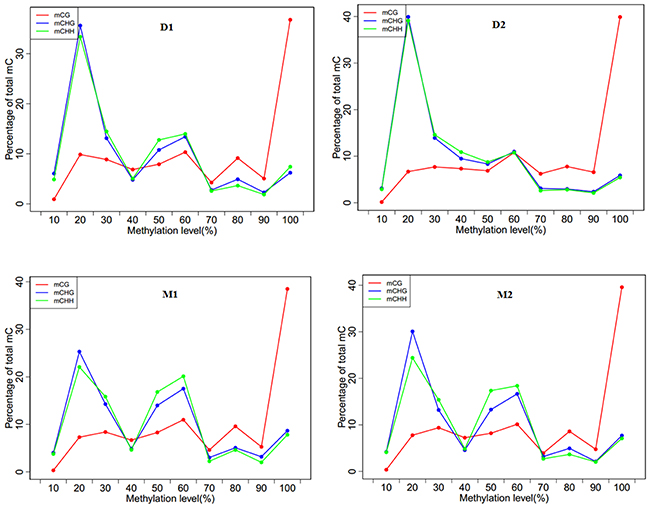
Figure 3: Methylation level distributions for different methyl-cytosine patterns in analyzed goat genome of lactation period and dry period mammary glands. Note: D1 and D2 are the samples of goat dry period mammary glands; M1 and M2 are the samples of goat lactation period mammary glands; The horizontal axis represented methylation level of methyl-cytosines with 10 percentage interval while the vertical axis indicated the percentile distribution; The “mCG” means methylated CG, “mCHG” and “mCHH” as the same.
GO enrichment analysis based on differentially methylated region (DMR) related genes
Differential methylation analysis revealed that the methylation levels of 95 genes were upregulated, while 54 genes were downregulated in the lactation period, relative to the dry period (Table 3 and Figure 4). GO functional analysis, based on DMR-related genes, provided a GO functional classification annotation for DMR-related genes. Detection of DMR-related genes was contributed by identifying potential genes that were associated with mammary gland development and lactation process. All differently expressed genes were mapped to each term of the Gene Ontology database (http://www.geneontology.org/), and the gene numbers of each GO term were calculated. A hypergeometric test was used to determine significantly enriched GO terms of the DMR-related genes compared to the genome background, and the corrected-P value ≤ 0.05 was used as a threshold. GO terms fulfilling this condition were defined as significantly enriched GO terms of DMR-related genes. Through this analysis, we were able to recognize the main biological functions that DMR-related genes participated in (Figure 5). Further, we detected a few genes associated with mammary gland development and lactation, such as peroxisome proliferator-activated receptor α (PPARα), neuropeptide Y (NPY) and retinoid X receptor α (RXRα). The methylation levels of PPARα and NPY genes were downregulated in the lactation period, while those of RXRα gene was upregulated in the lactation period, compared to the dry period.
Table 3: DMR related genes between lactation period and dry period mammary glands
D1-vs- M1 |
D2-vs- M1 |
D1-vs- M2 |
D2-vs- M2 |
|
|---|---|---|---|---|
dowmstream2k.down |
PXDN |
EFNA5 |
CDK14 |
SCN1B |
GSC |
PXDN |
APC2 |
MRPL18 |
|
PSD3 |
LTK |
SCN1B |
||
ANAPC2 |
TK1 |
PSD3 |
||
LOC102182829 |
SMG5 |
|||
TCF7L2 |
PPARA |
|||
dowmstream2k.up |
F7 |
CTBP1 |
EFNA5 |
MTIF3 |
KIAA1257 |
ATPAF2 |
TSSC1 |
||
C21H14orf79 |
FIS1 |
MRPL18 |
||
genebody.down |
KIAA1522 |
B3GNT5 |
MTIF3 |
EFNA4 |
HOXC4 |
KIAA1522 |
LOC102182829 |
GBX1 |
|
ICAM4 |
EFNA4 |
RNF223 |
RGS3 |
|
LOC102187872 |
GRM1 |
EFNA4 |
PLAGL1 |
|
RXRA |
NRDE2 |
NPY |
RBM38 |
|
LOC102186703 |
RXRA |
MSX1 |
TEAD2 |
|
GRIK4 |
RPH3A |
CPZ |
FMNL1 |
|
CASZ1 |
TEAD2 |
GPN1 |
C102179837 |
|
SLC17A7 |
TOM1L2 |
LOC102177267 |
||
TOM1L2 |
LHFPL4 |
MMD |
||
LOC102188264 |
LOC102188264 |
POLDIP2 |
||
LOC102172305 |
TRPM5 |
ACAP1 |
||
CHCHD6 |
FMNL1 |
|||
genebody.up |
C7H19orf60 |
SYT11 |
LOC102172305 |
SYT11 |
LOC102188874 |
NPY |
EHBP1L1 |
ARHGAP27 |
|
LOC102189337 |
MSX1 |
DLX6 |
||
NYAP1 |
KHSRP |
C7H19orf60 |
||
MTG1 |
POLDIP2 |
MISP |
||
NYAP1 |
CRYAB |
|||
MTG1 |
SAMD14 |
|||
upstream2k.down |
GPBAR1 |
LOC102177294 |
MYO15B |
KRT80 |
ARHGAP30 |
INSL3 |
NUDT8 |
MAB21L1 |
|
INSL3 |
ENTPD5 |
SDHB |
SLC39A13 |
|
ENTPD5 |
PRRX1 |
TNIP2 |
ZNF750 |
|
BCAS4 |
ZNF19 |
NBEA |
ALDH1L1 |
|
KCTD10 |
UROC1 |
SLC39A13 |
SERPINB1 |
|
LOC102173495 |
ALDH1L1 |
LOC102173495 |
||
CDC42EP4 |
ZNF750 |
|||
IGF2 |
TOPAZ1 |
|||
upstream2k.up |
POLR3GL |
PKN3 |
BMP6 |
TNS1 |
KRT80 |
RBBP8NL |
C7H19orf67 |
PNLDC1 |
|
KCNT1 |
FCGBP |
GSN |
||
LZTS3 |
EVPL |
PNLDC1 |
||
SLIT3 |
PRSS45 |
CCDC187 |
||
ZNF394 |
DTX1 |
LAMB3 |
||
LOC102191489 |
LMNA |
|||
LMNA |
D1 and D2 are the samples of goat dry period mammary glands; M1 and M2 are the samples of goat lactation period mammary glands; DMR:differentially methylated region.
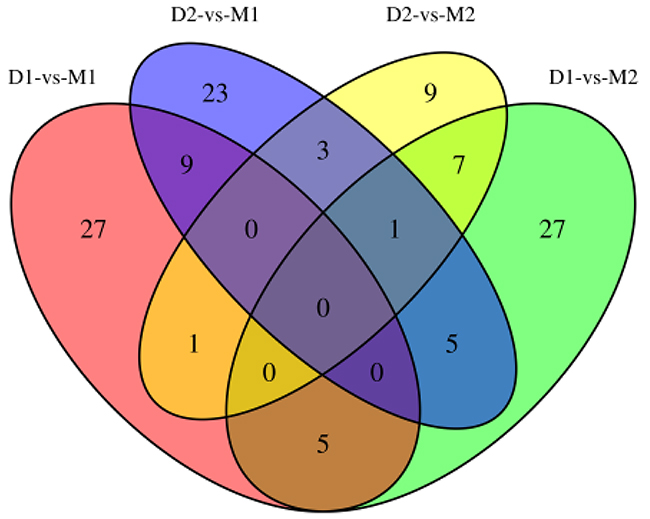
Figure 4: Venn diagram for DMR-related genes of two periods. Note: D1 and D2 are the samples of goat dry period mammary glands; M1 and M2 are the samples of goat lactation period mammary glands; DMR: differentially methylated region.
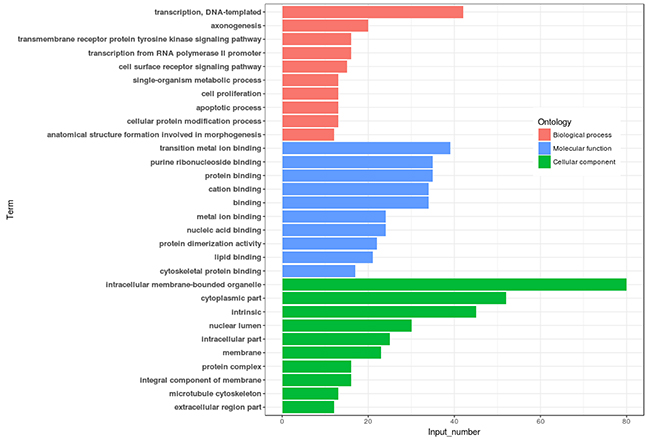
Figure 5: Go annotation of DMR related genes with top ten enrichment numbers covering domains. Note: DMR: differentially methylated region.
Bisulfite sequencing PCR (BSP) of goat PPARα and RXRα genes and human PPARα and NPY genes
In order to verify the accuracy of RRBS and to determine the key genes that function through methylation modification, PPARα, RXRα and NPY genes were chosen to perform the experimental study involvinig in dairy goat mammary glands and cell lines. We intended to detect the methylation levels of the above genes from both organizational and cellular consideration, but there was no mature and commercial goat mammary epithelial cell line; therefore, we used the human mammary epithelial cell line. The homology of PPARα, RXRα and NPY genes between human and goat was relatively high (Supplementary Figure 2 and Table 4); therefore, we were able to detect some of these related genes in human cell lines.
Table 4: Pairwise sequence alignment of six species PPARα, RXRα and NPY genes
Amino acid sequences1 |
Identity of two aligned sequences (%)2 |
||||
|---|---|---|---|---|---|
PPARα |
1 |
2 |
3 |
4 |
5 |
1. ALZ41704.1 Capra hircus (goat) |
|||||
2. ADW20209.1 Ovis aries (sheep) |
78.0% |
||||
3. AAI16040.1 Bos taurus (cattle) |
77.0% |
98.9% |
|||
4. NP_001007140.2 Homo sapiens (human) |
70.4% |
94.0% |
94.5% |
||
5. CAA39574.1 Sus scrofa (pig) |
71.2% |
94.3% |
94.5% |
94.4% |
|
6. AAH53489.1 Mus musculus (mouse) |
67.1% |
90.4% |
90.9% |
92.3% |
91.0% |
RXRα |
1 |
2 |
3 |
4 |
5 |
1. ALZ41704.1 Capra hircus (goat) |
|||||
2. ADW20209.1 Ovis aries (sheep) |
99.4% |
||||
3. AAI16040.1 Bos taurus (cattle) |
99.4% |
100.0% |
|||
4. NP_001007140.2 Homo sapiens (human) |
99.4% |
100.0% |
100.0% |
||
5. CAA39574.1 Sus scrofa (pig) |
99.4% |
100.0% |
100.0% |
100.0% |
|
6. AAH53489.1 Mus musculus (mouse) |
98.8% |
99.4% |
99.4% |
99.4% |
99.4% |
NPY |
1 |
2 |
3 |
4 |
5 |
1. ALZ41704.1 Capra hircus (goat) |
|||||
2. ADW20209.1 Ovis aries (sheep) |
100.0% |
||||
3. AAI16040.1 Bos taurus (cattle) |
99.0% |
99.0% |
|||
4. NP_001007140.2 Homo sapiens (human) |
93.8% |
93.8% |
94.8% |
||
5. CAA39574.1 Sus scrofa (pig) |
92.8% |
92.8% |
93.8% |
92.8% |
|
6. AAH53489.1 Mus musculus (mouse) |
89.7% |
89.7% |
90.7% |
92.8% |
87.6% |
The pairwise sequence alignment (PROTEIN) was conducted using EMBOSS Needle method (using Needleman-Wunsch algorithm): http://www.ebi.ac.uk/Tools/psa/emboss_needle/.
Amino acid sequences1: The gene amino acid sequence name of each species was shown as: Number + Protein_id + The Latin name of the species + (Species);
Identity of two aligned sequences (%)2: The identity of the two aligned sequences was shown as percentage.
The CpG islands and methylation primers of the 5′ flanking, gene body, and 3′ flanking regions of goat PPARα and RXRα genes and human PPARα and NPY genes were predicted and designed for BSP (Supplementary Figure 3-6 and Table 5). DNA treated with bisulfite was used as a template to amplify the CpG islands of goat PPARα-P3 and RXRα-P1 genes and human PPARα-P1 and NPY-P1 genes, of which the products were 283, 226, 230 and 299 bp, respectively (Figure 6 and Supplementary Figure 7). After TA cloning, 15-20 positive clones were selected and sequenced for each sample to identify the methylation status (Figure 7). The methylation patterns of all genes were displayed in White-Black Rectangle, wherein black and white rectangles represented methylated CG and non-methylated CG loci, respectively (Figure 8-11).
Table 5: BSP primers design for CpG islands of goat and human genes
Primer names |
Primer sequences |
Product sizes |
CpGs numbers |
Posotion |
|---|---|---|---|---|
gPPARα-P1 |
F: GTTGGTATTTGGGGTTTTGTGT |
195 bp |
13 |
5’- flanking region |
gPPARα-P2 |
F: TTTGTGGTGTGTTAGGTGATATTTT |
223 bp |
6 |
5’- flanking region |
gPPARα-P3 |
F: TGTGGGTTAAGGATGAGTATAAGTTAG |
283 bp |
19 |
3’- flanking region |
gRXRα-P1 |
F: AGTTAGGAGTAGGGGAGTTAGGAGTT |
226 bp |
17 |
intron 1 |
gRXRα-P2 |
F: GTGTGGGAAGGAAAGTAGTTTTATTT |
228 bp |
17 |
intron 1 |
gRXRα-P3 |
F: TTATTTGGTTTAAAGTGAAATTTTT |
177 bp |
11 |
intron 3 |
hNPY-P1 |
F: GAGAAGGGGTAGAAGTTTTTGAAAT |
299 bp |
16 |
5’- flanking region |
hNPY-P2 |
F: AGGGAGAAAAGTGATTTAGTAGGAAG |
204 bp |
16 |
intron 3 |
hPPARα-P1 |
F: AGTATAGTGGTAGGTATAGTTGGTAG |
230 bp |
17 |
5’- flanking region |
hPPARα-P2 |
F: AGGTTGGTTTAGGAGTTTTGTGTAG |
186 bp |
7 |
3’- flanking region |
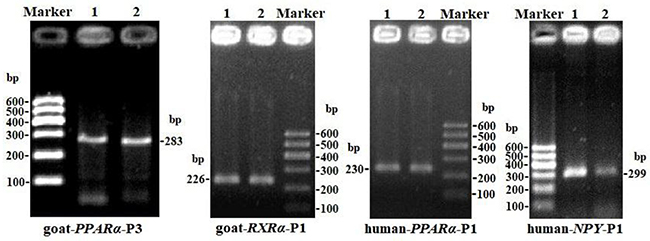
Figure 6: PCR electrophoresis diagrams of CpG islands of goat PPARα-P3 and RXRα-P1 and human PPARα-P1 and NPY-P1 genes.
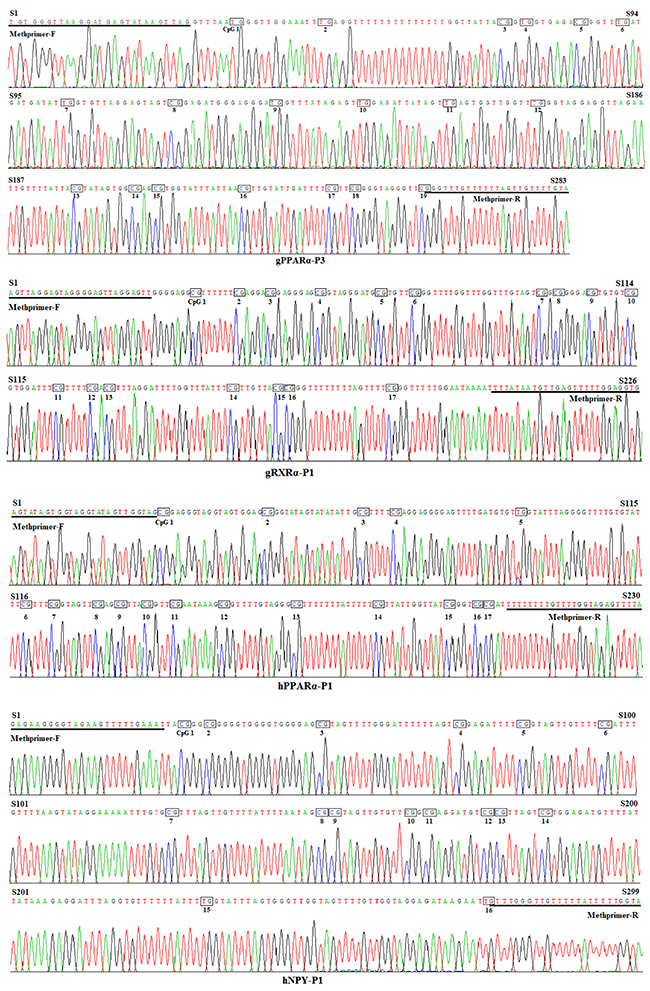
Figure 7: Bisulfite sequencing maps of CpG islands of goat PPARα-P3 and RXRα-P1 and human PPARα-P1 and NPY-P1 genes.
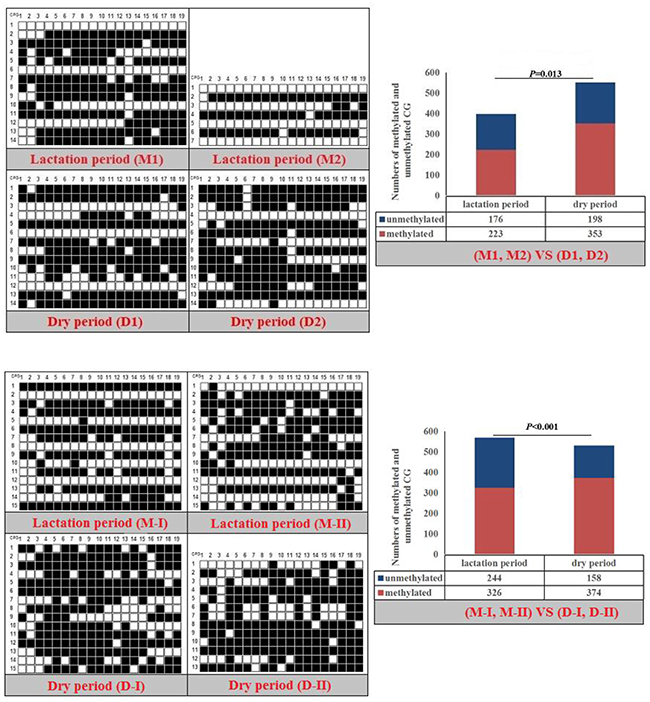
Figure 8: Methylation patterns and significant difference of goat PPARα-P3 CpG island of between lactation and dry periods (Note: Black and white rectangles represented methylated CG and non-methylated CG loci, respectively).
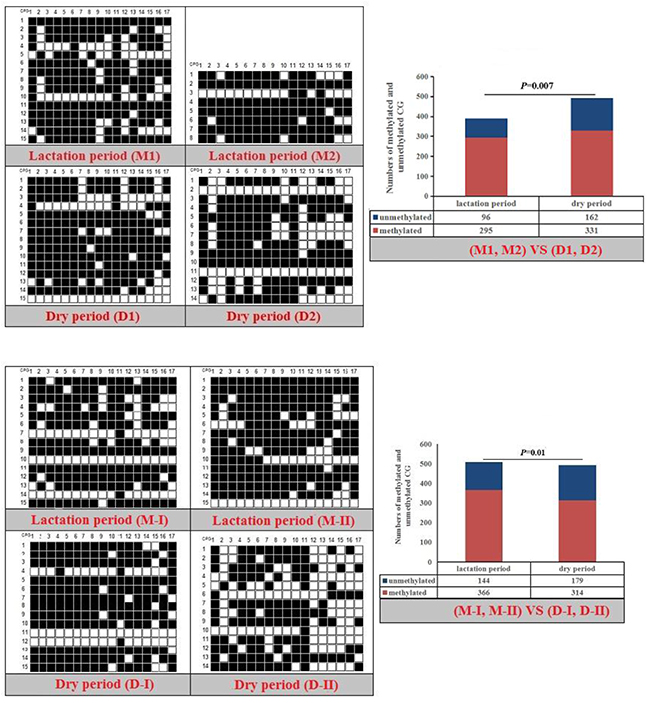
Figure 9: Methylation patterns and significant difference of goat RXRα-P1 CpG island of between lactation and dry periods.
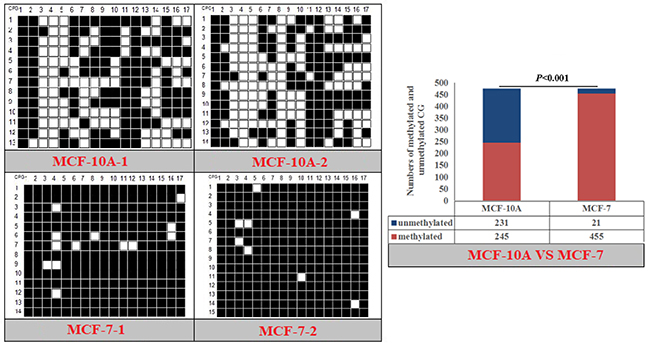
Figure 10: Methylation patterns and significant difference of human PPARα-P1 CpG island of between MXF-10A and MCF7.
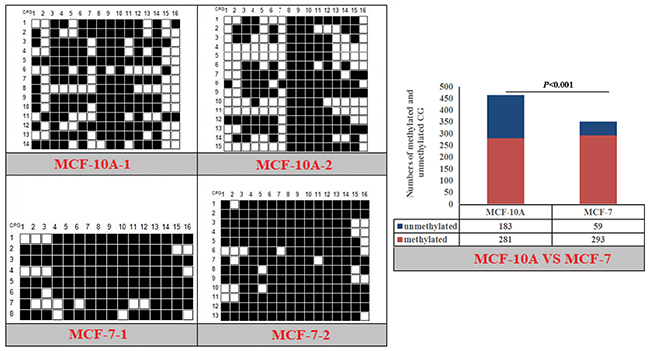
Figure 11: Methylation patterns and significant difference of human NPY-P1 CpG island of between MXF-10A and MCF7.
DNAm comparison of entire CpG islands and each CpG dinucleotide locus
Fisher’s exact test showed that methylation differences existed in the goat PPARα-P3 and RXRα-P1 genes from mammary glands between the lactation and dry periods, and also in human PPARα-P1 and NPY-P1 genes between the MCF-10A and MCF-7 cells (Figure 8-11 and Table 6). The results showed that the methylation level of the entire CpG islands of the goat PPARα gene in the lactation period was significant lower than that in the dry period (P < 0.05 or P < 0.01), which was in accordance with the RRBS results. There was a significant higher methylation level in the CpG islands of the goat RXRα gene in the lactation period than that in the dry period, which was also in accordance with the RRBS results (P < 0.05 or P < 0.01). On the other hand, the methylation percentages of the human PPARα and NPY genes had a significantly high level in the MCF-7 cells compared to the MCF-10A cells (P < 0.05 or P < 0.01) (Figure 8-11 and Table 6).
Table 6: Methylation percentages of entire CpG islands of goat mammary gland tissues and human mammary gland cells
Goat |
M1 (%) |
M2 (%) |
D1 (%) |
D2 (%) |
P value |
M-I (%) |
M-II (%) |
D-I (%) |
D-II (%) |
P value |
|---|---|---|---|---|---|---|---|---|---|---|
gPPARα-P3 |
62.78 |
42.11 |
60 |
63.86 |
P=0.013 |
56.14 |
58.25 |
69.82 |
70.85 |
P<0.01 |
gRXRα-P1 |
73.33 |
79.41 |
73.33 |
60.50 |
P=0.007 |
67.06 |
76.47 |
73.73 |
52.94 |
P=0.01 |
Human |
MCF-10A-1 (%) |
MCF-10A-2 (%) |
MCF-7-1 (%) |
MCF-7-2 (%) |
P value |
|||||
hPPARα-P1 |
52.94 |
50 |
94.54 |
96.64 |
P<0.001 |
|||||
hNPY-P1 |
64.29 |
57.08 |
84.38 |
82.59 |
P<0.001 |
|||||
D1 and D2 are the samples of goat dry period mammary gland; M1 and M2 are the samples of goat lactation period mammary gland.
Note: The mammary gland tissues of dry period (D1 and D2) and lactation period (M1 and M2) were the samples used for RRBS sequencing. The mammary gland samples of dry period (D-I and D-II) and lactation period (M-I and M-II) were different from the sequence samples.
The methylation patterns and percentages of the each CpG dinucleotide locus of PPARα-P3 and RXRα-P1 genes in goat mammary gland tissues, and PPARα-P1 and NPY-P1 genes in human MCF-10A and MCF-7 cells, were calculated (Supplementary Figure 8-9 and Supplementary Table 3-4). The results showed that some of the CpG-dinucleotide loci had significant differences between the two periods or the two types of cells.
DISCUSSION
Bisulfite sequencing can detect the whole genome DNAm level of each base position, and is an ideal technology to study DNAm of different species and tissues [25-27]. However, accurate assessment of the methylation level of each base position requires high coverage genome-wide DNAm sequencing of whole genomes. This study used RRBS sequencing because of its simple operation, small data requirement, and low cost. RRBS can achieve single-base analysis of genomic DNAm, and is suitable for detecting DNAm differences among tissues or environments. RRBS has been used to study the methylation profiles of bovine [28], pig [29, 30] and human breeds [31], especially in cancer [32].
Mammalian methylation patterns are conservative, and most of them occur in the CG motif [33-35]. In the present study, the proportions of mCG were the highest in both lactation and dry periods, compared to non-CGm. The methylation status of CG, CHG, and CHH differed between species, and there were differences in the spatial, temporal, and physiological dimensions of methylated cytosines within a single organism. The methylation levels of CG were highest in the 3′ UTR region, followed by the gene body region (CDS and intron), while the 5′ UTR, 2-kb upstream, and 2-kb downstream regions were hypomethylated. These results were also observed in rats and humans [36, 37]. The methylation pattern in the transcription area was lower than that in the upstream and downstream region in plants [38, 39]. Additionally, hypermethylation was found in the 3′ UTR region in the present study. Post-transcriptional regulation is the important regulatory mechanism for gene expression, in addition to transcriptional regulation. RNA-binding proteins combine with specific mRNA 3′ UTRs to determine mRNA stability, gene expression localization, and translation [40, 41]. The hypermethylation of 3′ UTR may therefore participate in mRNA stability.
The results showed that the numbers of mCG, mCHG, and mCHH genes in the dry period were higher than that in the lactation period. A considerable part of current research shows that mammary gland development and lactation processes are regulated by methylation. The DNAm level in the lactating mammary gland is lower than that in the liver [42]. The milk protein related genes are detected by hypomethylation only in the lactation period, and by hypermethylation in other periods [7]. The decline of milk protein gene expressions may be regulated by DNAm during mammary involution in dairy cows [9]. Ziller et al (2011) analyzed the methylation characteristics of human pluripotent stem cells and differentiated stem cells, and confirmed that mature cells displayed non-CpG methylation patterns. Compared with embryonic stem cells, the percentage of methylation in non-mature cells was lower, which indicated that the non-CpGm might also have tissue specificity. In addition, the paper also argued that there was a close link between CpGm and non-CpGm [14]. The results of the present study showed that the methylation distributions of CpG were the opposite of the non-CpG distributions. We found that non-CpGs were enriched at the hypomethylation regions, which was consistent with the study of cattle somatic tissues [29]. However, the functions of non-CpG genes have not received much attention, and remain unclear in animals until this study. Our preliminary results implied that the non-CpG genes may function in gene expression and tissue development.
During the parturition process, the pituitary gland secretes a large amount of prolactin to stimulate the mammary gland, initiating normal secretion activity. The prolactin expression then declines, stopping lactation and initiating the dry period. This phenomenon occurs because it is more of a physiological change, in which methylation is essential. Significantly different methylation profiles between lactation and dry periods were observed. Studies showed that rat lactating mammary glands can synthesize polyunsaturated fatty acids with the transcription factor PPARα [43, 44]. In the present study, the methylation degree of the PPARα gene was downregulated in lactation, while the degree of methylation of the RXRα gene was upregulated in the lactation period. PPARα plays vital roles in the anabolism and catabolism of fatty acids [45]. It is a member of the steroid hormone receptor family, and its binding with ligands causes a conformational change, forming the PPAR-α-RXR heterodimer that regulates genes expression [46]. Hence, we speculated that the methylation differences between these two genes are involved in their functions.
Lactation causes a massive metabolic demand in mammals due to which various homeostatic mechanisms are initiated, including a large increase in food intake. NPY expression may be involved in the physiological circumstances established during lactation that cause hyperphagia; the mRNA in the arcuate nucleus being significantly elevated during lactation [47]. On the other hand, suckling, which induces hyperprolactinemia, can stimulate the activation of hypothalamic NPY neurons, suggesting that NPY is modulated by prolactin (PRL) during lactation [48]. Increased NPY expression during lactation drives the chronic hyperphagia, and transmits the information to gonadotropin-releasing hormone (GnRH) neurons in order to suppress the GnRH neuronal activity, and thus control the luteinizing hormone levels (HL) [49].
The MCF-7 breast cancer cell line is a classic cell line of breast cancer, and is used in many breast cancer studies. The cells have some characteristics similar to those of differentiated mammary epithelial cells. Recently, studies have shown that epigenetic changes play an important role in the development of breast cancer, especially in DNAm abnormalities. Both human PPARα and NPY genes had a higher methylation level in the MCF-7 cells than that in the MCF-10A cells, which may be a concern with the cell type. This result combined with the lower methylation level of the goat PPARα gene in the lactation period than that in the dry period led us to speculate that the PPARα gene had a relatively low functional methylation level. The NPY gene methylation pattern provides a new insight to further investigate its function and mechanism.
In summary, this study revealed an integrated genome-wide DNAm difference and the distribution and proportion of four kinds of methylcytosines in the lactation and dry periods of goat mammary glands. A number of genes associated with mammary gland development and lactation process were found in DMRs. These findings provide essential information for the epigenetic regulation of the mammary gland in dairy goats.
MATERIALS AND METHODS
Ethics statement
This study was carried out in accordance with the recommendations of the Institutional Animal Care and Use Committee (IACUC) of Northwest A&F University (NWAFU-314020038), China. The protocol was reviewed and approved by the Institutional Animal Care and Use Committee (IACUC) of Northwest A&F University, China.
Sample collection
The Xinong Saanen dairy goat is an excellent breed in China, and is mainly reared at the Xinong Saanen dairy goat breeding farm located at the Northwest A&F University, Yangling, Shaanxi, China. In total, four healthy female Xinong Saanen dairy goats were selected from the Yangling High-Tech Agriculture Demonstration Zone, Shaanxi Province, China. Mammary gland tissue samples were collected for RRBS sequencing. We cut a piece of mammary gland tissues at random from mammary gland. Two of the Xinong Saanen dairy goats were in the lactation period, which was classified as 15 days to six months postpartum (M1 and M2). The other two Xinong Saanen dairy goats were in the dry period, which was classified as 15 days after mammary involution (D1 and D2) [50, 51]. All samples were frozen in liquid nitrogen and stored at -80°C until use.
In order to verify the RRBS sequencinig results, we not only used the above-mentioned samples (M1, M2 and D1, D2) but also utilized the other samples. So, we collected four other Xinong Saanen dairy goat mammary gland tissue samples from a Xinong Sanen Dairy Goat Farm, Fuping, Shaanxi Province, China. Two mammary gland tissue samples from goats in the lactation period were named as M-I and M-II; two tissue samples from goats in the dry period were named as D-I and D-II, with each period having duplicate tissue samples. All samples were frozen in liquid nitrogen and stored at -80°C.
The MCF-7 cell line, a classic human breast cancer cell line, was cultured in our laboratory. The MCF-10A cells, human mammary epithelial cells, were kindly purchased by Stem Cell Bank, Chinese Academy of Science, Shanghai, China. Duplicate cells of both types of human cell lines (MCF-7-1, MCF-7-2, and MCF-10A-1, MCF-10A-2) were cultured for further study.
RRBS library construction and sequencing
Methylation profiles of the mammary gland tissues were studied using the RRBS method by Guangzhou Gene Denovo Biotechnology Co. Ltd. (Guangzhou, China). Genomic DNA of mammary gland tissues (M1, M2, D1, D2) were isolated using the TIANamp Genomic DNA Kit. The qualified DNA was then digested by restriction endonucleases (MspI) and repaired by 3′-end addition and adaptor ligation. The 250–500-bp fragments were then selected and treated with ZYMO EZ DNA Methylation-Gold kit for bisulfite conversion. The converted DNA was used for PCR amplification, and then the concentration was measured using an Agilent 2100 bioanalyzer instrument to construct the RRBS library, which was used for sequencing. The constructed library was subjected to high-throughput sequencing using the Illumina Hiseq 2500 platform with paired-end 125 bp sequencing (PE125).
RRBS data analysis
Raw sequencing data were filtered and assembled. The low-quality reads (Q < 20 and N > 10%) were filtered out from the raw reads. High quality and clean reads were mapped to goat reference genomes using BSMAP (version 2.90) software by Guangzhou Gene Denovo Biotechnology Co. Ltd. (Guangzhou, China) [52]. In order to detect the level of DNAm at each base, a methylation site with a coverage greater than 10 and an average mass number greater than 20 were extracted for subsequent analysis. Only the unique mapped reads that had enzyme cutting sites could be used for standard analysis and personalized bioinformatic analysis. The unique mapped reads were analyzed to obtain methylation information of cytosine, including coverage analysis, methylation analysis, and DMRs analysis.
The methylation level was determined by dividing the number of reads covering each mC by the total reads covering that particular cytosine [53, 54], which was also equal to the mC/C ratio at each reference cytosine [30]. Only methylated cytosines with sequence depth coverage of at least 10, that were also were covered by at least four reads, were used.
Identification of the important genes based on DMRs
A sliding-window approach was used to identify DMRs. All the DMR-related genes were clustered based on the Gene Ontology (GO) annotation database [53]. After multiple testing corrections, we choose to deem pathways with a Q value ≤ 0.05 as significantly enriched with DMR-related genes. Considering the significant enrichment to pathways, we found the main biochemical pathways and signal transduction pathways in which the DMR-related genes were located.
Cell cultures
MCF-7 cells were grown in RPMI 1640 supplemented with 10.0% fetal bovine serum (FBS), 0.3 g/L glutamine, and 1.0% penicillin/streptomycin solution. Cells were maintained at 37°C, in a humidified atmosphere containing 5.0% CO2.
According to the culutre direction of Stem Cell Bank, Chinese Academy of Science, Shanghai, China, MCF-10A cells were cultured in MEGM kit Growth Media (Lonza/Clonetics, CC-3150) supplemented with 0.1% insulin, 0.4% FBS, 0.1% epidermal growth factor (EGF), 0.1% glucocorticoids, 0.1% cholera toxin and 1% penicillin/streptomycin solution. The cells were maintained at 37°C in a humidified atmosphere containing 5.0% CO2.
DNA extraction and bisulfite conversion
Eight goat mammary gland tissue samples, as well as MCF-7 and MCF-10-A cells, were used for the bisulfite sequencing validation. The genomic DNA of MCF-7 and MCF-10A was isolated according to Takara MiniBEST Universal Genomic DNA Extraction Kit Ver. 5.0 (Takara Company, Dalian, China). The genomic DNA of the mammary gland tissue samples was extracted using phenol: chloroform, and treated with the EZ DNA Methylation-Gold kit (Zymo Research, Orange, CA) for bisulfite conversion. The genomic DNA was treated with bisulfite, which resulted in all of the non-methylated cytosine being converted to uracil, and the methylated cytosine remaining unchanged.
Bisulfite sequencing validation of CpG islands for DMR-related genes
The CpG islands of goat PPARα and RXRα genes and human PPARα and NPY genes were predicted, and methylation primers were designed using the MethPrimer online software (http://www.urogene.org/methprimer/). The PCR products were purified and linked to the PGEM-T Easy Vector system (Promega Corp. WI, USA), then transformed to a DH5α competent cell in order to screen positive clones for sequencing.
In total, 15-20 positive clones were sequenced for each sample to identify the methylated CG sites. The methylation status of each CG locus was obtained by alignment using BioXM (version 2.6.0, developed by College of Agriculture, Nanjing Agricultural University, China). The methylated CG or unmethylated CG of the CpG islands was coded as 1/0. White-Black Rectangle of CG loci were delineated by MSR calculate (http://www.msrcall.com/) developed by our team (Lan’s and Liu’s group). Fisher’s exact test (χ2-test) was used to test for significance between the CpG islands, CG loci for both thelactation and dry period of dairy goats, and the MCF-7 and MCF-10-A cells of humans.
Abbreviations
RRBS, reduced representation bisulfite sequencing; DNAm, DNA methylation; CDS, coding sequence; DMRs, differentially methylated regions; DNMT3, DNA (cytosine-5)-methyltransferase 3; PPARα, peroxisome proliferator-activated receptor alpha; NPY, neuropeptide Y; RXRα, retinoid X receptor alpha; GO, GeneOntology.
Author contributions
XYL and ZJL conceived the experiments and collected samples. LM, HX and SHZ performed in computational analyses. XYL and HC analyzed the data and revised the manuscriot. XYZ and SHZ performed the experiment and wrote the paper. EHJ collected the goat mammary gland tissues and extracted DNA of mammary glands, and carried out the DNA methylation experiment. RC and QY cultured human MCF10-A and MC7 cells and carried out the DNA methylation experiment. All authors read and approved the final manuscript.
CONFLICTS OF INTEREST
We confirm that this manuscript has not been published in whole or in part and is not being considered for publication elsewhere. There are no any ethical conflicts of interest for all authors. The corresponding authors, Dr. XY Lan and Dr. ZJ Li, take responsibility on behalf of all authors for the authorship, authenticity and integrity of this manuscript, and affirms that all authors and acknowledged contributors have read and approved this manuscript.
FUNDING
This work was supported by the Natural Science Foundation of Shaanxi Province of China (No. 2017JM3021), National Natural Science Foundation of China (No.31172184; No.31501929), Technology Foundation for Selected Overseas Chinese Scholar of Shaanxi Province (Lan XY, 2014-QD-14).
REFERENCES
1. Donovan SM. Role of human milk components in gastrointestinal development: current knowledge and future needs. J Pediatr. 2006; 149:49-61.
2. Pouliot Y, Gauthier SF. Milk growth factors as health products: some technological aspects. Int Dairy J. 2006; 16:1415-20.
3. Ceballos LS, Morales ER, Adarve GDT, Castro JD, Martínez LP, Sampelayo MRS. Composition of goat and cow milk produced under similar conditions and analyzed by identical methodology. J Food Compos Anal. 2009; 22:322-9.
4. Li X, Luo J, Zhu JJ. Effect of different diet energy and protein level on lactation performance of xinong Saanen dairy goats. Acta Ecol Animalis Domastici. 2013; 3:008.
5. Jirillo F, Magrone T. Anti-inflammatory and anti-allergic properties of donkey’s and goat’s milk. Endocr Metab Immune. 2014; 14:27-37.
6. Plachot C, Lelievre SA. DNA methylation control of tissue polarity and cellular differentiation in the mammary epithelium. Exp Cell Res. 2004; 298:122–32.
7. Rijnkels M, Kabotyanski E, Montazer-Torbati MB, Hue-Beauvais C, Vassetzky Y, Rosen JM, Devinoy E. The epigenetic landscape of mammary gland development and functional differentiation. J Mammary Gland Biol Neoplasia. 2010; 15:85–100.
8. Lee HJ, Hinshelwood RA, Bouras T, Gallego-Ortega D, Valdés-Mora F, Blazek K, Visvader JE, Clark SJ, Ormandy CJ. Lineage specific methylation of the Elf5 promoter in mammary epithelial cells. Stem Cells. 2011; 29:1611–19.
9. Singh K, Molenaar AJ, Swanson KM, Gudex B, Arias JA, Erdman RA, Stelwagen K. Epigenetics: a possible role in acute and transgenerational regulation of dairy cow milk production. Animal. 2012; 6:375–81.
10. Gu H, Bock C, Mikkelsen TS, Jäger N, Smith ZD, Tomazou E, Gnirke A, Lander ES, Meissner A. Genome-scale DNA methylation mapping of clinical samples at single-nucleotide resolution. Nat Methods. 2010; 7:133–6.
11. Portela A, Esteller M. Epigenetic modifications and human disease. Nat biotechnol. 2010; 28:1057–68.
12. Chuang JC, Jones PA. Epigenetics and microRNAs. Pediatr Res. 2007; 61:24R-9R.
13. Yan J, Zierath JR, Barrès R. Evidence for non-CpG methylation in mammals. Exp Cell Res. 2011; 317:2555–61.
14. Ziller MJ, Müller F, Liao J, Zhang Y, Gu H, Bock C, Boyle P, Epstein CB, Bernstein BE, Lengauer T, Gnirke A, Meissner A. Genomic distribution and inter-sample variation of non-CpG methylation across human cell types. PLoS Genet. 2011; 7:e10023892011.
15. Hatada I, Fukasawa M, Kimura M, Morita S, Yamada K, Yoshikawa T, Yamanaka S, Endo C, Sakurada A, Sato M, Kondo T, Horii A, Ushijima T, et al. Genome-wide profiling of promoter methylation in human. Oncogene. 2006; 25:3059–64.
16. Couldrey C, Brauning R, Bracegirdle J, Maclean P, Henderson HV, McEwan JC. Genome-wide DNA methylation patterns and transcription analysis in sheep muscle. PLoS One. 2014; 9:e101853.
17. Gao F, Zhang J, Jiang P, Gong D, Wang JW, Xia Y, Østergaard MV, Wang J, Sangild PT. Marked methylation changes in intestinal genes during the perinatal period of preterm neonates. BMC Genomics. 2014; 15:716.
18. Huang YZ, Sun JJ, Zhang LZ, Li CJ, Womack JE, Li ZJ, Lan XY, Lei CZ, Zhang CL, Zhao X, Chen H. Genome-wide DNA methylation profiles and their relationships with mRNA and the microRNA transcriptome in bovine muscle tissue (Bos taurine). Sci Rep. 2014; 4:6546.
19. Su J, Wang Y, Xing X, Liu J, Zhang Y. Genome-wide analysis of DNA methylation in bovine placentas. BMC Genomics. 2014; 15:12.
20. Cao J, Wei C, Liu D, Wang H, Wu M, Xie Z, Capellini TD, Zhang L, Zhao F, Li L, Zhong T, Wang L, Lu J, et al. DNA methylation landscape of body size variation in sheep. Sci Rep. 2015; 5:13950.
21. Van-Gurp TP, Wagemaker NCAM, Wouters B, Vergeer P, Ouborg JN, Verhoeven KJ. epiGBS: reference-free reduced representation bisulfite sequencing. Nat Methods. 2016; 13:322–9.
22. Meissner A, Gnirke A, Bell GW, Ramsahoye B, Lander ES, Jaenisch R. Reduced representation bisulfite sequencingfor comparative high-resolution DNA methylation analysis. Nucleic Acids Res. 2005; 33:5868–77.
23. Meissner A, Mikkelsen TS, Gu H, Wernig M, Hanna J, Sivachenko A, Zhang X, Bernstein BE, Nusbaum C, Jaffe DB, Gnirke A, Jaenisch R, Lander ES. Genome-scale DNA methylation maps of pluripotent and differentiated cells. Nature. 2008; 454:766–70.
24. Lister R, Ecker JR. Finding the fifth base: genome-wide sequencing of cytosine methylation. Genome Res. 2009; 19:959–66.
25. Feng S, Cokus SJ, Zhang X, Chen PY, Bostick M, Goll MG, Hetzel J, Jain J, Strauss SH, Halpern ME, Ukomadu C, Sadler KC, Pradhan S, et al. Conservation and divergence of methylation patterning in plants and animals. Proc Natl Acad Sci USA. 2010; 107:8689–94.
26. Schmitz RJ, Schultz MD, Urich MA, Nery JR, Pelizzola M, Libiger O, Alix A, McCosh RB, Chen H, Schork NJ, Ecker JR. Patterns of population epigenomic diversity. Nature. 2013; 495:193–8.
27. Ziller MJ, Gu H, Müller F, Donaghey J, Tsai LT, Kohlbacher O, De-Jager PL, Rosen ED, Bennett DA, Bernstein BE, Gnirke A, Meissner A. Charting a dynamic DNA methylation landscape of the human genome. Nature. 2013; 500:477–81.
28. Choi M, Lee J, Le MT, Nguyen DT, Park S, Soundrarajan N, Schachtschneider KM, Kim J, Park JK, Kim JH, Park C. Genome-wide analysis of DNA methylation in pigs using reduced representation bisulfite sequencing. DNA Res. 2015; 22:343–55.
29. Zhou Y, Xu L, Bickhart DM, Abdel-Hay EH, Schroeder SG, Connor EE, Alexander LJ, Sonstegard TS, Van-Tassell CP, Chen H, Liu GE. Reduced representation bisulphite sequencing of ten bovine somatic tissues reveals DNA methylation patterns and their impacts on gene expression. BMC Genomics. 2016; 17:779.
30. Yuan XL, Gao N, Xing Y, Zhang HB, Zhang AL, Liu J, He JL, Xu Y, Lin WM, Chen ZM, Zhang H, Zhang Z, Li JQ. Profiling the genome-wide DNA methylation pattern of porcine ovaries using reduced representation bisulfite sequencing. Sci Rep. 2016; 6:22138.
31. Hanley MP, Hahn MA, Li AX, Wu X, Lin J, Wang J, Choi AH, Ouyang Z, Fong Y, Pfeifer GP, Devers TJ, Rosenberg DW. Genome-wide DNA methylation profiling reveals cancer-associated changes within early colonic neoplasia. Oncogene. 2017; 36:5035-44.
32. Tombolan L, Poli E, Martini P, Zin A, Romualdi C, Bisogno G, Lanfranchi G. NELL1, whose high expression correlates with negative outcomes, has different methylation patterns in alveolar and embryonal rhabdomyosarcoma. Oncotarget. 2017; 8:33086–33099. https://doi.org/10.18632/oncotarget.16526.
33. Lister R, Pelizzola M, Dowen RH, Hawkins RD, Hon G, Tonti-Filippini J, Nery JR, Lee L, Ye Z, Ngo QM, Edsall L, Antosiewicz-Bourget J, Stewart R, et al. Human DNA methylomes at base resolution show widespread epigenomic differences. Nature. 2009; 462:315–22.
34. Li Q, Li N, Hu X, Li J, Du Z, Chen L, Yin G, Duan J, Zhang H, Zhao Y, Wang J, Li N. Genome-wide mapping of DNA methylation in chicken. PLoS One. 2011; 6:e19428.
35. Li X, Zhu J, Hu F, Ge S, Ye M, Xiang H, Zhang G, Zheng X, Zhang H, Zhang S, Li Q, Luo R, Yu C, et al. Single-base resolution maps of cultivated and wild rice methylomes and regulatory roles of DNA methylation in plant gene expression. BMC Genomics. 2012; 13:300.
36. Laurent L, Wong E, Li G, Huynh T, Tsirigos A, Ong CT, Low HM, Kin-Sung KW, Rigoutsos I, Loring J, Wei CL. Dynamic changes in the human methylome during differentiation. Genome Res. 2010; 20:320–31.
37. Sati S, Tanwar VS, Kumar KA, Patowary A, Jain V, Ghosh S, Ahmad S, Singh M, Reddy SU, Chandak GR, Raghunath M, Sivasubbu S, Chakraborty K, et al. High resolution methylome map of rat indicates role of intragenic DNA methylation in identification of coding region. PLoS One. 2012; 7:e31621.
38. Cokus SJ, Feng S, Zhang X, Chen Z, Merriman B, Haudenschild CD, Pradhan S, Nelson SF, Pellegrini M, Jacobsen SE. Shotgun bisulphite sequencing of the Arabidopsis genome reveals DNA methylation patterning. Nature. 2008; 452:215–9.
39. Song QX, Lu X, Li QT, Chen H, Hu XY, Ma B, Zhang WK, Chen SY, Zhang JS. Genome-wide analysis of DNA methylation in soybean. Mol Plant. 2013; 6:1961–74.
40. Hughes TA. Regulation of gene expression by alternative untranslated regions. Trends Genet. 2006; 22:119–22.
41. Berkovits BD, Mayr C. Alternative 3’ UTRs act as scaffolds to regulate membrane proteinlocalization. Nature. 2015; 522:363–7.
42. Johnson ML, Levy J, Supowit SC, Yu-Lee LY, Rosen JM. Tissue-and cell-specific casein gene expression. II. Relationship to site-specific DNA methylation. J Biol Chem. 1983; 258:10805–11.
43. Rodriguez-Cruz M, Tovar AR, Palacios-González B, Del-Prado M, Torres N. Synthesis of long-chain polyunsaturated fatty acids in lactating mammary gland: role of Delta5 and Delta6 desaturases, SREBP-1, PPARalpha, and PGC-1. J Lipid Res. 2006; 47:553–60.
44. Bionaz M, Loor JJ. Gene networks driving bovine milk fat synthesis during the lactation cycle. BMC Genomics. 2008; 9:366.
45. Kliewer SA, Sundseth SS, Jones SA, Brown PJ, Wisely GB, Koble CS, Devchand P, Wahli W, Willson TM, Lenhard JM, Lehmann JM. Fatty acids and eicosanoids regulate gene expression through direct interactions with peroxisome proliferator-activated receptors α and γ. Proc Natl Acad Sci U S A. 1997; 94:4318–23.
46. Roberts-Thomson SJ, Snyderwine EG. Characterization of peroxisome proliferator-activated receptor alpha in normal rat mammary gland and 2-amino-l-methyl-6-phenylimidazo [4, 5-b] pyridine-induced mammary gland tumors from rats fed high and low fat diets. Toxicol Lett. 2000; 118:79–86.
47. Garcia MC, Lopez M, Gualillo O, Seoane LM, Diéguez C, Señarís RM. Hypothalamic levels of NPY, MCH, and prepro-orexin mRNA during pregnancy and lactation in the rat: role of prolactin. FASEB J. 2003; 17:1392–400.
48. Chen P, Smith MS. Regulation of hypothalamic neuropeptide Y messenger ribonucleic acid expression during lactation: role of prolactin. Endocrinology. 2004; 145:823–9.
49. Xu J, Kirigiti MA, Cowley MA, Smith MS. Suppression of basal spontaneous gonadotropin-releasing hormone neuronal activity during lactation: role of inhibitory effects of neuropeptide Y. Endocrinology. 2009; 150:333–40.
50. Li Z, Lan X, Guo W, Sun J, Huang Y, Wang J, Huang T, Lei C, Fang X, Chen H. Comparative transcriptome profiling of dairy goat microRNAs from dry period and peak lactation mammary gland tissues. PLoS One. 2012; 7:e52388.
51. Pei GF, Gao P, Li HN, Liang T, Wang F, Pan CY, Chen H, Lan XY. DNA methylation pattern of estrogen receptor alpha (ERα) gene promoter region and its influence on milk production performance in Xinong Saanen dairy goats. J Animl Plant Sci. 2015; 25:798–808.
52. Dong Y, Zhang X, Xie M, Arefnezhad B, Wang Z, Wang W, Feng S, Huang G, Guan R, Shen W, Bunch R, McCulloch R, Li Q, et al. Reference genome of wild goat (capra aegagrus) and sequencing of goat breeds provide insight into genic basis of goat domestication. BMC Genomics. 2015; 16:431.
53. Xiang H, Zhu J, Chen Q, Dai F, Li X, Li M, Zhang H, Zhang G, Li D, Dong Y, Zhao L, Lin Y, Cheng D, et al. Single base-resolution methylome of the silkworm reveals a sparse epigenomic map. Nat Biotechnol. 2010; 28:516–20.
54. Yuan XL, Zhang Z, Li B, Gao N, Zhang H, Sangild PT, Li JQ. Genome-wide DNA methylation analysis of the porcine hypothalamus-pituitary-ovary axis. Sci Rep 2017; 7:4277.