
INTRODUCTION
Nasopharyngeal carcinoma (NPC) is an endemic cancer, which is distributed predominantly through certain geographic areas and in particular racial/ethnic populations. In Southern China and Southeast Asia, especially among Cantonese men, the incidence rate of NPC is approximately 10 to 50 per 100,000 person-years; in addition, it also occurs sporadically in other parts of the world, including native populations in Canada, Greenland, Alaska, the Middle East and North Africa [1, 2]. The endemic nature, as well as carcinogenesis, of this disease are considered a consequence of Epstein-Barr virus (EBV) infection, together with environmental and host genetic factors. To date, the 5-year survival rate of locally advanced NPC patients can reach approximately 70% after primary treatment. However, the incidence rates of local-regional relapse and distant metastasis, both of which are the major risks of patient death, are still more than 20% [3-7] and the cause remains enigmatic.
EBV is a human γ-herpesvirus that infects more than 90% of the adult population worldwide. EBV is a causative agent of infectious mononucleosis and is highly associated with several human malignancies, including NPC. The etiological association of NPC with EBV infection has been strongly supported by various clinical and epidemiological studies. Viral DNA and lytic gene products such as early antigen diffuse (EA-D), early antigen restricted (EA-R), BZLF1, BRLF1, BMLF1, gp220, lytic latent membrane protein 1, DNase, membrane antigen, viral capsid antigen (VCA) and BALF1 may be detected in NPC biopsies [8-14]. Serological studies have reported that patients with NPC generally exhibit high levels of IgA antibodies against EBV EA and VCA [15-21] and elevated titers of neutralizing antibodies against EBV DNA replication-related enzymes such as DNase, DNA polymerase and thymidine kinase also are detectable in the sera of patients with this disease [21-28]. Moreover, the titers of these antibodies increase with the stage of NPC [16-18, 28] and patients with remission after effective therapy show a decline of the antibodies over time. However, a reversal to increasing titers is seen in long-term survivors with relapse or metastasis [16-18, 20, 23]. Therefore, these prospective and retrospective investigations suggest that the antibodies against EBV lytic antigens are indicative serological markers for the prognosis and diagnosis of NPC. Taking these observations together, EBV plays a critical role in the development of NPC.
Genomic instability is defined as an increase in the frequency of genetic alterations, ranging from the nucleotide to the chromosome level and including subtle sequence changes, chromosome number alterations, chromosome translocations and gene amplifications. This is an early event and leads to the emergence of the characteristics of cancer in the cells [29, 30]. In NPC biopsies, conventional cytogenetic analyses show tumor cells with the appearance of polyploidy, aneuploidy and marker chromosomes [31, 32]. High frequencies of loss of heterozygosity (LOH) are observed for chromosomes 1p, 2p, 2q, 3p, 3q, 5q, 9p, 9q, 11q, 13q, 14q and 17q [33-39]; moreover, a genome-wide analysis utilizing comparative genomic hybridization (CGH) identifies that gains of genomic copy number aberrations (CNAs) cluster on chromosomes 1p, 1q, 2q, 3q, 5q, 6p, 6q, 7p, 7q, 8p, 8q, 9q, 11q, 12p, 12q, 15q, 17q, 18q, 19p, 19q, 20p and 20q and losses are among 1p, 3p, 5q, 9p, 9q, 11q, 13q, 14q and 16q [40-44]. In addition, the extent of these alterations is correlated with NPC stage, relapse and metastasis [39, 40, 43]. Accordingly, genomic instability occurs comprehensively in NPC and contributes to tumor progression.
Previously, we found that the EBV latent gene product LMP1 and EBNA2 are capable of inducing genomic instability in epithelial cells [45-48]. However, in studies of the clinical features of NPC, NPC patients with high titers of antibodies against EBV EA and VCA have tumor cells with a high frequency of LOH [39, 49]. Elevation of antibodies against EBV lytic gene products is considered to be a sign of reactivation of EBV [50-53]. Therefore, we investigated the lytic induction of EBV in NPC cell lines and high frequencies of significant increases of micronuclei and DNA double-strand breaks, relative to latency, were revealed. With recurrent reactivation of EBV, the occurrence of micronuclei and structural chromosomal aberrations accumulate in the cells and frequent CNAs are produced predominantly on chromosomes 3, 7, 8, 9 and X [54, 55]. These results suggest that EBV reactivation could cause genomic instability in the host cells and is an underlying factor of NPC relapse. Furthermore, EBV DNase and BGLF4, lytic gene products, were shown to be able to elicit genomic instability [56, 57]. EBV BALF3 is expressed after EBV reactivation and is a terminase, which cleaves newly synthesized viral DNA and enables the translocation of unit length genomes into procapsids during the lytic cycle [58]. In addition, our preliminary screening suggests that BALF3 is involved in the induction of host genomic instability. In this study, we examined EBV BALF3 expressed by recurrent induction to explore its effects not only on host genomes but also its tumorigenic properties in NPC cells and a genome-wide analysis was used to determine the differentially expressed genes involved, including cancer capability-related genes and oncogenes.
RESULTS
Effect of EBV BALF3 on genomic instability.
To determine whether EBV BALF3 (NCBI GenBank accession no. AFY97901) can cause genomic instability in host cells, TW01 cells were transiently transfected with pEGFP-C1-BALF3 and were examined for the formation of micronuclei, which arise during mitosis from acentric chromosome fragments and lagging whole chromosomes and are used as a biomarker for chromosome breakage and loss [59, 60]. A representative immunoblot shows that increasing GFP-BALF3 expression was detected in a dose-dependent manner (Figure 1A) and the numbers of micronuclei correlated with the expression kinetics of BALF3, increasing by up to approximately 1.0, 1.9, 2.8, 3.3 and 4.3% with pEGFP-C1-BALF3 at doses of 0.05, 0.1, 0.2, 0.4 and 0.8 μg, respectively (Figure 1B). The phosphorylation of serine 139 in the C-terminal tail of the histone H2A variant, γH2AX, is initiated in chromatin by DNA double-strand breaks (DSBs) [61]. The cells expressing GFP-BALF3 exhibited more H2AX phosphorylation than the mock and pEGFP-C1 transfections, detected by immunofluorescence staining with an antibody specific to γH2AX (Figure 1G), suggesting that EBV BALF3 could induce DSBs. Moreover, a recent study in our laboratory has shown that alanine substitution of the glycine residue at amino acid 624 of EBV BALF3 results in reduced endonucleolytic activity [58]. Therefore, the coding region of BALF3 in pEGFP-C1-BALF3 was mutated by replacement of glycine 624 with alanine, with the result that the occurrence of micronuclei and H2AX phosphorylation induced by the G624A mutant was reduced to a significant extent, compared to the wild-type transfection (Figure 1C, D and G), confirming that EBV BALF3 could generate chromosome breakage and loss and DSBs. These results were also seen in an additional NPC cell line, HONE-1 (Figure 1E, F and G). According to these observations, EBV BALF3 is able to induce genomic instability in host cells.
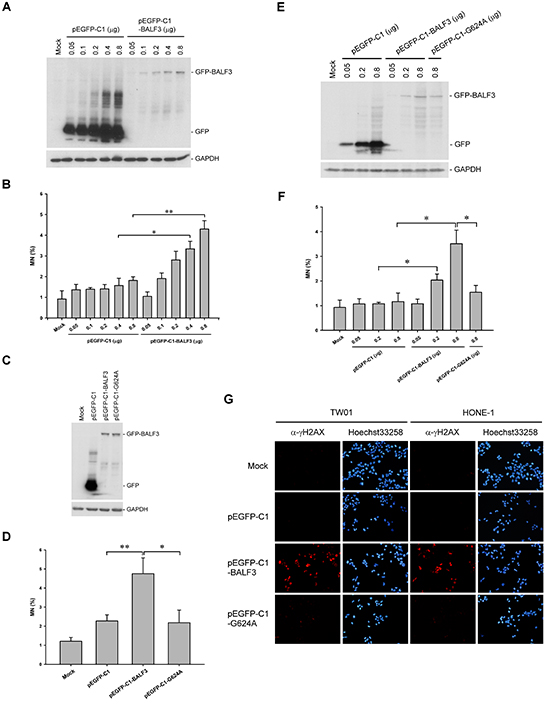
Figure 1: Induction of genomic instability in NPC cells with EBV BALF3 expression. TW01 cells were transiently transfected with the doses of pEGFP-C1 or pEGFP-C1-BALF3 indicated for 24 h, followed by western blotting with antibodies specific to GFP and GAPDH (A) and micronucleus assay (B). Data are presented as means ± standard deviations. Student’s t test was used to determine the difference between two groups. *, P < 0.05; **, P < 0.001. Mock, mock transfection; MN, micronucleus. (C and D) TW01 cells were transiently transfected with 0.8 μg pEGFP-C1, pEGFP-C1-BALF3 or pEGFP-C1-G624A for 24 h prior to western blotting and micronucleus assay. Data are presented as means ± standard deviations. Student’s t test was used to determine the difference between two groups. *, P < 0.05; **, P < 0.01. Mock, mock transfection; MN, micronucleus. (E and F) HONE-1 cells were transiently transfected with the doses of pEGFP-C1, pEGFP-C1-BALF3 or pEGFP-C1-G624A indicated for 24 h, following by western blotting and micronucleus assay. Data are presented as means ± standard deviations. Student’s t test was used to determine the difference between two groups. *, P < 0.05. Mock, mock transfection; MN, micronucleus. (G) TW01 and HONE-1 cells were transiently transfected with 0.8 μg pEGFP-C1, pEGFP-C1-BALF3 or pEGFP-C1-G624A for 24 h prior to indirect immunofluorescence staining with an antibody specific to γH2AX. The nuclei of the cells were stained with Hoechst33258. Mock, mock transfection.
For long-term expression experiments, we established an EBV BALF3-inducible NPC cell line, TW01TREx-BALF3, which harbors the BALF3 coding region with a V5 tag, the expression of this gene product being induced by DOX treatment. Comparing the physical properties of TW01TREx-VC and -BALF3 cells, TW01TREx-BALF3 cells showed more micronuclei and H2AX phosphorylation after induction and both of the DNA damage indicators were increased with DOX at concentrations from 0 to 50 ng/ml (Figure 2A and B). After more than two rounds of the host cell cycle, the accumulation of DNA damage was clear and the cell population with micronuclei increased to approximately 9.2% at 48 h post-induction in TW01TREx-BALF3 cells (Figure 2C and D). The combination of siBALF3-1 and -2 for gene silencing verified the specific effect of EBV BALF3 on DNA damage (Figure 2E and F). In addition, under DOX induction at the maximal concentration of 50 ng/ml, there was no obvious cytotoxicity in the cells up to 96 h post-induction (Figure 2G). Therefore, this inducible cell line provides further evidence supporting the effect of EBV BALF3 on genomic instability and is a tool for further long-term studies.
Accumulation of genomic instability after recurrent expression of EBV BALF3.
Because EBV reactivation may occur periodically prior to NPC relapse [62], the expression of EBV BALF3 was induced and recovered to a basal level repeatedly in TW01TREx-BALF3 cells, with DOX treatment and removal, to imitate the natural situation. The experimental protocol is illustrated in Figure 3A. DOX induction at a concentration of 5 ng/ml for 24 h led to BALF3 expression and the decrease followed removal of the inducer for a further 24 h, determining the procedure for recurrent EBV BALF3 expression in this study (Supplementary Figure S1). Following this protocol, recurrent induction was carried out over 15 passages and cells at passages 1, 5, 10 and 15 were harvested for further studies. The detection of micronuclei in TW01TREx-BALF3 cells after induction increased by up to approximately 3.7, 5.4, 6.0 and 6.5% for passages 1, 5, 10 and 15, respectively (Figure 3B). Similarly, micronucleus formation increased more in HONE-1 cells by five rounds of transfection of pEGFP-C1-BALF3 than the single transfection and the controls (Supplementary Figure S2). Furthermore, array CGH analysis was used for surveillance of CNAs on the host genome to investigate the effect of recurrent EBV BALF3 expression on genetic alterations. Here, this analysis was applied to TW01TREx-VC+DOX (P15) (TW01TREx-VC cells with DOX treatment harvested at passage 15), TW01TREx-BALF3 (P1), TW01TREx-BALF3 (P15), TW01TREx-BALF3+DOX (P1) and TW01TREx-BALF3+DOX (P15). Compared to TW01TREx-BALF3 (P1), a common reference, a clear increase of CNAs occurred in TW01TREx-BALF3+DOX (P15) and these were seen on chromosomes 1, 3, 4, 5, 6, 7, 8, 9, 11, 12, 15, 16, 18, 19, 22 and X; in contrast, relatively few CNAs were detected in TW01TREx-VC+DOX (P15), TW01TREx-BALF3 (P15) and TW01TREx-BALF3+DOX (P1) (Figure 3C). Data filtering of array CGH with high aberration scores, > 10 for amplification and < -10 for deletion, reveals high-level gains of altered loci in the TW01TREx-BALF3+DOX (P15) genome, located on chromosomes 3, 6, 11, 19, 22 and X, and losses were among chromosomes 1, 3, 4, 5, 6, 7, 8, 9, 11, 12, 15, 16, 18 and X, whereas TW01TREx-VC+DOX (P15), TW01TREx-BALF3 (P15) and TW01TREx-BALF3+DOX (P1) had no significant aberrations. These data are summarized in Table 1. In addition, there was no apparent CNA generation under DOX treatment, single induction of BALF3 expression and long-term cell culture. From the results of micronucleus assay coupled with array CGH analysis, EBV BALF3 with recurrent expression may be seen to play an important role in inducing aggravated genomic instability in the cells.
Contribution of EBV BALF3 to the tumorigenic properties of NPC cells.
Most cancers acquire a number of specific attributes during their development, including tissue invasion and metastasis [63]. To determine whether recurrent EBV BALF3 expression may lead to the malignant development of NPC cells, the repeatedly induced cell lines were analyzed for their tumorigenic phenotypes, including cell migration, cell invasion and spheroid formation. TW01TREx-BALF3 cells with DOX induction were subjected to cell migration and invasion assays and the percentage of closure increased by up to approximately 53.0, 56.7, 58.4 and 65.2% for passages 1, 5, 10 and 15, respectively, relative to the baseline of each group (Figure 4A and B). In addition, the average number of invading cells at passages 1, 5, 10 and 15 increased by up to approximately 649, 1032, 1180 and 1319, respectively (Figure 4C and D). Therefore, TW01TREx-BALF3 cells with DOX induction exhibit more migratory and invasive behavior than the TW01TREx-VC cell groups and cells with mock induction and there is a high correlation between these aggravated properties and the number of rounds of induction.
Most cells are present in three-dimensional structures in the human body and the formation of multicellular spheroids represents a tissue-like architecture and models the response to cell migration and invasion, as well as intercellular adhesion. Here, in a matrix of 0.7% agarose, TW01TREx-BALF3+DOX (P15) cells formed spheroids with a diameter of 264.2 μm, which was larger than those of TW01TREx-BALF3+DOX (P1), TW01TREx-VC+DOX (P1), TW01TREx-VC+DOX (P15) and the groups with mock induction (Figure 4E and F). Furthermore, the TW01TREx-BALF3+DOX (P15) cells were examined in a harder matrix, 1% agarose, and aggregated into a cluster, whereas the cells of the other groups were dispersed on the surface of the matrix (Figure 4E). These results suggest that the potential for intercellular adhesion, in addition to cell migration and invasion, was enhanced by recurrent EBV BALF3 expression.
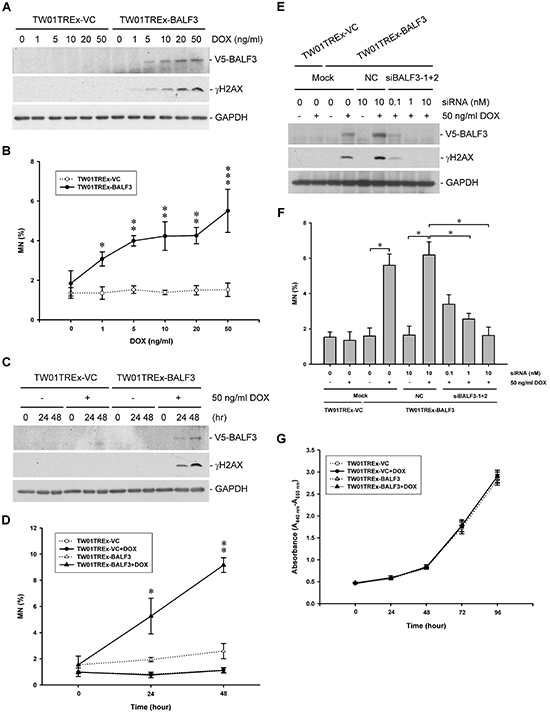
Figure 2: Effect of EBV BALF3 expression on genomic instability and growth of NPC cells. TW01TREx-VC and TW01TREx-BALF3 cells were treated with the concentrations of DOX indicated for 24 h and subjected to western blotting with antibodies specific to V5, γH2AX and GAPDH (A) and micronucleus assay (B). Data are presented as means ± standard deviations. Student’s t test was used to determine the difference between two groups. *, P < 0.05; **, P < 0.01; ***, P < 0.001, compared to TW01TREx-BALF3 cells without DOX treatment. DOX, doxycycline; MN, micronucleus. (C and D) TW01TREx-VC and TW01TREx-BALF3 cells were treated with 50 ng/ml DOX for 0, 24 and 48 h prior to western blotting and micronucleus assay. Data are presented as means ± standard deviations. Student’s t test was used to determine the difference between two groups. *, P < 0.05; **, P < 0.001, compared to TW01TREx-BALF3 cells at 0 h post-induction. DOX, doxycycline; MN, micronucleus. (E and F) TW01TREx-VC and TW01TREx-BALF3 cells were transiently transfected with 10 nM Negative Control Duplexes (NC) or the concentrations of siBALF3-1 and -2 indicated prior to 50 ng/ml DOX treatment for 24 h, followed by western blotting and micronucleus assay. Data are presented as means ± standard deviations. Student’s t test was used to determine the difference between two groups. *, P < 0.05. Mock, mock transfection; DOX, doxycycline; MN, micronucleus. (G) TW01TREx-VC and TW01TREx-BALF3 cells were treated with 50 ng/ml DOX for 0, 24, 48, 72 and 96 h and the numbers of viable cells were determined by WST-1 reagent. Data are presented as means ± standard deviations. DOX, doxycycline.
Table 1: Summary of array CGH data with high aberration scorea
Chr. (no. of altered loci) |
||
Cell group |
Amplification |
Deletion |
TW01TREx-VC+DOX (P15) |
ND |
ND |
TW01TREx-BALF3 (P15) |
ND |
ND |
TW01TREx-BALF3+DOX (P1) |
ND |
ND |
TW01TREx-BALF3+DOX (P15) |
3 (246), 6 (77), 11 (98), 19 (85), 22 (419), X (103) |
1 (512), 3 (125), 4 (173), 5 (537), 6 (221), 7 (467), 8 (353), 9 (80), 11 (172), 12 (638), 15 (550), 16 (15), 18 (43), X (363) |
Abbreviations: array CGH, array-based comparative genomic hybridization; Chr, chromosome; DOX, doxycycline; ND, not detected.
aThe group of TW01TREx-BALF3 (P1) was used as a common reference. The data of array CGH were filtered by high aberration scores as follows: > 10 for amplification; < -10 for deletion.
Based on the dramatically increased tumorigenic properties of NPC cells induced by recurrent EBV BALF3 expression observed above, the TW01TREx-VC+DOX, TW01TREx-BALF3 and TW01TREx-BALF3+DOX cells at passages 1 and 15 were injected subcutaneously into NOD/SCID mice to evaluate the effect of recurrent EBV BALF3 expression on tumor growth. Weekly monitoring of tumor growth revealed that tumors were formed by all of the cell groups and the size and weight of tumor nodules from TW01TREx-BALF3+DOX (P15) cells were up to approximately 2105.1 mm3 and 1523.3 mg, respectively, at week 6 post-inoculation and developed more actively than the other cell groups (Figure 5A to C). Therefore, highly recurrent induction of EBV BALF3 may contribute to the progressive malignancy of tumors.
Differential expression of cancer-related genes in NPC cells after recurrent EBV BALF3 expression.
To explore the changes in gene expression that result from repeated induction of EBV BALF3 expression, the various cell lines with repeated induction were analyzed using an RNA expression array. Using the criteria of absolute fold changes > 1.5 and P value < 0.05, the profile of TW01TREx-BALF3+DOX (P15) features 991 differentially expressed genes, including 428 overexpressed and 563 underexpressed genes, compared to TW01TREx-BALF3 (P1). The biological representation of these genes was unified by DAVID, a bioinformatics resource for functional annotation, and the terms of gene ontology set were related to capabilities for the characteristics of cancer, including cell adhesion, cell death, the immune system, cell migration, cell growth, vasculature development, precursor metabolites and energy generation, defense response, cell cycle, DNA repair and DNA damage response [63]. These sets included 172 altered genes (Supplementary Table S1). Furthermore, comparison of the RNA expression array and array CGH results revealed 62 genes which were differentially expressed in both. Among 62 altered genes, 16 were overexpressed and 46 were underexpressed and these are listed in Table S1 (Figure 6A and B). In addition, 5 oncogenes identified by NCBI (http://www.ncbi.nlm.nih.gov/gene) and in the relevant literature, EVI1, FIGF, PAK1, SOX2 and TP63 were overexpressed and present in the data sets of both arrays (Figure 6C). Therefore, recurrent expression of EBV BALF3 in NPC cells leads to differential expression of various cancer capability-related genes and oncogenes, which may be attributable to genetic aberrations.
DISCUSSION
The detection of antibodies against EBV antigens in the sera of NPC patients was reported as early as 1966 [64]. So far, numerous clinical tests have shown that patients with NPC have EBV lytic gene products and IgA antibodies against EBV lytic antigens in tumor biopsies and sera, respectively; in addition, NPC tissues contain the linear form of viral DNA, which is consistent with the detection of replicative RNAs [65, 66]. Moreover, the titers of IgA antibodies against EBV EA, VCA and DNase are lower in the sera of patients with other EBV-associated diseases, such as infectious mononucleosis, Burkitt’s lymphoma and Hodgkin’s lymphoma, than with NPC [16, 22, 67]. Accordingly, these findings indicate significant levels of EBV reactivation in NPC. Furthermore, NPC also shows various limited expression patterns of EBV lytic genes, which account for an incomplete process of virion production [11, 65], and no viral particles can be detected in tumor tissues, despite the expression of lytic gene products and the increased titers of anti-lytic antigen IgA antibodies [9, 10, 12, 68]. This suggests that an abortive lytic cycle may occur in NPC and may protect the cells from death, which could provide an environment for the occult influence of EBV reactivation on the cells.
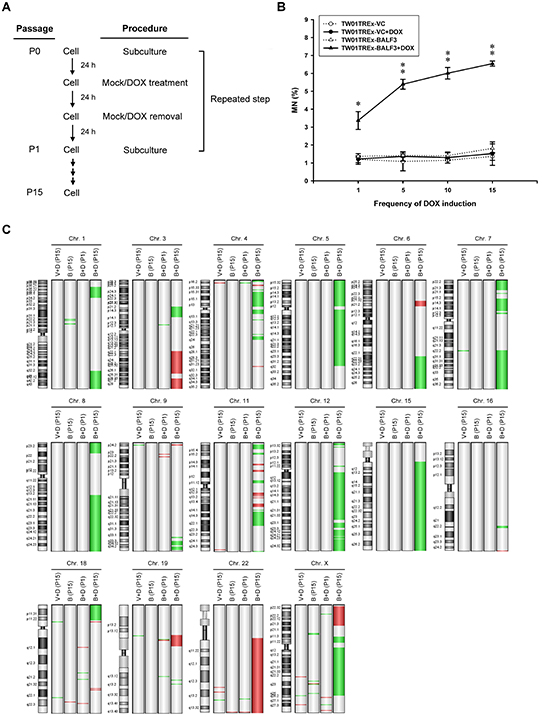
Figure 3: Accumulation of genomic instability in NPC cells after recurrent EBV BALF3 expression. (A) Representative illustration of recurrent EBV BALF3 expression in NPC cells. The recurrent EBV BALF3 expression protocol was as follows. Cells were seeded on a culture plate and incubated for 24 h, followed by mock treatment or treatment with 5 ng/ml DOX for 24 h. After incubation, the culture medium was replaced and incubated for 24 h prior to cell subculture for the next round. These above procedures were defined as one passage (P) and repeated. The cycle was carried out up to 15 rounds. Mock, mock treatment; DOX, doxycycline; P, passage. (B) The cells were harvested at passages 1, 5, 10 and 15 and subjected to micronucleus assay. Data are presented as means ± standard deviations. Student’s t test was used to determine the difference between two groups. *, P < 0.05; **, P < 0.01, compared to TW01TREx-BALF3 cells without DOX treatment. DOX, doxycycline; MN, micronucleus. (C) The genomic DNA of cells at passages 1 and 15 were extracted and subjected to array CGH and TW01TREx-BALF3 (P1) was used as a common reference. Images were produced by Agilent Genomic Workbench version 7.0.4.0. The location of amplifications and deletions of each group was displayed to the right side of the graph of a chromosome with cytobands. Red and green colors indicate amplification and deletion, respectively. V+D, TW01TREx-VC+DOX; B, TW01TREx-BALF3; B+D, TW01TREx-BALF3+DOX; DOX, doxycycline; P, passage; Chr, chromosome.
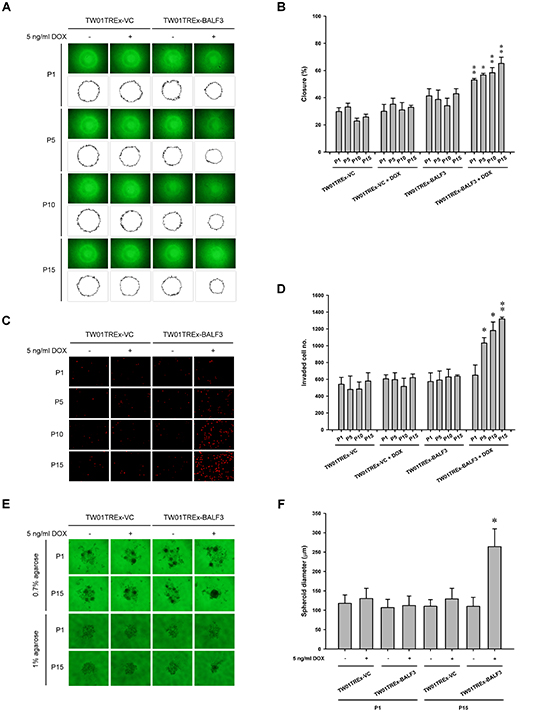
Figure 4: Examination of cell migration and invasion and spheroid formation by NPC cells after recurrent EBV BALF3 expression. Treatment of TW01TREx-VC and TW01TREx-BALF3 cells was performed according to recurrent EBV BALF3 expression protocol. (A) The cells were harvested at passages 1, 5, 10 and 15 and subjected to cell migration assay for 12 h incubation. The area of a cell-free zone was measured by ImageJ. (B) Cell migration was determined as percent closure and calculated as described in Materials and Methods. Data are presented as means ± standard deviations. Student’s t test was used to determine the difference between two groups. *, P < 0.01; **, P < 0.001, compared to TW01TREx-BALF3 cells without DOX treatment. DOX, doxycycline; P, passage. (C) The cells were harvested at passages 1, 5, 10 and 15 and subjected to cell invasion assay for 12 h incubation and the invaded cells were visualized using propidium iodide staining. (D) The numbers of invaded cells were counted and the data are presented as means ± standard deviations. Student’s t test was used to determine the difference between two groups. *, P < 0.01; **, P < 0.001, compared to TW01TREx-BALF3 cells without DOX treatment. DOX, doxycycline; P, passage. (E) The cells were harvested at passages 1 and 15 and subjected to spheroid assay with 0.7 or 1% agarose matrix for 21 days incubation. (F) The diameter of spheroids was measured from images of 0.7% agarose group. Data are presented as means ± standard deviations. Student’s t test was used to determine the difference between two groups. *, P < 0.001, compared to TW01TREx-BALF3 cells without DOX treatment at passage 15. DOX, doxycycline; P, passage.
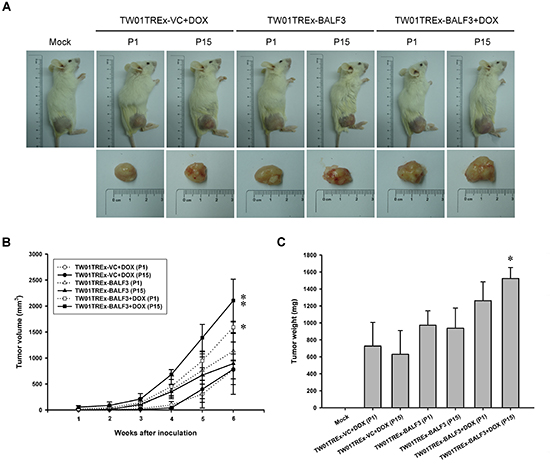
Figure 5: Examination of in vivo tumor growth after recurrent EBV BALF3 expression. Treatment of TW01TREx-VC and TW01TREx-BALF3 cells was performed according to the recurrent EBV BALF3 expression protocol. The cells at passages 1 and 15 were injected subcutaneously into NOD/SCID mice and four animals per group were studied and observed for 6 weeks. (A) Sacrificed mice and tumor nodules after excision were photographed at week 6. Mock, mock inoculation; DOX, doxycycline; P, passage. (B) The tumor size was measured weekly by callipers and calculated as described in Materials and Methods. Data are presented as means ± standard deviations. Student’s t test was used to determine the difference between two groups. *, P < 0.05; **, P < 0.01, compared to TW01TREx-BALF3 cells without DOX treatment. DOX, doxycycline; P, passage. (C) The tumor nodules were weighed after excision from mice sacrificed at week 6. Data are presented as means ± standard deviations. Student’s t test was used to determine the difference between two groups. *, P < 0.01, compared to TW01TREx-BALF3 cells without DOX treatment at passage 15. Mock, mock inoculation; DOX, doxycycline; P, passage.
EBV BALF3 is required for viral DNA cleavage and packaging during the lytic cycle. To investigate the effect of BALF3 on uninfected cells, BALF3 was expressed alone in NPC cells and these were examined for genetic alterations using several methods, showing that the BALF3 expression led to the induction of micronuclei, DNA strand breaks and genomic CNAs (Figure 1, 2 and 3). BALF3 has nuclease activity and the BALF3-mediated nucleolytic reaction occurs not only in the terminal repeats of the EBV genome, which contain cleavage/packaging signals, but also in vitro in plasmid DNA without the terminal repeat sequence [58]. Similarly, nonspecific cleavage also has been reported for the terminases of human cytomegalovirus (HCMV) and bacteriophage T4. HCMV UL56 can cleave plasmid DNA in vitro in the absence of the a sequence and bacteriophage T4 gp17 carries out random cleavage of the Escherichia coli genomic DNA in vivo [69, 70]. In addition, Figure 1D, F and G reveal that a mutation within the putative ATP-binding motif of BALF3, which is responsible for nuclease activity [58], significantly reduced the numbers of micronuclei and phosphorylation of H2AX detected following wild-type BALF3 expression. On this basis, the genetic alterations of cells caused by EBV BALF3 may be attributed to its nuclease activity.
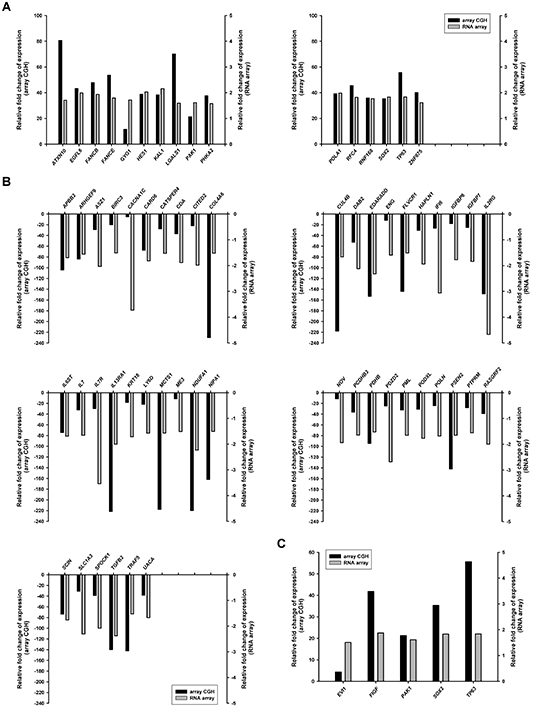
Figure 6: Differentially expressed genes in NPC cells after recurrent EBV BALF3 expression. Treatment of TW01TREx-BALF3 cells was performed according to the recurrent EBV BALF3 expression protocol. The cells were subjected to array CGH and RNA expression array and TW01TREx-BALF3+DOX (P15) was compared to TW01TREx-BALF3 (P1). Genes shown in this figure were present in and cross-validated by data of array CGH and RNA array. The overexpressed (A) and underexpressed (B) cancer capability-related genes in Table S1 and the oncogenes (C) were common in both sets of array results.
Phosphorylated H2AX is a mediator in response to DNA damage, which recruits DNA repair proteins at the chromatin lesion to carry out repair, and it has been reported to be associated with numerous cancers, including oral squamous cell, esophageal, breast, non-small cell lung, gastric, bladder, colorectal carcinoma, as well as NPC [71-79], suggesting that DNA damage occurs and may play a role in the development of cancers although this correlation remains to be understood. Previously, EBV infection was found to induce H2AX phosphorylation in NPC cells through its reactivation [55]. In this study, NPC cells exhibited γH2AX by expression of EBV lytic gene product BALF3 and aggravated genomic instability upon recurrent BALF3 expression. In addition, cancer is considered a consequence of accumulation of molecular damage via multiple replication and selection events [80], suggesting that the progressive tumorigenic features in NPC cells may be due to accumulation of non-random genomic instability induced by BALF3. Moreover, although BALF3 triggered the DNA damage response (DDR), phosphorylation of H2AX, no conspicuous cytotoxicity and inhibition of cell proliferation were shown in host cells in the long-term experiments. Regarding DDR, γH2AX is not only a biomarker for DNA damage but also the induction of senescence and mTOR overactivation, which is defined as pseudo-DDR [81]. The atypical DDR is induced by various stimuli, such as senescence and DNA replication stress, which can be suppressed by blockage of mTOR activity [81-83]. Furthermore, combination of activation of the mTOR pathway and avoidance of cell cycle arrest account for carcinogenesis [80]. In NPC cell lines and tissues, factors involved in the mTOR pathway, such as PI3K and AKT, are commonly activated [84-87] and mTOR inhibitors are validated and evaluated for clinical therapies [88-91]. Accordingly, it is also a possibility that activation of the mTOR pathway might take place in NPC cells after BALF3 expression, in addition to low-dose DNA damage, which lead to tumor progression.
Fluctuations of anti-EBV VCA IgA antibody titers can be seen in healthy individuals and these increase before the onset of NPC, as well as in patients with relapse of NPC [62, 92, 93], revealing that EBV reactivation occurs periodically in nasopharyngeal epithelial tissues. To imitate the reactivation of EBV in nature, in our previous study, NPC cell lines bearing the EBV genome were treated with 12-O-tetradecanoylphorbol-13-acetate (TPA) and sodium butyrate (SB), known inducers of the EBV lytic cycle, through repeated cycles of lytic induction and recovery, resulting in remarkable genomic instability and tumorigenic phenotypes of NPC cells [55]. Thus, in this study, the recurrent expression protocol (Figure 3A) for examining EBV BALF3 in NPC cells was designed in accordance with the natural process and our previous study. Moreover, in the long-term experiments, the expression of BALF3 in TW01TREx-BALF3 cells was induced by DOX at a concentration of 5 ng/ml. At this concentration of DOX, the level of BALF3 mRNA was up to approximately 30.2% of the maximal BALF3 level in the EBV-positive NPC cell line, NA cells, treated with 40 ng/ml TPA and 3 mM SB for 36 h, as determined by a quantitative reverse transcription-PCR analysis (data not shown). This indicates that a lower level of BALF3 expression was examined in this study and this may represent early or incomplete viral reactivation. This led to dramatic effects on the cells but did not generate apparent cytotoxicity detectable by observations of cell growth and ordinary cell culture under these conditions. On the other hand, comparing the effects of recurrent EBV BALF3 expression and EBV reactivation induced repeatedly by 40 ng/ml TPA and 3 mM SB on NPC cells [55], the effect of whole virus expression gives a greater degree of genomic instability and tumorigenic phenotypes than expression of BALF3 alone, suggesting that the induced expression of EBV BALF3 in this study at lower levels, as discussed above, or EBV BALF3 might cooperate with other viral gene products in the EBV-mediated promotion of NPC relapse.
The malignant features of NPC progressed with recurrent expression of EBV BALF3 and the various differentially expressed cancer-related genes identified above may be involved in this progressive development. The gene expression profile acquired by RNA expression array analysis includes 172 altered genes associated with the features of cancer and 62 of these genes were consistent with the results of array CGH, excluding their expression levels relative to the control (Supplementary Table S1 and Figure 6A and B) and implying that some indirect contributory factors might be involved in the regulation of gene expression, such as mutation within a regulatory region, RNA and protein stability and chromosome aberrations. We also identified 5 overexpressed oncogenes in both arrays, EVI1, FIGF, PAK1, SOX2 and TP63 (Figure 6C). EVI1, ecotropic viral integration site 1 [94], is a transcription factor that regulates hematopoietic differentiation, cell proliferation and cell death and is highly expressed in myeloid leukemia and epithelial cancers. FIGF, c-fos induced growth factor, or called vascular endothelial growth factor D [95, 96] is a secreted glycoprotein that activates VEGF receptor (VEGFR)-2 and -3 on the surface of epithelial cells to drive the formation of blood vessels and lymphatics. PAK1, p21-activated kinase 1 [97], is a downstream effector of GTP-bound Rho GTPase Cdc42 and Rac, activation of which stimulates cytoskeletal reorganization, cell survival, cell proliferation, cell migration and anti-apoptosis. SOX2, sex determining region Y-box 2 [98], is a transcription factor that modulates the pluripotency and self-renewal of embryonic stem cells and the early development of tissues, as well as the cell proliferation, cell invasion and apoptosis of several solid tumors. TP63, tumor protein p63 [99], functions as a transcription factor to regulate p53 target genes and is associated with the cell cycle, DNA damage repair and apoptosis in epithelial cancers. Among these oncogenes, EVI1, FIGF, SOX2 and TP63 have been reported in and are correlated with NPC [100-103], suggesting that EBV BALF3 enhances their expression in the process of NPC relapse. Thus, PAK1 is also believed to be a potential biomarker for diagnosis of NPC although this remains to be confirmed.
Although EBV infection has been known for many years to be closely associated with NPC, how EBV contributes to NPC carcinogenesis remains to be elucidated. It has been suggested that latent EBV may participate in the carcinogenesis of NPC via high-grade preinvasive lesions of nasopharyngeal cells [104]. Moreover, we have shown that the EBV latent gene product LMP1 and EBNA2 induce genomic instability in epithelial cells [45, 48]. Considering that almost 100% of people living in NPC high-risk regions carry latent EBV, but only a few individuals develop NPC, latent infection seems not to be the only scenario. Retrospective, cross-sectional and prospective studies indicate that individuals with high levels of antibodies against EBV lytic antigens, markers of EBV reactivation, tend to have a higher risk of developing NPC [19, 21, 23, 25, 92, 93, 105, 106], suggesting that the EBV lytic cycle also may play an important role in the carcinogenesis of NPC. Furthermore, the presence of LOH can be detected in histologically normal nasopharyngeal epithelia and the cases increase dramatically in the population of NPC patients whether in high or low-risk regions [107, 108]. In addition, the titers of IgA antibodies against EBV lytic antigens increase prior to the development of NPC [19-21, 25, 28, 93, 109], implying that genomic instability emerges at an earlier time and contributes to the initiation of NPC, in which EBV reactivation is involved. Thus, we compared the effects of latency and the lytic cycle of EBV on the genomic instability of NPC cells and found that recurrent reactivation of EBV gives rise to a profound enhancement of the tumorigenic properties of the cells, in addition to promoting genomic instability [55]. Among the EBV lytic gene products, we have shown that EBV DNase and BGLF4 are able to induce genomic instability in NPC cells [56, 57]. We provide evidence here that BALF3 is another EBV lytic gene product contributing effectively to the induction of genomic instability and the consequent tumorigenicity of NPC cells. Therefore, the findings of this study might be applied to the elucidation of NPC carcinogenesis. Because blocking BALF3 retards the replication of EBV [58], it is possible that EBV BALF3 is as another target for preventing the development of NPC.
MATERIALS AND METHODS
Cell lines
NPC-TW01 (TW01) and HONE-1 are human nasopharyngeal carcinoma cell lines, derived from the tumor of a Taiwanese patient and a Chinese patient, respectively, which have lost the EBV genome [110, 111]. TW01 and HONE-1 cells were cultured in Dulbecco’s modified Eagle’s medium (Thermo Fisher Scientific) supplemented with 10% fetal bovine serum (Biological Industries) and incubated at 37°C and 5% CO2. TW01TREx-VC and TW01TREx-BALF3 cells were established from TW01TREx cells, TW01 cells express stably the tetracycline repressor, transfected with pLenti4 (Invitrogen) and pLenti4-BALF3, respectively, and selected by 25 μg/ml blasticidin (Sigma-Aldrich) and 500 μg/ml zeocin (Invitrogen). TW01TREx-VC and TW01TREx-BALF3 cells are TW01TREx cells harboring pLenti4 and pLenti4-BALF3, respectively, and were cultured in Dulbecco’s modified Eagle’s medium supplemented with 10% tetracycline-free fetal bovine serum (Invitrogen) and incubated at 37°C and 5% CO2. In addition, the selected clones were maintained by supplementation with 12.5 μg/ml blasticidin and 250 μg/ml zeocin. For the induction of BALF3 expression, TW01TREx-BALF3 cells were treated with doxycycline (DOX) (Sigma-Aldrich).
Transfection
Cells were transfected with plasmids or small interfering RNAs (siRNAs) using transfection agents according to the manufacturer’s instructions (Invitrogen). Briefly, for the expression of EBV BALF3 in TW01 cells, the cells were transfected with the indicated concentration of pEGFP-C1 (Clontech Laboratories) or pEGFP-C1-BALF3 using Lipofectamine 2000 (Invitrogen) at 37°C for 4 h and the culture medium was refreshed prior to incubation at 37°C for 24 h. For the establishment of Tet-regulated BALF3 inducible cell lines, TW01TREx cells were transfected with 3 μg pLenti4 or pLenti4-BALF3 using Lipofectamine 2000 at 37°C for 4 h and the culture medium was refreshed, followed by overnight incubation at 37°C and antibiotic selection. For the knockdown of EBV BALF3, TW01TREx-BALF3 cells were transfected with the indicated concentration of Stealth RNAi siRNA specific to BALF3 or Negative Control Duplexes (Invitrogen) by siPORT NeoFX (Invitrogen) at 37°C for 24 h and then treated with DOX for 24 h after replacement of fresh culture medium. The siBALF3s used in this study were siBALF3-1 (5’-CACUGGCAUCUAGCCAGCAAAUUCU-3’) and siBALF3-2 (5’-GCCGCCUUUGAGAAUUCCAAGUACA-3’).
Western blotting
Cell extracts were harvested by radioimmunoprecipitation (RIPA) buffer (50 mM Tris [pH7.5], 150 mM NaCl, 0.1% SDS, 10 mM EDTA, 1% Igepal CA-630 and protease inhibitor cocktail [Roche Applied Science]) for 20 min on ice and then centrifuged at 15,000 × g for 10 min at 4°C to collect the supernatants. The lysates were mixed with bromophenol blue buffer and then heated at 95°C for 5 min. The samples were separated by sodium dodecyl sulfate-polyacrylamide gel electrophoresis (SDS-PAGE) at 100 V and then transferred onto a nitrocellulose membrane (GE Healthcare) at 300 mA for 90 min in a cold room. The membrane was soaked in 5% skim milk at room temperature for 1 h. After blocking, the membrane was incubated with primary antibodies specific to green fluorescent protein (GFP) (Clontech Laboratories), V5 (Invitrogen), γH2AX (Cell Signaling) and glyceraldehyde-3-phosphate dehydrogenase (GAPDH) (Biodesign) at 4°C overnight prior to horseradish peroxidase-conjugated goat anti-mouse IgG (Jackson ImmunoResearch Laboratory) at room temperature for 1 h. The signal was detected by development with an enhanced chemiluminescence substrate (PerkinElmer) and exposure to X-ray film (Fujifilm).
Micronucleus assay
Micronucleus assay was carried out as described previously [55] with some modifications. Slide-cultured cells were fixed in 4% paraformaldehyde at room temperature for 20 min and then permeabilized in 0.1% Triton X-100 at room temperature for 5 min. DNA was stained with Hoechst33258 (Sigma-Aldrich) at room temperature for 30 s and the slides were covered with a mounting medium (Vector Laboratories). For the evaluation of micronucleus occurrence, more than 1 × 10³ fixed cells were examined and photographed using a fluorescence microscope (Olympus) and the data were expressed as percentages.
Indirect immunofluorescence staining
Slide-cultured cells were fixed in 4% paraformaldehyde at room temperature for 20 min and then permeabilized in 0.1% Triton X-100 at room temperature for 5 min. The fixed and permeabilized cells were blocked in 4% fetal bovine serum at room temperature for 30 min and incubated with the anti-γH2AX antibody (Upstate) at room temperature for 1 h prior to the incubation of Rhodamine Red-X-labeled goat anti-mouse IgG (Jackson ImmunoResearch Laboratory) at room temperature for another 1 h. DNA was stained with Hoechst33258 at room temperature for 30 s. The slides were covered with mounting medium and photographed using a fluorescence microscope.
Cell proliferation assay
Cells were seeded onto 96-well plates at 1 × 10³ cells/well and incubated at 37°C and 5% CO2 for 0, 24, 48, 72 and 96 h. After incubation, WST-1 reagent (Roche) was added to the culture medium and incubated for 2 h. The dye solution produced by metabolically active cells was quantified by an ELISA reader (Tecan) with absorbance at 440 and 650 nm.
Recurrent expression of EBV BALF3
TW01TREx-VC and -BALF3 cells were seeded and treated with 5 ng/ml DOX at 37°C and 5% CO2 for 24 h and then the culture medium was refreshed prior to incubation for another 24 h, which is defined as one passage (P). After incubation, the cells were trypsinized and reseeded for the next passage. In this study, the periodic induction was performed up to 15 passages and the cells were used for further studies.
Array-based comparative genomic hybridization (array CGH)
Array CGH was carried out according to the manufacturer’s instructions (Agilent Technologies). Briefly, genomic DNA was purified using a DNeasy Tissue Kit (Qiagen) and subjected to SurePrint G3 Human CGH Microarray Kit 1×1M and TW01TREx-BALF3 without DOX treatment at passage 1 was used as the common reference in this study. Following hybridization and washing steps, the array slides were scanned and features were obtained by Feature Extraction (Agilent Technologies). The extracted features were subsequently analyzed by Agilent Genomic Workbench version 7.0.4.0 (Agilent Technologies). The enrichment of aberrant regions was determined using the Z-score detection algorithm with a moving average window of 5 Mb and the threshold of algorithm was set to a value of 2.5 to generate aberration calls for each altered locus [54].
Cell migration assay
Cell migration assay was carried out according to the manufacturer’s instructions (Platypus Technologies). Briefly, cells were seeded onto 96-well plates containing Oris stoppers and incubated at 37°C and 5% CO2 overnight. After incubation, the stoppers were removed and the cells were incubated for 12 h to permit cell migration. The images were photographed by a optical microscope (Olympus). The area of a cell-free zone was measured by ImageJ (National Institutes of Health) and cell migration was presented as percent closure, which was calculated using the following formula: [(pre-migration)area— (migration)area/(pre-migration)area] × 100.
Cell invasion assay
Cell invasion assay was carried out as described previously [55] with some modifications. Briefly, the membranes of HTS FluoroBlok inserts (BD Biosciences) were coated with Matrigel Basement Membrane Matrix (BD Biosciences) and cells were resuspended in 2% tetracycline-free fetal bovine serum-containing DMEM and loaded into the upper chambers, which were placed in 24-well plates with 10% tetracycline-free fetal bovine serum-containing DMEM, and then incubated at 37°C and 5% CO2 for 12 h. After incubation, the cells on the membrane were fixed with methanol at 4°C for 15 min and stained with 5 μg/ml propidium iodide (Sigma-Aldrich) at room temperature for 10 min. The signal was detected and photographed using a fluorescence microscope to count the number of invaded cells.
Spheroid assay
Cells were seeded onto 0.7% or 1% agarose-coating 96 well plates and incubated at 37°C and 5% CO2 for 21 days. After incubation, the images were photographed using an optical microscope.
In vivo tumorigenesis assay
All animal experiments in this study were carried out according to the Guide for the Care and Use of Laboratory Animals of the National Institutes of Health. Seven-week-old non-obese diabetic/severe combined immunodeficiency (NOD/SCID) female mice were used in this study and 2 × 10⁶ cells were resuspended in serum-free DMEM and injected subcutaneously into the right dorsal flank. The mice were monitored weekly and tumor size was measured using callipers. The tumor volume was estimated using the following formula: volume = length × width2 × 0.52. Sacrifices were performed at week 6 and the tumors were removed and weighed.
RNA expression analysis
RNA expression analysis was carried out according to the manufacturer’s instructions (Affymetrix). Briefly, RNA was purified by RNeasy Mini Kit (Qiagen) and single-stranded cDNA was generated using a WT cDNA Synthesis Kit (Affymetrix) and then fragmented and labeled with WT Terminal Labeling Kit (Affymetrix). The samples were hybridized with GeneChip Human Gene 2.0 ST Array and scanned with a GeneChip scanner 3000 7G (Affymetrix). Raw data were processed with Partek Genomics Suite 6.6 (Partek) for normalization and gene level analysis. Gene ontology was determined using the Database for Annotation, Visualization and Integrated Discovery (DAVID; http://david.abcc.ncifcrf.gov) [112, 113].
ACKNOWLEDGEMENTS
We thank Dr. Tim J. Harrison of the University College London for critical reading and editing of the manuscript. We are grateful to Dr. Su-Fang Lin of the National Health Research Institutes for providing TW01TREx cell line and Dr. Shin-Lian Doong of the National Taiwan University for technical assistance and also acknowledge the technical services provided by Microarray & Gene Expression Analysis Core Facility of the National Yang-Ming University VGH Genome Research Center and Core Instrument Center of the National Health Research Institutes.
This work was supported by grants from the Ministry of Science and Technology (NSC96-3112-B-400-010, NSC97-3112-B-400-007, NSC98-3112-B-400-002, NSC99-3112-B-400-009, NSC101-2325-B-400-023, NSC102-2325-B-400-021 and MOST103-2325-B-400-008) and the National Health Research Institutes (CA-096-PP-24, CA-097-PP-18, CA-098-PP-13, CA-099-PP-13, CA-100-PP-18, CA-101-PP-18, CA-102-PP-19 and CA-103-PP-19), Taiwan.
REFERENCES
1. Yu MC and Yuan JM. Epidemiology of nasopharyngeal carcinoma. Semin Cancer Biol. 2002; 12:6. 421–429.
2. Chang ET and Adami HO. The enigmatic epidemiology of nasopharyngeal carcinoma. Cancer Epidemiol Biomarkers Prev. 2006; 15:10. 1765–1777.
3. Lin JC, Jan JS, Hsu CY, Liang WM, Jiang RS and Wang WY. Phase III study of concurrent chemoradiotherapy versus radiotherapy alone for advanced nasopharyngeal carcinoma: positive effect on overall and progression-free survival. J Clin Oncol. 2003; 21:4. 631–637.
4. Chua DT, Ma J, Sham JS, Mai HQ, Choy DT, Hong MH, Lu TX and Min HQ. Long-term survival after cisplatin-based induction chemotherapy and radiotherapy for nasopharyngeal carcinoma: a pooled data analysis of two phase III trials. J Clin Oncol. 2005; 23:6. 1118–1124.
5. Lee AW, Sze WM, Au JS, Leung SF, Leung TW, Chua DT, Zee BC, Law SC, Teo PM, Tung SY, Kwong DL and Lau WH. Treatment results for nasopharyngeal carcinoma in the modern era: the Hong Kong experience. Int J Radiat Oncol Biol Phys. 2005; 61:4. 1107–1116.
6. Xiao WW, Huang SM, Han F, Wu SX, Lu LX, Lin CG, Deng XW, Lu TX, Cui NJ and Zhao C. Local control, survival, and late toxicities of locally advanced nasopharyngeal carcinoma treated by simultaneous modulated accelerated radiotherapy combined with cisplatin concurrent chemotherapy: long-term results of a phase 2 study. Cancer. 2011; 117:9. 1874–1883.
7. Ng WT, Lee MC, Hung WM, Choi CW, Lee KC, Chan OS and Lee AW. Clinical outcomes and patterns of failure after intensity-modulated radiotherapy for nasopharyngeal carcinoma. Int J Radiat Oncol Biol Phys. 2011; 79:2. 420–428.
8. Wolf H, zur Hausen H and Becker V. EB viral genomes in epithelial nasopharyngeal carcinoma cells. Nat New Biol. 1973; 244:138. 245–247.
9. Luka J, Deeb ZE, Hartmann DP, Jenson B and Pearson GR. Detection of antigens associated with Epstein-Barr virus replication in extracts from biopsy specimens of nasopharyngeal carcinomas. J Natl Cancer Inst. 1988; 80:14. 1164–1167.
10. Cochet C, Martel-Renoir D, Grunewald V, Bosq J, Cochet G, Schwaab G, Bernaudin JF and Joab I. Expression of the Epstein-Barr virus immediate early gene, BZLF1, in nasopharyngeal carcinoma tumor cells. Virology. 1993; 197:1. 358–365.
11. Martel-Renoir D, Grunewald V, Touitou R, Schwaab G and Joab I. Qualitative analysis of the expression of Epstein-Barr virus lytic genes in nasopharyngeal carcinoma biopsies. J Gen Virol.. 1995; 76:1401–1408.
12. Sbih-Lammali F, Berger F, Busson P and Ooka T. Expression of the DNase encoded by the BGLF5 gene of Epstein-Barr virus in nasopharyngeal carcinoma epithelial cells. Virology. 1996; 222:1. 64–74.
13. Zhang JX, Chen HL, Zong YS, Chan KH, Nicholls J, Middeldorp JM, Sham JS, Griffin BE and Ng MH. Epstein-Barr virus expression within keratinizing nasopharyngeal carcinoma. J Med Virol. 1998; 55:3. 227–233.
14. Cabras G, Decaussin G, Zeng Y, Djennaoui D, Melouli H, Broully P, Bouguermouh AM and Ooka T. Epstein-Barr virus encoded BALF1 gene is transcribed in Burkitt's lymphoma cell lines and in nasopharyngeal carcinoma's biopsies. J Clin Virol. 2005; 34:1. 26–34.
15. de-The G, Ho JH, Ablashi DV, Day NE, Macario AJ, Martin-Berthelon MC, Pearson G and Sohier R. Nasopharyngeal carcinoma. IX. Antibodies to EBNA and correlation with response to other EBV antigens in Chinese patients. Int J Cancer. 1975; 16:5. 713–721.
16. Henle G and Henle W. Epstein-Barr virus-specific IgA serum antibodies as an outstanding feature of nasopharyngeal carcinoma. Int J Cancer. 1976; 17:1. 1–7.
17. Henle W, Ho JH, Henle G, Chau JC and Kwan HC. Nasopharyngeal carcinoma: significance of changes in Epstein-Barr virus-related antibody patterns following therapy. Int J Cancer. 1977; 20:5. 663–672.
18. Ho HC, Ng MH and Kwan HC. Factors affecting serum IgA antibody to Epstein-Barr viral capsid antigens in nasopharyngeal carcinoma. Br J Cancer. 1978; 37:3. 356–362.
19. Zeng Y, Zhang LG, Wu YC, Huang YS, Huang NQ, Li JY, Wang YB, Jiang MK, Fang Z and Meng NN. Prospective studies on nasopharyngeal carcinoma in Epstein-Barr virus IgA/VCA antibody-positive persons in Wuzhou City, China. Int J Cancer. 1985; 36:5. 545–547.
20. de-Vathaire F, Sancho-Garnier H, de-The H, Pieddeloup C, Schwaab G, Ho JH, Ellouz R, Micheau C, Cammoun M, Cachin Y and et al. Prognostic value of EBV markers in the clinical management of nasopharyngeal carcinoma (NPC): a multicenter follow-up study. Int J Cancer. 1988; 42:2. 176–181.
21. Chien YC, Chen JY, Liu MY, Yang HI, Hsu MM, Chen CJ and Yang CS. Serologic markers of Epstein-Barr virus infection and nasopharyngeal carcinoma in Taiwanese men. N Engl J Med. 2001; 345:26. 1877–1882.
22. Cheng YC, Chen JY, Glaser R and Henle W. Frequency and levels of antibodies to Epstein-Barr virus-specific DNase are elevated in patients with nasopharyngeal carcinoma. Proc Natl Acad Sci USA. 1980; 77:10. 6162–6165.
23. Chen JY, Hwang LY, Beasley RP, Chien CS and Yang CS. Antibody response to Epstein-Barr-virus-specific DNase in 13 patients with nasopharyngeal carcinoma in Taiwan: a retrospective study. J Med Virol. 1985; 16:2. 99–105.
24. Chen JY, Chen CJ, Liu MY, Cho SM, Hsu MM, Lynn TC, Shieh T, Tu SM, Lee HH, Kuo SL and et al. Antibodies to Epstein-Barr virus-specific DNase in patients with nasopharyngeal carcinoma and control groups. J Med Virol. 1987; 23:1. 11–21.
25. Chen JY, Chen CJ, Liu MY, Cho SM, Hsu MM, Lynn TC, Shieh T, Tu SM, Beasley RP, Hwang LY and et al. Antibody to Epstein-Barr virus-specific DNase as a marker for field survey of patients with nasopharyngeal carcinoma in Taiwan. J Med Virol. 1989; 27:4. 269–273.
26. Liu MY, Chou WH, Nutter L, Hsu MM, Chen JY and Yang CS. Antibody against Epstein-Barr virus DNA polymerase activity in sera of patients with nasopharyngeal carcinoma. J Med Virol. 1989; 28:2. 101–105.
27. de Turenne-Tessier M, Ooka T, Calender A, de-The G and Daillie J. Relationship between nasopharyngeal carcinoma and high antibody titers to Epstein-Barr virus-specific thymidine kinase. Int J Cancer. 1989; 43:1. 45–48.
28. Liu MY, Chang YL, Ma J, Yang HL, Hsu MM, Chen CJ, Chen JY and Yang CS. Evaluation of multiple antibodies to Epstein-Barr virus as markers for detecting patients with nasopharyngeal carcinoma. J Med Virol. 1997; 52:3. 262–269.
29. Lengauer C, Kinzler KW and Vogelstein B. Genetic instabilities in human cancers. Nature. 1998; 396:6712. 643–649.
30. Hanahan D and Weinberg RA. The hallmarks of cancer. Cell. 2000; 100:1. 57–70.
31. Mitelman F, Mark-Vendel E, Mineur A, Giovanella B and Klein G. A 3q+ marker chromosome in EBV-carrying nasopharyngeal carcinomas. Int J Cancer. 1983; 32:6. 651–655.
32. Kristensen M, Quek HH, Chew CT and Chan SH. A cytogenetic study of 74 nasopharyngeal carcinoma biopsies. Ann Acad Med Singapore. 1991; 20:5. 597–600.
33. Huang DP, Lo KW, Choi PH, Ng AY, Tsao SY, Yiu GK and Lee JC. Loss of heterozygosity on the short arm of chromosome 3 in nasopharyngeal carcinoma. Cancer Genet Cytogenet. 1991; 54:1. 91–99.
34. Huang DP, Lo KW, van Hasselt CA, Woo JK, Choi PH, Leung SF, Cheung ST, Cairns P, Sidransky D and Lee JC. A region of homozygous deletion on chromosome 9p21-22 in primary nasopharyngeal carcinoma. Cancer Res. 1994; 54:15. 4003–4006.
35. Hui AB, Lo KW, Leung SF, Choi PH, Fong Y, Lee JC and Huang DP. Loss of heterozygosity on the long arm of chromosome 11 in nasopharyngeal carcinoma. Cancer Res. 1996; 56:14. 3225–3229.
36. Mutirangura A, Tanunyutthawongese C, Pornthanakasem W, Kerekhanjanarong V, Sriuranpong V, Yenrudi S, Supiyaphun P and Voravud N. Genomic alterations in nasopharyngeal carcinoma: loss of heterozygosity and Epstein-Barr virus infection. Br J Cancer. 1997; 76:6. 770–776.
37. Cheng R, Lo K, Huang D and Tsao S. Loss of heterozygosity on chromosome 14 in primary nasopharyngeal carcinoma. Int J Oncol. 1997; 10:5. 1047–1050.
38. Tsang YS, Lo KW, Leung SF, Choi PH, Fong Y, Lee JC and Huang DP. Two distinct regions of deletion on chromosome 13q in primary nasopharyngeal carcinoma. Int J Cancer. 1999; 83:3. 305–308.
39. Shao JY, Huang XM, Yu XJ, Huang LX, Wu QL, Xia JC, Wang HY, Feng QS, Ren ZF, Ernberg I, Hu LF and Zeng YX. Loss of heterozygosity and its correlation with clinical outcome and Epstein-Barr virus infection in nasopharyngeal carcinoma. Anticancer Res. 2001; 21:4B. 3021–3029.
40. Chen YJ, Ko JY, Chen PJ, Shu CH, Hsu MT, Tsai SF and Lin CH. Chromosomal aberrations in nasopharyngeal carcinoma analyzed by comparative genomic hybridization. Gene, Chromosomes & Cancer. 1999; 25:2. 169–175.
41. Hui AB, Lo KW, Leung SF, Teo P, Fung MK, To KF, Wong N, Choi PH, Lee JC and Huang DP. Detection of recurrent chromosomal gains and losses in primary nasopharyngeal carcinoma by comparative genomic hybridisation. Int J Cancer. 1999; 82:4. 498–503.
42. Fan CS, Wong N, Leung SF, To KF, Lo KW, Lee SW, Mok TS, Johnson PJ and Huang DP. Frequent c-myc and Int-2 overrepresentations in nasopharyngeal carcinoma. Hum Pathol. 2000; 31:2. 169–178.
43. Chien G, Yuen PW, Kwong D and Kwong YL. Comparative genomic hybridization analysis of nasopharygeal carcinoma: consistent patterns of genetic aberrations and clinicopathological correlations. Cancer Genet Cytogenet. 2001; 126:1. 63–67.
44. Or YY, Hui AB, Tam KY, Huang DP and Lo KW. Characterization of chromosome 3q and 12q amplicons in nasopharyngeal carcinoma cell lines. Int J Oncol. 2005; 26:1. 49–56.
45. Liu MT, Chen YR, Chen SC, Hu CY, Lin CS, Chang YT, Wang WB and Chen JY. Epstein-Barr virus latent membrane protein 1 induces micronucleus formation, represses DNA repair and enhances sensitivity to DNA-damaging agents in human epithelial cells. Oncogene. 2004; 23:14. 2531–2539.
46. Liu MT, Chang YT, Chen SC, Chuang YC, Chen YR, Lin CS and Chen JY. Epstein-Barr virus latent membrane protein 1 represses p53-mediated DNA repair and transcriptional activity. Oncogene. 2005; 24:16. 2635–2646.
47. Chen YR, Liu MT, Chang YT, Wu CC, Hu CY and Chen JY. Epstein-Barr virus latent membrane protein 1 represses DNA repair through the PI3K/Akt/FOXO3a pathway in human epithelial cells. J Virol. 2008; 82:16. 8124–8137.
48. Pan SH, Tai CC, Lin CS, Hsu WB, Chou SF, Lai CC, Chen JY, Tien HF, Lee FY and Wang WB. Epstein-Barr virus nuclear antigen 2 disrupts mitotic checkpoint and causes chromosomal instability. Carcinogenesis. 2009; 30:2. 366–375.
49. Deng YF, Zhou DN and Lu YD. Frequent allelic loss at the FRA3B site in endemic nasopharyngeal carcinoma: association with clinical features and Epstein-Barr virus infection. J Laryngol Otol. 2007; 121:11. 1073–1078.
50. de-The G, Lavoue MF and Muenz L. Differences in EBV antibody titres of patients with nasopharyngeal carcinoma originating from high, intermediate and low incidence areas. IARC Sci Publ. 1978; 20. 471–481.
51. de-The G. (1982). Epidemiology of Epstein-Barr virus and associated diseases in man. In: Roizman B, ed. Herpesviruses. (New York, US: Plenum Press), pp. 25–103.
52. Okano M, Thiele GM, Davis JR, Grierson HL and Purtilo DT. Epstein-Barr virus and human diseases: recent advances in diagnosis. Clin Microbiol Rev. 1988; 1:3. 300–312.
53. Crawford DH, (2004). Epstein-Barr virus. In: Zuckerman AJ, Banatvala JE, Pattison JR, Griffiths PD, eds. Schoub BD, eds. Principles and Practice of Clinical Virology. (Chichester, UK: John Wiley & Sons, Ltd), pp. 123–146.
54. Lee CH, Fang CY, Sheu JJ, Chang Y, Takada K and Chen JY. Amplicons on chromosome 3 contain oncogenes induced by recurrent exposure to 12-O-tetradecanoylphorbol-13-acetate and sodium n-butyrate and Epstein-Barr virus reactivation in a nasopharyngeal carcinoma cell line. Cancer Genet Cytogenet. 2008; 185:1. 1–10.
55. Fang CY, Lee CH, Wu CC, Chang YT, Yu SL, Chou SP, Huang PT, Chen CL, Hou JW, Chang Y, Tsai CH, Takada K and Chen JY. Recurrent chemical reactivations of EBV promotes genome instability and enhances tumor progression of nasopharyngeal carcinoma cells. Int J Cancer. 2009; 124:9. 2016–2025.
56. Wu CC, Liu MT, Chang YT, Fang CY, Chou SP, Liao HW, Kuo KL, Hsu SL, Chen YR, Wang PW, Chen YL, Chuang HY, Lee CH, Chen M, Wayne Chang WS and Chen JY. Epstein-Barr virus DNase (BGLF5) induces genomic instability in human epithelial cells. Nucleic Acids Res. 2010; 38:6. 1932–1949.
57. Chang YH, Lee CP, Su MT, Wang JT, Chen JY, Lin SF, Tsai CH, Hsieh MJ, Takada K and Chen MR. Epstein-Barr virus BGLF4 kinase retards cellular S-phase progression and induces chromosomal abnormality. PloS one. 2012; 7:6. e39217
58. Chiu SH, Wu MC, Wu CC, Chen YC, Lin SF, Hsu JT, Yang CS, Tsai CH, Takada K, Chen MR and Chen JY. Epstein-Barr virus BALF3 has nuclease activity and mediates mature virion production during the lytic cycle. J Virol. 2014; 88:9. 4962–4975.
59. Fenech M. The in vitro micronucleus technique. Mutat Res. 2000; 455:1-2. 81–95.
60. Fenech M. Chromosomal biomarkers of genomic instability relevant to cancer. Drug Discov Today. 2002; 7:22. 1128–1137.
61. Rogakou EP, Pilch DR, Orr AH, Ivanova VS and Bonner WM. DNA double-stranded breaks induce histone H2AX phosphorylation on serine 139. J Biol Chem. 1998; 273:10. 5858–5868.
62. Lynn TC, Tu SM and Kawamura A. Long-term follow-up of IgG and IgA antibodies against viral capsid antigens of Epstein-Barr virus in nasopharyngeal carcinoma. J Laryngol Otol. 1985; 99:6. 567–572.
63. Hanahan D and Weinberg RA. Hallmarks of cancer: the next generation. Cell. 2011; 144:5. 646–674.
64. Old LJ, Boyse EA, Oettgen HF, Harven ED, Geering G, Williamson B and Clifford P. Precipitating antibody in human serum to an antigen present in cultured burkitt's lymphoma cells. Proc Natl Acad Sci USA. 1966; 56:6. 1699–1704.
65. Raab-Traub N, Hood R, Yang CS, Henry B and 2nd and Pagano JS. Epstein-Barr virus transcription in nasopharyngeal carcinoma. J Virol. 1983; 48:3. 580–590.
66. Raab-Traub N and Flynn K. The structure of the termini of the Epstein-Barr virus as a marker of clonal cellular proliferation. Cell. 1986; 47:6. 883–889.
67. Stolzenberg MC, Debouze S, Ng M, Sham J, Choy D, Bouguermouh A, Chan KH and Ooka T. Purified recombinant EBV desoxyribonuclease in serological diagnosis of nasopharyngeal carcinoma. Int J Cancer. 1996; 66:3. 337–341.
68. Ooka T, de Turenne-Tessier M and Stolzenberg MC. Relationship between antibody production to Epstein-Barr virus (EBV) early antigens and various EBV-related diseases. Springer Semin Immunopathol. 1991; 13:2. 233–247.
69. Scheffczik H, Savva CG, Holzenburg A, Kolesnikova L and Bogner E. The terminase subunits pUL56 and pUL89 of human cytomegalovirus are DNA-metabolizing proteins with toroidal structure. Nucleic Acids Res. 2002; 30:7. 1695–1703.
70. Bhattacharyya SP and Rao VB. A novel terminase activity associated with the DNA packaging protein gp17 of bacteriophage T4. Virology.. 1993; 196:34–44.
71. Oliveira-Costa JP, Oliveira LR, Zanetti JS, da Silveira GG, Buim MEC, Zucoloto S, Ribeiro-Silva A and Soares FA. BRCA1 and γH2AX as independent prognostic markers in oral squamous cell carcinoma. Oncoscience. 2014; 1:5. 383–391.
72. Xu E, Gong Y, Gu J, Jie L, Ajani JA and Wu X. Risk assessment of esophageal adenocarcinoma using γ-H2AX assay. Cancer Epidemiol Biomarkers Prev. 2013; 22:10. 1797–1804.
73. Bhatia A, Dey P, Goel S and Singh G. Expression of γH2AX may help in defining a genetically more stable subtype of infiltrating ductal carcinoma of breast. Indian J Med Res. 2013; 137:4. 759–766.
74. Chatzimichail E, Matthaios D, Bouros D, Karakitsos P, Romanidis K, Kakolyris S, Papashinopoulos G and Rigas A. γ-H2AX: a novel prognostic marker in a prognosis prediction model of patients with early operable non-small cell lung cancer. Int J Genomics. 2014; 2014:160236
75. Xie C, Xu LY, Yang Z, Cao XM, Li W and Lu NH. Expression of γH2AX in various gastric pathologies and its association with infection. Oncol Lett. 2014; 7:1. 159–163.
76. Cheung WL, Albadine R, Chan T, Sharma R and Netto GJ. Phosphorylated H2AX in noninvasive low grade urothelial carcinoma of the bladder: correlation with tumor recurrence. J Urol. 2009; 181:3. 1387–1392.
77. Oka K, Tanaka T, Enoki T, Yoshimura K, Ohshima M, Kubo M, Murakami T, Gondou T, Minami Y, Takemoto Y, Harada E, Tsushimi T, Li TS, Traganos F, Darzynkiewicz Z and Hamano K. DNA damage signaling is activated during cancer progression in human colorectal carcinoma. Cancer Biol Ther. 2010; 9:3. 246–252.
78. Su HF, Zhang XB, Fang M, He QC, Li WF and Wu SX. Protein microarray analysis on changes in protein phosphorylation in recurrent nasopharyngeal carcinoma. Zhonghua yi xue za zhi. 2011; 91:45. 3219–3222.
79. Gou Y, Sun C, Hu L, He J, Zhang C, Feng Y, Zhang P, Kong X, Xiao L and Li Y. Correlation between DNA damage and EB virus infection in nasopharyngeal carcinoma. Xi bao yu fen zi mian yi xue za zhi. 2014; 30:2. 184–187.
80. Blagosklonny MV. Molecular damage in cancer: an argument for mTOR-driven aging. Aging. 2011; 3:12. 1130–1141.
81. Pospelova TV, Demidenko ZN, Bukreeva EI, Pospelov VA, Gudkov AV and Blagosklonny MV. Pseudo-DNA damage response in senescent cells. Cell cycle. 2009; 8:24. 4112–4118.
82. Demidenko ZN, Zubova SG, Bukreeva EI, Pospelov VA, Pospelova TV and Blagosklonny MV. Rapamycin decelerates cellular senescence. Cell cycle. 2009; 8:12. 1888–1895.
83. Darzynkiewicz Z. When senescence masquerades as DNA damage: is DNA replication stress the culprit?. Cell cycle. 2009; 8:23. 3810–3811.
84. Morrison JA, Gulley ML, Pathmanathan R and Raab-Traub N. Differential signaling pathways are activated in the Epstein-Barr virus-associated malignancies nasopharyngeal carcinoma and Hodgkin lymphoma. Cancer Res. 2004; 64:15. 5251–5260.
85. Yip WK, Leong VC, Abdullah MA, Yusoff S and Seow HF. Overexpression of phospho-Akt correlates with phosphorylation of EGF receptor, FKHR and BAD in nasopharyngeal carcinoma. Oncol Rep. 2008; 19:2. 319–328.
86. Chou CC, Chou MJ and Tzen CY. PIK3CA mutation occurs in nasopharyngeal carcinoma but does not significantly influence the disease-specific survival. Med Oncol. 2009; 26:3. 322–326.
87. Liu Y, Chen LH, Yuan YW, Li QS, Sun AM and Guan J. Activation of AKT is associated with metastasis of nasopharyngeal carcinoma. Tumour Biol. 2012; 33:1. 241–245.
88. Ma BB, Lui VW, Hui EP, Lau CP, Ho K, Ng MH, Cheng SH, Tsao SW and Chan AT. The activity of mTOR inhibitor RAD001 (everolimus) in nasopharyngeal carcinoma and cisplatin-resistant cell lines. Investigational New Drugs. 2010; 28:4. 413–420.
89. Li YL, Zhang X, Liu Y, Li SS, Xie L, Zhang N, Liu XB and Tian YQ. Inhibition of cell growth by rapamycin through targeting mammalian target of rapamycin signaling pathway in nasopharyngeal carcinoma. Zhonghua er bi yan hou tou jing wai ke za zhi. 2010; 45:9. 765–768.
90. Yang F, Qian XJ, Qin W, Deng R, Wu XQ, Qin J, Feng GK and Zhu XF. Dual phosphoinositide 3-kinase/mammalian target of rapamycin inhibitor NVP-BEZ235 has a therapeutic potential and sensitizes cisplatin in nasopharyngeal carcinoma. PloS one. 2013; 8:3. e59879
91. Wong CH, Loong HH, Hui CW, Lau CP, Hui EP, Ma BB and Chan AT. Preclinical evaluation of the PI3K-mTOR dual inhibitor PF-04691502 as a novel therapeutic drug in nasopharyngeal carcinoma. Investigational New Drugs. 2013; 31:6. 1399–1408.
92. Ji MF, Wang DK, Yu YL, Guo YQ, Liang JS, Cheng WM, Zong YS, Chan KH, Ng SP, Wei WI, Chua DT, Sham JS and Ng MH. Sustained elevation of Epstein-Barr virus antibody levels preceding clinical onset of nasopharyngeal carcinoma. Br J Cancer. 2007; 96:4. 623–630.
93. Cao SM, Liu Z, Jia WH, Huang QH, Liu Q, Guo X, Huang TB, Ye W and Hong MH. Fluctuations of Epstein-Barr virus serological antibodies and risk for nasopharyngeal carcinoma: a prospective screening study with a 20-year follow-up. PloS one. 2011; 6:4. e19100
94. Morishita K, Parker DS, Mucenski ML, Jenkins NA, Copeland NG and Ihle JN. Retroviral activation of a novel gene encoding a zinc finger protein in IL-3-dependent myeloid leukemia cell lines. Cell. 1988; 54:6. 831–840.
95. Orlandini M, Marconcini L, Ferruzzi R and Oliviero S. Identification of a c-fos-induced gene that is related to the platelet-derived growth factor/vascular endothelial growth factor family. Proc Natl Acad Sci USA. 1996; 93:21. 11675–11680.
96. Achen MG, Jeltsch M, Kukk E, Makinen T, Vitali A, Wilks AF, Alitalo K and Stacker SA. Vascular endothelial growth factor D (VEGF-D) is a ligand for the tyrosine kinases VEGF receptor 2 (Flk1) and VEGF receptor 3 (Flt4). Proc Natl Acad Sci USA. 1998; 95:2. 548–553.
97. Manser E, Leung T, Salihuddin H, Zhao ZS and Lim L. A brain serine/threonine protein kinase activated by Cdc42 and Rac1. Nature. 1994; 367:6458. 40–46.
98. Gubbay J, Collignon J, Koopman P, Capel B, Economou A, Munsterberg A, Vivian N, Goodfellow P and Lovell-Badge R. A gene mapping to the sex-determining region of the mouse Y chromosome is a member of a novel family of embryonically expressed genes. Nature. 1990; 346:6281. 245–250.
99. Yang A, Kaghad M, Wang Y, Gillett E, Fleming MD, Dotsch V, Andrews NC, Caput D and McKeon F. p63, a p53 homolog at 3q27-29, encodes multiple products with transactivating, death-inducing, and dominant-negative activities. Mol Cell. 1998; 2:3. 305–316.
100. Bei JX, Li Y, Jia WH, Feng BJ, Zhou G, Chen LZ, Feng QS, Low HQ, Zhang H, He F, Tai ES, Kang T, Liu ET, Liu J and Zeng YX. A genome-wide association study of nasopharyngeal carcinoma identifies three new susceptibility loci. Nat Genet. 2010; 42:7. 599–603.
101. Zhao GG, Xiang XJ and He YJ. Expression and clinical significance of vascular endothelial growth factor C and D in nasopharyngeal carcinoma. Ai zheng. 2007; 26:1. 90–95.
102. Zhang Y, Peng J, Zhang H, Zhu Y, Wan L, Chen J, Chen X, Lin R, Li H, Mao X and Jin K. Notch1 signaling is activated in cells expressing embryonic stem cell proteins in human primary nasopharyngeal carcinoma. J Otolaryngol Head Neck Surg. 2010; 39:2. 157–166.
103. Crook T, Nicholls JM, Brooks L, O'Nions J and Allday MJ. High level expression of deltaN-p63: a mechanism for the inactivation of p53 in undifferentiated nasopharyngeal carcinoma (NPC)?. Oncogene. 2000; 19:30. 3439–3444.
104. Young LS and Rickinson AB. Epstein-Barr virus: 40 years on. Nat Rev Cancer. 2004; 4:10. 757–768.
105. Zeng Y, Zhang LG, Li HY, Jan MG, Zhang Q, Wu YC, Wang YS and Su GR. Serological mass survey for early detection of nasopharyngeal carcinoma in Wuzhou City, China. Int J Cancer. 1982; 29:2. 139–141.
106. Zeng Y. Seroepidemiological studies on nasopharyngeal carcinoma in China. Adv Cancer Res.. 1985; 44:121–138.
107. Chan AS, To KF, Lo KW, Mak KF, Pak W, Chiu B, Tse GM, Ding M, Li X, Lee JC and Huang DP. High frequency of chromosome 3p deletion in histologically normal nasopharyngeal epithelia from southern Chinese. Cancer Res. 2000; 60:19. 5365–5370.
108. Chan AS, To KF, Lo KW, Ding M, Li X, Johnson P and Huang DP. Frequent chromosome 9p losses in histologically normal nasopharyngeal epithelia from southern Chinese. Int J Cancer. 2002; 102:3. 300–303.
109. Zong YS, Sham JS, Ng MH, Ou XT, Guo YQ, Zheng SA, Liang JS and Qiu H. Immunoglobulin A against viral capsid antigen of Epstein-Barr virus and indirect mirror examination of the nasopharynx in the detection of asymptomatic nasopharyngeal carcinoma. Cancer. 1992; 69:1. 3–7.
110. Lin CT, Wong CI, Chan WY, Tzung KW, Ho JK, Hsu MM and Chuang SM. Establishment and characterization of two nasopharyngeal carcinoma cell lines. Lab Invest. 1990; 62:6. 713–724.
111. Glaser R, Zhang HY, Yao KT, Zhu HC, Wang FX, Li GY, Wen DS and Li YP. Two epithelial tumor cell lines (HNE-1 and HONE-1) latently infected with Epstein-Barr virus that were derived from nasopharyngeal carcinomas. Proc Natl Acad Sci USA. 1989; 86:23. 9524–9528.
112. Huang da W, Sherman BT and Lempicki RA. Systematic and integrative analysis of large gene lists using DAVID bioinformatics resources. Nat Protoc. 2009; 4:1. 44–57.
113. Huang da W, Sherman BT and Lempicki RA. Bioinformatics enrichment tools: paths toward the comprehensive functional analysis of large gene lists. Nucleic Acids Res. 2009; 37:1. 1–13.