
INTRODUCTION
Pancreatic cancer is a leading cause of cancer-related death with an overall 5-years rate of less than 5% [1]. Although some progress has been made in therapy of pancreatic cancer, there have been few improvements in overall survival (OS), largely because of the difficulty of early diagnosis [2, 3]. Most patients are diagnosed with advanced stage disease and the median survival with therapy is less than 6 months [4, 5]. Even for the minority of patients undergoing surgery, the 5-years OS is only 20% after resection [6]. Early detection of pancreatic cancer has been identified as the best way to improve patient survival [7–10]. However, there is currently no reliable and noninvasive screening test for this cancer.
Several genes have been identified as promising targets in diagnosis and therapy of pancreatic cancer. For instance, KRAS, p16/CDKN2A, TP53 and SMAD4 are altered in >50% of pancreatic cancer cases [11]. Mutations of KRAS might be used to detect pancreatic cancer in early stage [12] and SMAD4 mutations associate with dismal prognosis of pancreatic neoplasia [13, 14]. Similarly as p16/CDKN2A and TP53 tumor suppressors, lipopolysaccharide-induced tumor necrosis factor-α factor (LITAF) has been considered as a tumor suppressor gene because its expression is regulated by P53 [15]. Several cohort studies have indicated that LITAF is abnormally expressed in cancerous tissues compared with normal tissues [16–19]. Nevertheless, the mechanism of its aberrant expression is still unknown. Matsumura et al. reported that somatic mutations in the LITAF gene are associated with its aberrant expression in extramammary Paget’s disease (EMPD) samples [15]. However, the relationship between LITAF somatic mutations and its aberrant expression is unclear, and the LITAF function in pancreatic cancer is unknown.
In this study, we investigated the LITAF function in pancreatic cancer. In addition, we analyzed the methylation status of the LITAF promoter in pancreatic cancer cells and tissues. Our results indicate that LITAF functions as a tumor suppressor in pancreatic cancer, and may serve as potential biomarker for early diagnosis of pancreatic cancer.
RESULTS
Expression of LITAF is downregulated in most cases of pancreatic cancer
The mRNA expression of LITAF was evaluated in fresh tissues of 25 pancreatic cancer cases by using RT-qPCR. As shown in Figure 1, LITAF mRNA levels were downregulated in 19 out of the 25 cases (76%) compared with their adjacent non-tumor tissues (p < 0.05). Interestingly however, we found that LITAF mRNA expression of 6 cases (24%, cases 1, 2, 5, 6, 12 and 16) was actually upregulated compared with their adjacent non-tumor tissues. From these 6 cases, cases 1, 2, 5, 6, and 16 were all ductal adenocarcinoma, and case 12 was neuroendocrine carcinoma.
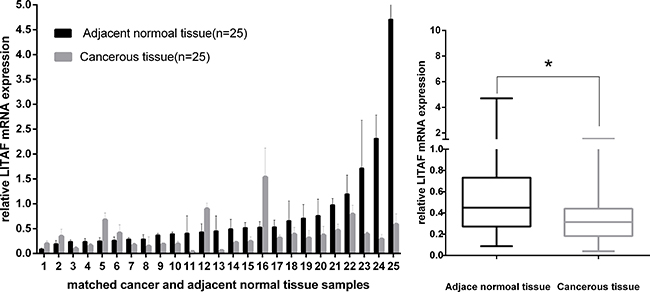
Figure 1: LITAF gene expression in 25 paired pancreatic tumor tissues. LITAF mRNA expression was decreased in most tumor cases (19/25, 76%) compared with adjacent normal tissues. Box plot analysis illustrated the reduced LITAF mRNA expression in tumor tissues with an average expression level of 0.3804 compared with adjacent normal tissues (mean expression level, 0.7573) *p < 0.05, However, mRNA expression of LITAF was increased in 6 cases (6/25, 24%).
The expression of LITAF in the pancreatic tumors was further confirmed at protein level by using immunohistochemical (IHC) staining. We examined LITAF protein expression in 25 paired fresh tumor tissues (as mentioned in Figure 1), and 25 paired paraffin-embedded tumor tissues. IHC results showed that 21 out of the total 50 cases (42%) had absent/weak cytoplasmic LITAF levels, whereas 29 tumor tissues (58%) showed strong cytoplasmic staining (Figure 2). The findings suggest that pancreatic cancer can be divided into two subtypes, according to the LITAF expression.
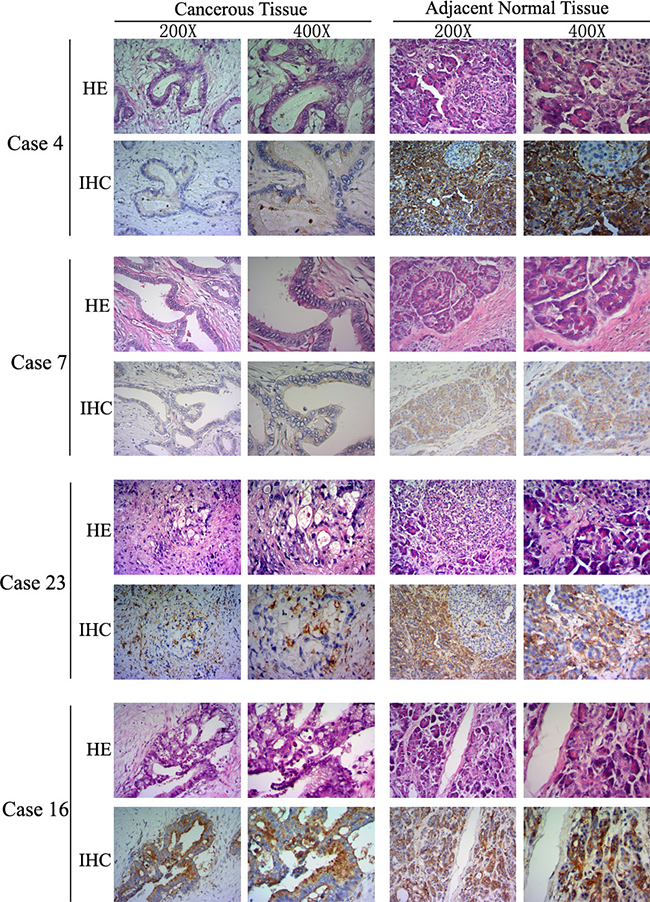
Figure 2: LITAF protein expression in human pancreatic cancer. LITAF proteins levels were analyzed by IHC in 50 paired pancreatic cancer tissues. Figure 2 illustrates examples using cases with absent/weak LITAF immunostaining (4, 7, and 23), and intense immunostaining (case 16). The histopathological morphology and IHC images are presented using × 200 and × 400 objective magnifications, respectively.
In order to investigate the relationship between clinical characteristics and LITAF expression, we classified the data sets by clinical-pathologic characteristics (i.e., age, gender, tumor size, TNM stage, lymph nodes involvement) and LITAF expression status. The clinical-pathologic characteristics of patients are summarized in Table 1; the statistical analysis results are shown in Table 2. There was no significant difference between expression of LITAF detected by IHC or RT-qPCR and clinical-pathologic characteristics. However, the study on clinical characteristics included 50 pancreatic tumors including 40 ductal adenocarcinomas and 10 other types, such as neuroendocrine neoplasms and solid pseudopapillary neoplasm. Since different types of pancreatic tumors have different biological behavior, we re-analyzed the relationship between clinical characteristics and LITAF expression in 40 ductal adenocarcinomas and achieved similar results (Supplementary Tables 1–2).
Table 1: Clinicopathologic characteristics of patients included in this study
Characteristic |
Case (%) |
Median (Range) |
|---|---|---|
Age (years) |
||
≥65 |
23 (46.0) |
62 (24,82) |
<65 |
27 (54.0) |
|
Gender |
||
male |
26 (52.0) |
|
female |
24 (48.0) |
|
Tumor Size (cm) |
||
≤2 |
9 (18.0) |
|
>2 |
41 (82.0) |
|
Lymph node involvement |
||
positive |
24 (48.0) |
|
negative |
26 (52.0) |
|
TNM Stage (WHO Classification) |
||
Ia |
2 (4.0) |
|
Ib |
15 (30.0) |
|
IIa |
8 (16.0) |
|
IIb |
22 (44.0) |
|
III/IV |
3 (6.0) |
|
Pathology |
||
Ductal adenocarcinoma |
40 (80.0) |
|
Neuroendocrine neoplasms |
6 (12.0) |
|
Intraductal papillary mucinous carcinoma |
2 (4.0) |
|
Solid-pseudopapillary neoplasm |
1 (2.0) |
|
Mucinous cystic carcinoma |
1 (2.0) |
|
Table 2: Correlation between clinical characteristics and LITAF expression
LITAF mRNA Expression (Q-PCR) |
LITAF protein Expression (IHC) |
|||||||
|---|---|---|---|---|---|---|---|---|
High |
Low |
N |
p |
High |
Low |
N |
p |
|
Age (years) |
||||||||
≥65 |
0 |
10 |
25 |
0.051 |
12 |
10 |
50 |
0.662 |
<65 |
6 |
9 |
17 |
11 |
||||
Gender |
||||||||
male |
4 |
8 |
25 |
0.378 |
15 |
11 |
50 |
0.963 |
female |
2 |
11 |
14 |
10 |
||||
Tumor Size (cm) |
||||||||
≤2 |
2 |
1 |
25 |
1.0 |
3 |
6 |
50 |
0.20 |
>2 |
5 |
17 |
26 |
15 |
||||
Lymph Nodes |
||||||||
positive |
1 |
10 |
25 |
0.180 |
16 |
11 |
50 |
0.865 |
negative |
5 |
9 |
13 |
10 |
||||
TNM Stage |
||||||||
I/II |
4 |
19 |
25 |
0.05 |
27 |
20 |
50 |
1.0 |
III/IV |
2 |
0 |
2 |
1 |
||||
LITAF expression correlates with survival in pancreatic cancer patients
Based on the IHC results, we investigated the relationship between patient survival and LITAF expression in 25 patients. 8 patients had a low LITAF expression (IRS ≤ 1), while17 patients had a high LITAF expression (IRS ≥ 9). Surprisingly, patients with the low LITAF expression had a significantly poorer DFS (p = 0.021, Figure 3A). There was no significant association between LITAF expression and OS (p = 0.947, Figure 3B). However, the patients involved in survival analysis had different pancreatic tumors types, including 20 ductal adenocarcinomas, 2 neuroendocrine neoplasms, 2 intraductal papillary mucinous carcinomas and 1 solid-pseudopapillary neoplasm. Similar results were observed as we re-analyzed OS and DFS of 20 ductal adenocarcinomas (Supplementary Figure 1).
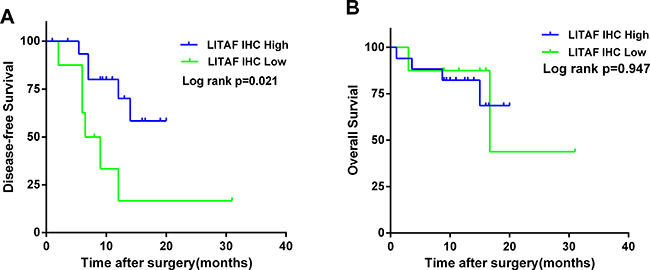
Figure 3: LITAF protein expression correlates with survival in patients with pancreatic cancer. The Kaplan–Meier (KM) method was used to analyze DFS and OS according to the LITAF protein expression. (A) The Kaplan–Meier curve for DFS revealed a poorer DFS in patients with low LITAF expression (median 7.25 months vs 11 months, Log rank p = 0.021). (B) The Kaplan–Meier curve for OS demonstrated that there was no significant difference in OS according to LITAF expression (median 13.25 vs 12.5 months, Log rank p = 0.947). Green line, low LITAF expression. Blue line, high LITAF expression.
LITAF transcription is regulated by promoter methylation in pancreatic cancer cells and tissues
To understand the molecular mechanisms regulating LITAF transcription in pancreatic cancer, we first analyzed LITAF mRNA expression in four pancreatic cancer cell lines (BxPC-3, AsPC-1, CFPAC-1 and PANC-1) by RT-qPCR. LITAF expression was higher in BxPC-3 and CFPAC-1 cells, and lower in AsPC-1 and PANC-1 cells (Figure 4A). To investigate if promoter methylation might be responsible for the downregulation of LITAF, we examined the methylation status of the promoter region of LITAF by using MSP and BSP in the four pancreatic carcinoma cell lines and 25 paired pancreatic cancer samples. Intense methylation was detected in AsPC-1 and PANC-1 cells that had the low LITAF expression, whereas BxPC-3 and CFPAC-1 cells with the high LITAF expression showed low methylation (Figure 4B). Additionally, there was a significant inverse association between LITAF mRNA expression and methylation status of LITAF promoter in 25 paired pancreatic tumor tissues (p < 0.001, Figure 4E).
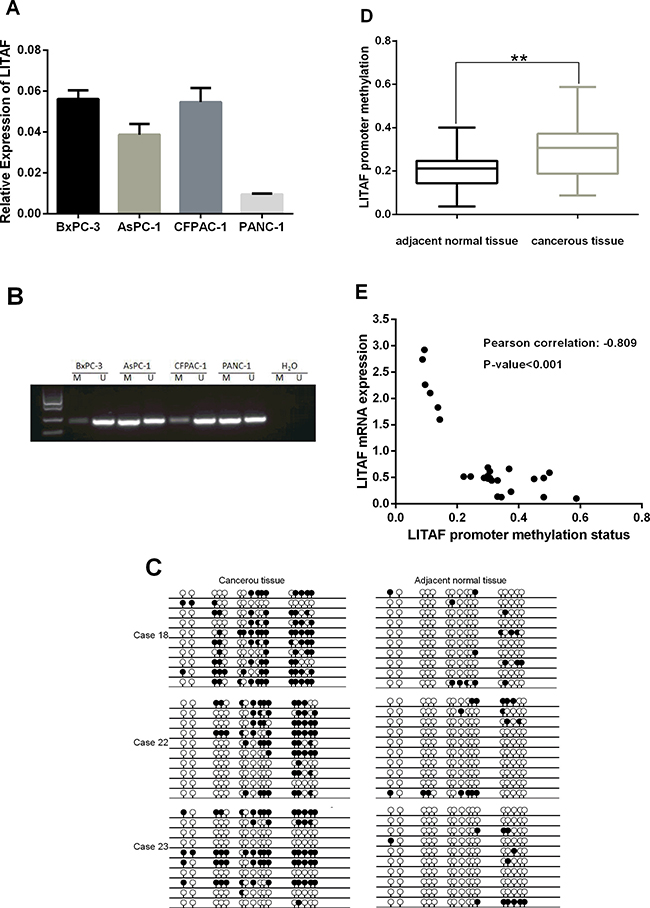
Figure 4: Transcription of LITAF is regulated by promoter methylation. (A) The LITAF mRNA expression was examined by RT-qPCR in four pancreatic cancer cell lines. The downregulated LITAF was detected in AsPC-1 and PANC-1 cells, which showed intense methylation (shown in Figure 4B), whereas high LITAF expression was detected in BxPC-3 and CFPAC-1 cells with weak methylation (Figure 4B). Triplicate tests for each cell line, X ± SD. (B) Analysis of the methylation status of the LITAF promoter region covering a 240 bp fragment in BxPC-3, AsPC-1, CFPAC-1, and PANC-1 cells. A visible PCR product in lane-U indicates the presence of unmethylated promoters; the presence of product in lane-M indicates the presence of promoter methylation. Intense methylation was detected in AsPC-1 and PANC-1 cells, and weak methylation was detected in BxPC-3 and CFPAC-1 cells. (C) Methylation status of LITAF promoter covering a 240 bp fragment with 16 CpG sites in paired pancreatic neoplasm samples was confirmed by BSP. Each row represents one bacterial clone with one circle symbolizing one CpG site. 10–15 clones were randomly selected and sequenced for each sample. Filled circles (●) indicated the methylated. Open circles (○) indicated the unmethylated. BSP analysis revealed the methylation on LITAF promoter was significantly increased compared with adjacent normal pancreatic tissue. (D) Box plot illustrates significant LITAF promoter hypermethylation in 25 paired fresh cancerous tissues compared with adjacent normal tissues (mean methylation level: 20.22% vs 30.03%, **p < 0.01). (E) Scatter plot showed the inverse association between LITAF mRNA expression and DNA methylation status of the LITAF gene in 25 pancreatic tumor tissues. Pearson correlation: r = –0.809, p < 0.001.
Next, we analyzed the methylation levels of LITAF promoter in tumor samples and adjacent normal tissues. The BSP analysis covered a 240bp-DNA fragment with 16 CpG sites on LITAF promoter and revealed the methylation status on LITAF promoter (Figure 4C). The methylation levels of LITAF promoter were significantly increased in 25 pancreatic cancer tissues compared with adjacent normal tissues (p < 0.01, Figure 4D); 3 typical pancreas cancer cases (case 18, 22 and 23) with hypermethylation in LITAF promoter are shown in Figure 4C.
Methylation of LITAF promoter decreases LITAF expression in pancreatic carcinoma cells
Based on the above data, we further analyzed the impact of promoter methylation status on LITAF mRNA expression in pancreatic cancer cells. Both PANC-1 cells (with intense promoter methylation and weak LITAF expression) and BxPC-3 cells (with weak promoter methylation and high LITAF expression) were treated with the demethylation agent 5-Aza-dC for 72 h at different dosages of 0, 1, 2.5 and 5 μM. The LITAF levels in PANC-1 cells were dose-dependently upregulated at 5-Aza-dC, while there was no significant difference in LITAF expression in BxPC-3 cells (Figure 5A).
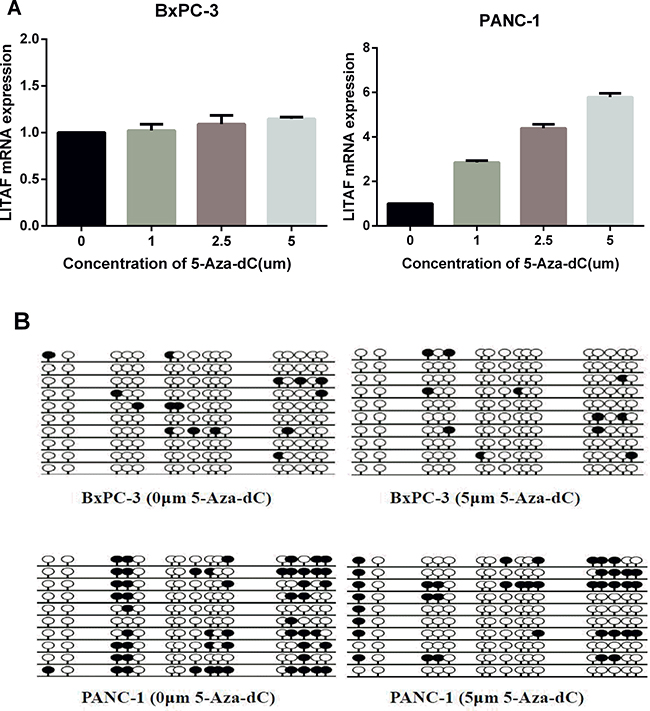
Figure 5: LITAF promoter methylation regulates LITAF expression in pancreatic carcinoma cells. (A) PANC-1 and BxPC-3 cells were treated with 0, 1, 2.5 or 5 μM 5-Aza-dC for 72 h, and LITAF mRNA levels were determined by RT-qPCR. The results represent triplicate tests for each concentration point, X ± SD. (B) The methylation status of LITAF promoter covering a 240 bp region with 16 CpG sites measured in cells treated with and without 5-Aza-dC (5 μM). Each row represents one bacterial clone with one circle symbolizing one CpG site. 10–15 clones were randomly selected and sequenced for each sample. Filled circles (●) indicated the methylated sites; open circles (○) indicated the unmethylated sites.
BSP analysis of the DNA methylation status showed that the methylation level of LITAF promoter decreased in PANC-1 cells after treatment with 5-Aza-dC, while it did not change in BxPC-3 cells (Figure 5B). These data indicate that pancreatic carcinoma cells with intense promoter methylation are sensitive to demethylation by 5-Aza-dC, and suggest that the decreased methylation of LITAF promoter contributes to the upregulation of LITAF mRNA.
LITAF demethylation inhibits cell growth, and induces apoptosis and cell cycle arrest in pancreatic carcinoma cells
In order to evaluate the LITAF function in regulating tumorigenesis of pancreatic cancer cells, cell proliferation, apoptosis, and cell cycle were analyzed. The cell growth of PANC-1 cells was suppressed after treatment with 5 μM 5-Aza-dC (Figure 6A, *p < 0.05, **p < 0.01). However, an inhibition of cell growth was observed also in BxPC-3 cells (Figure 6A, *p < 0.05, **p < 0.01). To investigate whether this cell growth suppression was caused by apoptosis, PANC-1 and BxPC-3 cells were stained with propidium iodide (PI) and Annexin V after treatment with 5-Aza-dC for 72 h, and apoptosis was assessed by flow cytometry. The apoptosis rate of PANC-1 cells treated with 5 μM 5-Aza-dC was 27.8%, much higher than control cells (Figure 6B). However, there was no significant difference in the apoptosis rates of BxPC-3 cells after treatment with 0 μM and 5 μM 5-Aza-dC.
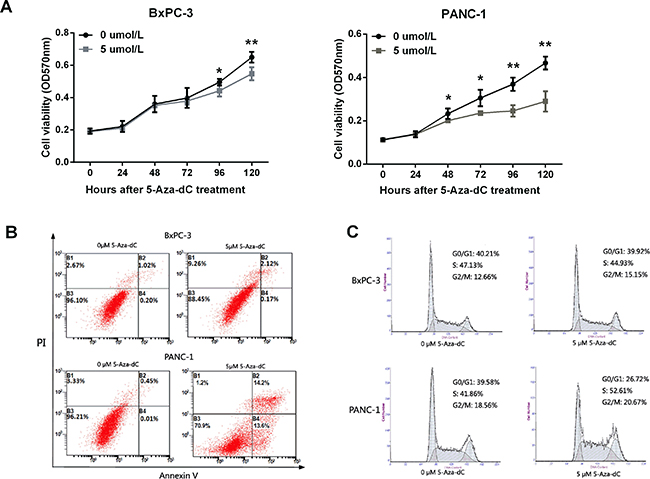
Figure 6: LITAF demethylation inhibits cell growth, and induces apoptosis and cell cycle arrest in pancreatic carcinoma cells. (A) Growth of BxPC-3 and PANC-1 cells treated with 5-Aza-dC (0 to 5 μM) was analyzed using MTT assay. The results represent four measurements for each time point; X ± SD; *p < 0.05, **p < 0.01. (B) Flow cytometry apoptosis assay with PI and Annexin V staining. (C) Flow cytometry analysis of cell cycle measured in cells treated with 5 μM 5-Aza-dC for 72 h.
To evaluate whether cell cycle could be impacted after demethylation of LITAF, flow cytometry analysis was performed in PANC-1 and BxPC-3 cells. The analysis revealed a significant increase in the number of cells in the S phase in 5-Aza-dC treated PANC-1 cells, but not BxPC-3 cells (Figure 6C). The number of PANC-1 cells in G0/G1 phase decreased remarkably, while G2/M phase did not change (Figure 6C). Together, these results indicated that LITAF demethylation induces LITAF expression and cell cycle block at the S phase checkpoint in pancreas carcinoma cells
DISCUSSION
Recent studies have shown that LITAF is frequently down-regulated in different types of cancer [20], including acute leukemia [17], breast cancer [16, 21], lymphoma [22, 23], and prostatic cancer [24], suggesting that it may function as a tumor suppressor gene. The downregulation of LITAF induces migration, increased cell viability, and colony formation in cancer cells [25].
Most pancreatic cancers are unresectable at diagnosis, with an overall 5-year survival rate of less than 5% [1]; the resectable surgery can be performed only in 15% of candidate patients [26]. Early detection is crucial to improve the survival rates of pancreatic cancer patients; yet, reliable and non-invasive biomarker are missing. In this study, we have investigated the LITAF function in pancreatic cancer to test whether it could serve as a potential biomarkers for early diagnosis and target therapy.
Similarly to studies in other solid cancers, we found that the expression of LITAF was downregulated in most of pancreatic cancer cases (76%, 19/25); most of them were pancreatic ductal adenocarcinoma. Interestingly however, we found that the expression of LITAF mRNA was actually increased in 6 pancreatic cancer cases (24%, 6/25) compared with their paired non-tumor tissues (Figure 1). Among the 6 cases, 5 cases were pancreatic ductal adenocarcinomas, and one case was neuroendocrine carcinoma. This might suggest that pancreatic ductal adenocarcinoma might be further divided into at least two subgroups: with and without high LITAF expression. A similar result was also observed by analyzing the LITAF protein expression. In a large set of 50 cases including 25 paired fresh tumors and 25 paired paraffin-embedded tumors, 42% (21/50) cases showed absent/weak immunostaining, whereas 58% (29/50) cases showed intense LITAF immunostaining (Figure 2). The immunostaining results also indicated two different LITAF expression patterns in pancreatic cancer. Future studies should confirm these observations using a large number of pancreatic cancer cases.
Interestingly, low expression of LITAF correlated with a poorer DFS (Figure 3), although there was no significant difference on OS. These results suggest that LITAF might be used as a potential prognosis marker in pancreatic cancer patient; however, future studies should use longer follow-up periods to confirm these data.
To study the tumorigenesis mechanisms of pancreatic cancer, most previous studies have focused on gene mutations, transcriptional activation, and signal transduction [11–14, 24, 27]. Here, we investigated the biological function of LITAF through the epigenetic analysis of pancreatic cancer cells and tissues. Our results demonstrate that the methylation degree of LITAF promoter regulates the LITAF expression (Figures 4 and 5), suggest that the LITAF promoter methylation may represent one of the mechanisms responsible for the pathogenesis of pancreatic cancer. Our epigenetic data show that demethylation of the LITAF promoter inhibits cell proliferation, survival and cell cycle of pancreatic carcinoma cells. Our results suggest that the methylation status of the LITAF promoter may be considered as a candidate biomarker for molecular therapy of pancreatic cancer. Whether LITAF might serve as a target gene in early diagnosis of pancreatic cancer needs further analysis in patients with early-stage pancreatic cancer.
In addition, in our epigenetic study of the LITAF promoter in pancreatic cancer cells and tissues, we noticed not all of pancreatic cancer cases and cells had the same reaction to aberrant methylation of LITAF promoter, indicating existence of different molecular subtypes.
Together, our results indicate that LITAF functions as a tumor suppressor in pancreatic cancer cells. More studies will be needed to determine whether LITAF might serve as a pancreatic cancer biomarker, and whether it might be used stratify different molecular subtypes of pancreatic cancer.
MATERIALS AND METHODS
Patients and tissue samples
All human primary pancreatic neoplasm tissues and adjacent nonmalignant tissues were obtained from Hepatobiliary & Pancreatic Surgery Department of Ningbo Medical Treatment Center Lihuili Eastern Hospital and Pathology Center in Ningbo. Specimens were stored at −80°C for molecular analysis. Pathological diagnosis was done and confirmed by at least two senior pathologists at the Pathological Center in Ningbo. The histopathology of tumors was classified by AJCC classification. This study was approved by the Ethics Committee of Ningbo University (Ningbo, China).
Cell culture
Four pancreatic carcinoma cell lines (BxPC-3, AsPC-1, CFPAC-1, and PANC-1) were provided by Department of Pathology and Pathophysiology, Institute of Pathology and Forensic Medicine, Zhejiang University School of Medicine. All cell lines were maintained in RPMI 1640, DMEM or IMDM medium supplemented with 10% fetal bovine serum (GIBCO Invitrogen, USA) in a humidified incubator at 37°C with an atmosphere of 5% CO2.
Immunohistochemistry (IHC)
Immunohistochemical analysis of LITAF protein expression was performed on 50 formalin-fixed, paraffin-embedded tumor tissues, and paired adjacent non-tumor tissues. The sections were deparaffinized in xylene and rehydrated by transfer through graded concentrations of ethanol to distilled water, then placed in 500 ml of 10 mM citrate buffer (pH 6.0) and boiled for 1~2 min. Endogenous peroxidase activity was blocked by incubation with 3% H2O2 for 10 minutes as room temperature. Sections were then treated with sheep serum to avoid non-specific staining. All sections were incubated with anti-LITAF mouse monoclonal antibody (D-5, 1:1000, Santa Cruz), overnight at 4°C, and then incubated with rabbit anti-mouse secondary antibody for 10 minutes at room temperature. After rinsing three times in PBS for 3 minutes each, the sections were incubated with DAB for 2 minutes, counterstained with hematoxylin for 2 minutes, dehydrated with gradient alcohol and transparentized with dimethylbenzene. IHC expression of LITAF was examined via light microscopy. The intensity of the IHC staining was estimated by the immunoreactive score system (IRS) (Supplementary Table 3) [28]. The IRS ≤ 1 was defined as low expression and the IRS ≥ 9 was defined as high expression. All slides were reviewed independently by 2 pathologist who were blinded to each other’s readings.
Real-time quantitative PCR analyses
Total RNA was extracted from pancreatic cancer cells and tissues using RNAiso reagent (TaKaRa, Japan), and reverse-transcribed using a PrimeScript® RT reagent kit (RR037A, Takara). Real-time PCR was performed with SYBR® Premix Ex TaqTM (Takara), using the 7500 Real-Time PCR System (Applied Biosystems). The real-time primer sequences are listed in Supporting Information (Supplementary Table 4). GAPDH was used as a control. Relative gene fold change was normalized to GAPDH, and calculated using the 2-ΔΔct method.
5-Aza-2′-deoxycytidine treatment
For 5-Aza -2′-deoxycytidine(Sigma) treatment, cell lines were treated with 1 μM,2.5 μM, or 5 μM 5-Aza-2′-deoxycytidine or an equivalent volume of dimethyl sulfoxide, for 72 h.
Methylation-specific PCR and bisulfate genomic sequencing of LITAF promoter
Methylation-specific PCR (MSP) primers were designed in the 5′ untranslated region CpG island of the published sequences near translation start site of LITAF, as described [29]. Genbank accession: NC 018927 Region: 11680019–11680258 [30], which covers a 240bp DNA fragment harboring 16 CpG island sites.
The bisulfite modification of purified genomic DNA from four pancreatic cancer cell lines and 25 paired fresh tumor tissues was performed by using an EZ DNA Methylation Kit (ZYMO Research D5001, USA). Subsequently, MSP was carried out focusing on the target frame of LITAF promoter, and confirmed by direct bisulfate genomic sequencing PCR (BSP).
For BSP, bisulfite-treated DNA was amplified with primers specific for a fragment of the LITAF promoter that contained 16 CpG sites. The PCR products were subcloned into the pMD™ 19-Vector (TaKaRa, Japan) and 10–15 colonies were randomly chosen and sequenced. MSP and BSP primer sequences are listed in Supplementary Table 4.
Proliferation assay
Cell proliferation activity was assessed with the 3-(4, 5-dimethylthiazol-2-yl)-2, 5-diphenyl tetrazolium bromide (MTT) assay. Pancreatic cells were seeded into 96-well plates at a density of 2 × 10³ cells/well, then the proliferation rates were measured at 0, 24, 48, 72 , 96, and 120 hours. Absorbance values were measured at 570 nm with a microplate reader. BxPC-3 and PANC-1 cells were treated with 5-Aza -2′-deoxycytidine at a concentration of 0 μM or 5 μM.
Flow cytometry
BxPC-3 and PANC-1 cells were grown into 6-well plates at a density of 5 × 10⁵ cells/well and treated with 5-Aza -2′-deoxycytidine at a concentration of 0 μM or 5 μM for 72 h. Cells were then quantified by flow cytometry using the Annexin V/PI Apoptosis Kit (Multiscience, China). Briefly, cells were washed in cold PBS, re-suspended in 1X binding buffer, and incubated with 5 μl of FITC Annexin V and 10 μl of propidium iodide (PI) for 15 minutes in the dark. The cells were then re-suspended in 400 μl of 1X binding buffer and analyzed immediately by flow cytometry (Beckman Coulter). For cell cycle analysis, the cells were fixed in 70% ethanol and stained with 10 μl Reagent A (Multiscience, China). Then, the cells were sorted by flow cytometry (Beckman Coulter) and cell cycle profiles were analyzed by ModFit software.
Statistical analysis
RT-qPCR, cell proliferation assay, and analysis of LITAF promoter methylation status were evaluated using Student’s t-tests. Chi-square test was used for analysis of patient clinical characteristics. The Kaplan–Meier survival analysis was used to estimate disease-free survival (DFS) and overall survival (OS). Patients were separated into two groups according to high or low expression levels of LITAF. The log-rank test was used to compare the survival difference between the two groups. Correlation between the LITAF expression and LITAF promoter methylation status was evaluated by calculating a Pearson correlation.
Author contributions
Conceived and designed the experiments: YZ XJ RZ CL. Performed the experiments: YZ JH XY YS YW YK LL. Analyzed the data: YZ JH XY. Contributed reagents/material/analysis tools: GR XF GZ QL HP. Wrote the paper: YZ XJ XZ YS YW RZ CL.
Affiliation contributions
Ningbo Medical Center Lihuili Eastern Hospital and Medical School of Ningbo University have the same contributions to this article.
ACKNOWLEDGMENTS
We thank The Center of Clinical and Pathological Diagnosis of Ningbo for providing sections of pancreatic cancer tissues.
CONFLICTS OF INTEREST
Hongyang Pan and Xinxia Zhang are employed by Epitomics (Hangzhou) Inc. There are no patents, products in development or marketed products to declare. There is no conflict of interest among the authors.
FUNDING
This work was supported by grant from the Scientific Innovation Team Project of Ningbo (2013B2010).
REFERENCES
1. Siegel R, Naishadham D, Jemal A. Cancer statistics, 2012. CA Cancer J Clin. 2012; 62:10–29. https://doi.org/10.3322/caac.20138.
2. Klapman J, Malafa MP. Early detection of pancreatic cancer: why, who, and how to screen. Cancer Contr. 2008; 15:280–87. https://doi.org/10.1177/107327480801500402.
3. Costello E, Greenhalf W, Neoptolemos JP. New biomarkers and targets in pancreatic cancer and their application to treatment. Nat Rev Gastroenterol Hepatol. 2012; 9:435–44. https://doi.org/10.1038/nrgastro.2012.119.
4. Burris HA 3rd, Moore MJ, Andersen J, Green MR, Rothenberg ML, Modiano MR, Cripps MC, Portenoy RK, Storniolo AM, Tarassoff P, Nelson R, Dorr FA, Stephens CD, Von Hoff DD. Improvements in survival and clinical benefit with gemcitabine as first-line therapy for patients with advanced pancreas cancer: a randomized trial. J Clin Oncol. 1997; 15:2403–13. https://doi.org/10.1200/JCO.1997.15.6.2403.
5. Moore MJ, Goldstein D, Hamm J, Figer A, Hecht JR, Gallinger S, Au HJ, Murawa P, Walde D, Wolff RA, Campos D, Lim R, Ding K, et al, and National Cancer Institute of Canada Clinical Trials Group. Erlotinib plus gemcitabine compared with gemcitabine alone in patients with advanced pancreatic cancer: a phase III trial of the National Cancer Institute of Canada Clinical Trials Group. J Clin Oncol. 2007; 25:1960–66. https://doi.org/10.1200/JCO.2006.07.9525.
6. Tempero MA, Berlin J, Ducreux M, Haller D, Harper P, Khayat D, Schmoll HJ, Sobrero A, Van Cutsem E. Pancreatic cancer treatment and research: an international expert panel discussion. Ann Oncol. 2011; 22:1500–06. https://doi.org/10.1093/annonc/mdq545.
7. Greenhalf W, Neoptolemos JP. Increasing survival rates of patients with pancreatic cancer by earlier identification. Nat Clin Pract Oncol. 2006; 3:346–47. https://doi.org/10.1038/ncponc0483.
8. Misek DE, Patwa TH, Lubman DM, Simeone DM. Early detection and biomarkers in pancreatic cancer. J Natl Compr Canc Netw. 2007; 5:1034–41. https://doi.org/10.6004/jnccn.2007.0086.
9. Goggins M. Molecular markers of early pancreatic cancer. J Clin Oncol. 2005; 23:4524–31. https://doi.org/10.1200/JCO.2005.19.711.
10. Wilentz RE, Hruban RH. Pathology of cancer of the pancreas. Surg Oncol Clin N Am. 1998; 7:43–65.
11. Jones S, Zhang X, Parsons DW, Lin JC, Leary RJ, Angenendt P, Mankoo P, Carter H, Kamiyama H, Jimeno A, Hong SM, Fu B, Lin MT, et al. Core signaling pathways in human pancreatic cancers revealed by global genomic analyses. Science. 2008; 321:1801–06. https://doi.org/10.1126/science.1164368.
12. Shi C, Fukushima N, Abe T, Bian Y, Hua L, Wendelburg BJ, Yeo CJ, Hruban RH, Goggins MG, Eshleman JR. Sensitive and quantitative detection of KRAS2 gene mutations in pancreatic duct juice differentiates patients with pancreatic cancer from chronic pancreatitis, potential for early detection. Cancer Biol Ther. 2008; 7:353–60. https://doi.org/10.4161/cbt.7.3.5362.
13. Iacobuzio-Donahue CA, Fu B, Yachida S, Luo M, Abe H, Henderson CM, Vilardell F, Wang Z, Keller JW, Banerjee P, Herman JM, Cameron JL, Yeo CJ, et al. DPC4 gene status of the primary carcinoma correlates with patterns of failure in patients with pancreatic cancer. J Clin Oncol. 2009; 27:1806–13. https://doi.org/10.1200/JCO.2008.17.7188.
14. Blackford A, Serrano OK, Wolfgang CL, Parmigiani G, Jones S, Zhang X, Parsons DW, Lin JC, Leary RJ, Eshleman JR, Goggins M, Jaffee EM, Iacobuzio-Donahue CA, et al. SMAD4 gene mutations are associated with poor prognosis in pancreatic cancer. Clin Cancer Res. 2009; 15:4674–79. https://doi.org/10.1158/1078-0432.CCR-09-0227.
15. Matsumura Y, Matsumura Y, Nishigori C, Horio T, Miyachi Y. PIG7/LITAF gene mutation and overexpression of its gene product in extramammary Paget’s disease. Int J Cancer. 2004; 111:218–23. https://doi.org/10.1002/ijc.20251.
16. Abba MC, Drake JA, Hawkins KA, Hu Y, Sun H, Notcovich C, Gaddis S, Sahin A, Baggerly K, Aldaz CM. Transcriptomic changes in human breast cancer progression as determined by serial analysis of gene expression. Breast Cancer Res. 2004; 6:R499–513. https://doi.org/10.1186/bcr899.
17. Wang D, Liu J, Tang K, Xu Z, Xiong X, Rao Q, Wang M, Wang J. Expression of pig7 gene in acute leukemia and its potential to modulate the chemosensitivity of leukemic cells. Leuk Res. 2009; 33:28–38. https://doi.org/10.1016/j.leukres.2008.06.034.
18. Ricketts SL, Carter JC, Coleman WB. Identification of three 11p11.2 candidate liver tumor suppressors through analysis of known human genes. Mol Carcinog. 2003; 36:90–99. https://doi.org/10.1002/mc.10101.
19. Gentile M, Ahnström M, Schön F, Wingren S. Candidate tumour suppressor genes at 11q23-q24 in breast cancer: evidence of alterations in PIG8, a gene involved in p53-induced apoptosis. Oncogene. 2001; 20:7753–60. https://doi.org/10.1038/sj.onc.1204993.
20. Zou J, Guo P, Lv N, Huang D. Lipopolysaccharide-induced tumor necrosis factor-α factor enhances inflammation and is associated with cancer (Review). Mol Med Rep. 2015; 12:6399–404. Review https://doi.org/10.3892/mmr.2015.4243.
21. Fernandez-Cobo M, Holland JF, Pogo BG. Transcription profiles of non-immortalized breast cancer cell lines. BMC Cancer. 2006; 6:99. https://doi.org/10.1186/1471-2407-6-99.
22. Bertolo C, Roa S, Sagardoy A, Mena-Varas M, Robles EF, Martinez-Ferrandis JI, Sagaert X, Tousseyn T, Orta A, Lossos IS, Amar S, Natkunam Y, Briones J, et al. LITAF, a BCL6 target gene, regulates autophagy in mature B-cell lymphomas. Br J Haematol. 2013; 162:621–30. https://doi.org/10.1111/bjh.12440.
23. Shi Y, Kuai Y, Lei L, Weng Y, Berberich-Siebelt F, Zhang X, Wang J, Zhou Y, Jiang X, Ren G, Pan H, Mao Z, Zhou R. The feedback loop of LITAF and BCL6 is involved in regulating apoptosis in B cell non-Hodgkin’s-lymphoma. Oncotarget. 2016; 7:77444-77456. https://doi.org/10.18632/oncotarget.12680.
24. Zhou J, Yang Z, Tsuji T, Gong J, Xie J, Chen C, Li W, Amar S, Luo Z. LITAF and TNFSF15, two downstream targets of AMPK, exert inhibitory effects on tumor growth. Oncogene. 2011; 30:1892–900. https://doi.org/10.1038/onc.2010.575.
25. Huang D, He X, Zou J, Guo P, Jiang S, Lv N, Alekseyev Y, Luo L, Luo Z. Negative regulation of Bmi-1 by AMPK and implication in cancer progression. Oncotarget. 2016; 7:6188–200. https://doi.org/10.18632/oncotarget.6748.
26. Rosty C, Goggins M. Early detection of pancreatic carcinoma. Hematol Oncol Clin North Am. 2002; 16:37–52. https://doi.org/10.1016/S0889-8588(01)00007-7.
27. Tang X, Marciano DL, Leeman SE, Amar S. LPS induces the interaction of a transcription factor, LPS-induced TNF-α factor, and STAT6(B) with effects on multiple cytokines. Proc Natl Acad Sci USA. 2005; 102:5132–37. https://doi.org/10.1073/pnas.0501159102.
28. Tur MK, Etschmann B, Benz A, Leich E, Waller C, Schuh K, Rosenwald A, Ertl G, Kienitz A, Haaf AT, Bräuninger A, Gattenlöhner S. The 140-kD isoform of CD56 (NCAM1) directs the molecular pathogenesis of ischemic cardiomyopathy. Am J Pathol. 2013; 182:1205–18.
29. Mestre-Escorihuela C, Rubio-Moscardo F, Richter JA, Siebert R, Climent J, Fresquet V, Beltran E, Agirre X, Marugan I, Marín M, Rosenwald A, Sugimoto KJ, Wheat LM, et al. Homozygous deletions localize novel tumor suppressor genes in B-cell lymphomas. Blood. 2007; 109:271–80. https://doi.org/10.1182/blood-2006-06-026500.
30. NCBI GenBank. Available at:.http://www.ncbi.nlm.nih.gov/nucleotide/528476567?report=genbank&log$=nuclalign&blast_rank=2&RID=BXKX18MX015&from=11680019&to=116802.