
INTRODUCTION
Patients with head and neck squamous cell carcinoma (HNSCC) usually have metastatic lesions when the disease is first diagnosed, and the 5-year survival rate is less than 50% [1, 2]. The epidermal growth factor receptor (EGFR)-targeting monoclonal antibody cetuximab has been approved for the treatment of patients with HNSCC, the curative effects of this drug are limited [3, 4]. Therefore, the identification of novel molecular targets in metastatic activating pathways would help to develop new therapies for this disease.
MicroRNAs (miRNAs) are small, noncoding RNAs that function to fine-tune the expression of protein-coding or protein-noncoding RNAs by sequence-dependent manner [5, 6]. Accumulating evidence has showed that aberrant expression of miRNAs disrupts systematically controlled RNA networks in cancer cells [7]. These events are deeply involved in cancer progression, metastasis, and drug resistance [8]. We have sequentially identified novel cancer pathways based on antitumor miRNAs in several cancers [9–14].
Analysis of our miRNA expression signatures based on RNA-sequencing showed that miR-29 family members (i.e., miR-29a, miR-29b, and miR-29c) are frequently detected as downregulated miRNAs in several types of cancers [10, 15–17]. Moreover, functional studies have revealed that all members of the miR-29 family inhibit cancer cell migration and invasion, suggesting that these miRNAs are involved in metastatic pathways in human cancers [11, 18, 19]. Our previous studies have shown that restoration of the miR-29 family significantly inhibits cancer cell aggressiveness through targeting lysyl oxidase like-2 (LOXL2) in HNSCC, renal cell carcinoma, and lung cancer [11, 20, 21]. LOXL2 functions is crosslinking of collagen and elastin in the extracellular matrix (ECM), and overexpression of LOXL2 has involved in human pathogenesis, fibrosis and cancers [22]. Knockdown of LOXL2 significantly inhibits cancer cell migration and invasion, indicating that LOXL2 could be a new therapeutic target in cancers.
In HNSCC, several studies have demonstrated the downregulation of the miR-29 family and their antitumor functions through targeting several oncogenic genes [19, 21]. We previously found that downregulation of miR-29 family and overexpression of laminin (LAMC2) and integrin (ITGA6) in HNSCC cells, thereby activating cancer cell migration and invasion [19]. Several studies have demonstrated that activation of ECM/integrin-mediated signalling contributes to cancer cell progression and metastasis [23, 24]. Thus, we hypothesised that identification of cancer networks mediated by the antitumor miR-29 family may provide novel insights into the therapeutic targets of HNSCC. In this study, we conducted re-analysis of therapeutic targets regulated by the antitumor miR-29 family in HNSCC cells and identified two key molecules, ITGA6 and ITGB1. Regulation of ITGA6 and the miR-29 family has been reported previously [19]. Thus, we focused on ITGB1 and investigated the functional significance of the gene in HNSCC pathogenesis.
RESULTS
Expression levels of miR-29 family members in HNSCC clinical specimens and cell lines
The expression levels of miR-29a, miR-29b, and miR-29c were significantly lower in cancer tissues (n = 22) and HNSCC cell lines (SAS and HSC3) than in normal epithelial tissues (n = 22) (P < 0.0001, P = 0.0003, and P < 0.0001, respectively; Supplementary Figure 1A).
The miR-29 family members were clustered at two different human chromosome loci (miR-29b-1 and miR-29a at 7q32.3; miR-29b-2 and miR-29c at 1q32.2). Spearman’s rank test showed positive correlations between the expression of miR-29a and miR-29b (R = 0.648 and P < 0.0001) and between miR-29b and miR-29c (R = 0.746 and P < 0.0001; Supplementary Figure 1B).
Identification of target genes regulated by the miR-29 family in HNSCC cells
Our strategy for selection of genes regulated by the miR-29 family is shown in Figure 1. The TargetScan7.1 database showed that 1,256 genes had putative target sites for the miR-29 family in their 3′UTRs. First, to evaluate upregulated genes in clinical HNSCC specimens (accession number: GSE9638). A total of 382 genes were selected as putative targets for the miR-29 family in HNSCC cells (log2 ratio > 0.5). Next, we performed comprehensive gene expression analyses using SAS transfectant (GEO accession number: GSE47657). Genes downregulated (log2 ratio < -0.5) by transfection with miR-29a were merged with TargetScan-selected genes. A total of 201 genes were downregulated in miR-29a transfectants and had putative binding sites in their 3′UTRs, respectively.
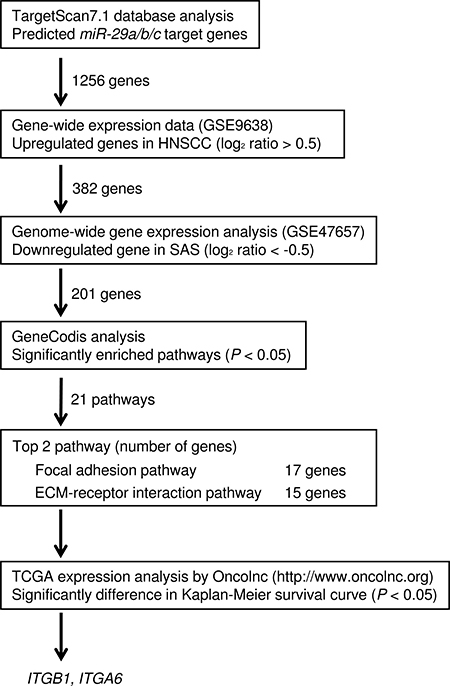
Figure 1: Flow chart depicting the strategy for identification of putative target genes regulated by the miR-29 family in HNSCC cells.
Furthermore, we categorised these putative targets into KEGG pathways using the GeneCodis database. A total of 21 pathways were identified as miR-29 family regulated pathways (Table 1). Among these pathways, we focused on the “Focal adhesion pathway” and “ECM-receptor interaction pathway” because the miR-29 family markedly inhibited cancer cell migration and invasion abilities [19]. A total of 17 genes were identified from these two pathways (Tables 2 and 3).
Table 1: Significantly enriched pathways regulated by the miR-29 family in HNSCC cells
Number of genes |
Annotations |
P-value |
|---|---|---|
17 |
(KEGG) 04510: Focal adhesion |
1.0E-13 |
15 |
(KEGG) 04512: ECM-receptor interaction |
1.9E-16 |
14 |
(KEGG) 04974: Protein digestion and absorption |
1.3E-15 |
11 |
(KEGG) 05146: Amoebiasis |
5.6E-10 |
11 |
(KEGG) 05200: Pathways in cancer |
5.9E-05 |
8 |
(KEGG) 05222: Small cell lung cancer |
6.8E-07 |
6 |
(KEGG) 05410: Hypertrophic cardiomyopathy (HCM) |
1.2E-04 |
6 |
(KEGG) 04010: MAPK signaling pathway |
2.9E-02 |
5 |
(KEGG) 05414: Dilated cardiomyopathy |
1.9E-03 |
5 |
(KEGG) 04514: Cell adhesion molecules (CAMs) |
8.1E-03 |
4 |
(KEGG) 04930: Type II diabetes mellitus |
1.8E-03 |
4 |
(KEGG) 05412: Arrhythmogenic right ventricular cardiomyopathy (ARVC) |
7.7E-03 |
4 |
(KEGG) 04670: Leukocyte transendothelial migration |
3.0E-02 |
4 |
(KEGG) 05145: Toxoplasmosis |
3.5E-02 |
4 |
(KEGG) 04360: Axon guidance |
3.8E-02 |
4 |
(KEGG) 04910: Insulin signaling pathway |
3.9E-02 |
3 |
(KEGG) 00561: Glycerolipid metabolism |
2.1E-02 |
3 |
(KEGG) 05130: Pathogenic Escherichia coli infection |
2.8E-02 |
3 |
(KEGG) 04920: Adipocytokine signaling pathway |
3.7E-02 |
3 |
(KEGG) 04260: Cardiac muscle contraction |
4.7E-02 |
3 |
(KEGG) 00564: Glycerophospholipid metabolism |
5.0E-02 |
Table 2: Focal adhesion pathway-related genes in HNSCC cells
Gene Symbol |
Gene Name |
conserved |
poorly conserved |
GSE9638 log2 ratio |
GSE47657 log2ratio |
|---|---|---|---|---|---|
ITGA6 |
integrin, alpha 6 |
1 |
0 |
1.105 |
−1.620 |
ITGB1 |
integrin, beta 1 (fibronectin receptor, beta polypeptide, antigen CD29 includes MDF2, MSK12) |
1 |
0 |
0.708 |
−0.566 |
LAMC1 |
laminin, gamma 1 (formerly LAMB2) |
1 |
0 |
0.657 |
−1.711 |
MAPK10 |
mitogen-activated protein kinase 10 |
1 |
1 |
1.224 |
−0.909 |
PDGFRB |
platelet-derived growth factor receptor, beta polypeptide |
1 |
0 |
0.591 |
−0.738 |
COL1A2 |
collagen, type I, alpha 2 |
2 |
0 |
1.854 |
−0.606 |
COL3A1 |
collagen, type III, alpha 1 |
2 |
0 |
2.653 |
−0.782 |
COL4A1 |
collagen, type IV, alpha 1 |
2 |
0 |
1.932 |
−1.779 |
COL4A2 |
collagen, type IV, alpha 2 |
1 |
0 |
1.792 |
−1.757 |
COL4A5 |
collagen, type IV, alpha 5 |
2 |
0 |
1.364 |
−0.959 |
COL4A6 |
collagen, type IV, alpha 6 |
1 |
0 |
3.010 |
−0.870 |
COL5A1 |
collagen, type V, alpha 1 |
3 |
1 |
2.438 |
−1.561 |
COL5A2 |
collagen, type V, alpha 2 |
2 |
0 |
2.810 |
−3.182 |
COL5A3 |
collagen, type V, alpha 3 |
3 |
0 |
1.373 |
−0.701 |
COL6A3 |
collagen, type VI, alpha 3 |
1 |
0 |
1.782 |
−1.156 |
COL6A6 |
collagen, type VI, alpha 6 |
1 |
0 |
1.544 |
−0.741 |
COL11A1 |
collagen, type XI, alpha 1 |
2 |
0 |
1.038 |
−0.753 |
Table 3: ECM-receptor interaction pathway-related genes in HNSCC cells
Gene Symbol |
Gene Name |
conserved |
poorly conserved |
GSE9638 log2 ratio |
GSE47657 log2 ratio |
|---|---|---|---|---|---|
ITGA6 |
integrin, alpha 6 |
1 |
0 |
1.105 |
−1.620 |
ITGB1 |
integrin, beta 1 (fibronectin receptor, beta polypeptide, antigen CD29 includes MDF2, MSK12) |
1 |
0 |
0.708 |
−0.566 |
LAMC1 |
laminin, gamma 1 (formerly LAMB2) |
1 |
0 |
0.657 |
−1.711 |
COL1A2 |
collagen, type I, alpha 2 |
2 |
0 |
1.854 |
−0.606 |
COL3A1 |
collagen, type III, alpha 1 |
2 |
0 |
2.653 |
−0.782 |
COL4A1 |
collagen, type IV, alpha 1 |
2 |
0 |
1.932 |
−1.779 |
COL4A2 |
collagen, type IV, alpha 2 |
1 |
0 |
1.792 |
−1.757 |
COL4A5 |
collagen, type IV, alpha 5 |
2 |
0 |
1.364 |
−0.959 |
COL4A6 |
collagen, type IV, alpha 6 |
1 |
0 |
3.010 |
−0.870 |
COL5A1 |
collagen, type V, alpha 1 |
3 |
1 |
2.438 |
−1.561 |
COL5A2 |
collagen, type V, alpha 2 |
2 |
0 |
2.810 |
−3.182 |
COL5A3 |
collagen, type V, alpha 3 |
3 |
0 |
1.373 |
−0.701 |
COL6A3 |
collagen, type VI, alpha 3 |
1 |
0 |
1.782 |
−1.156 |
COL6A6 |
collagen, type VI, alpha 6 |
1 |
0 |
1.544 |
−0.741 |
COL11A1 |
collagen, type XI, alpha 1 |
2 |
0 |
1.038 |
−0.753 |
Analysis of the clinical features of ITGB1 in patients with HNSCC using TCGA database
We created survival curves of 17 putative target genes which were involved in “Focal adhesion pathway” and “ECM-receptor interaction pathway” using OncoLnc from TCGA database. We assessed the Kaplan–Meier univariate survival of patient groups using TCGA database; high expression of ITGA6 and ITGB1 was significantly associated with poor prognosis of patients with HNSCC (Figure 2A, Supplementary Figures 2A, 2B, and 3). The gene, COL6A6, showed the opposite behavior, its low expression was significantly associated with poor prognosis of the disease (p = 0.000993). Thus, we omitted it from future analysis.
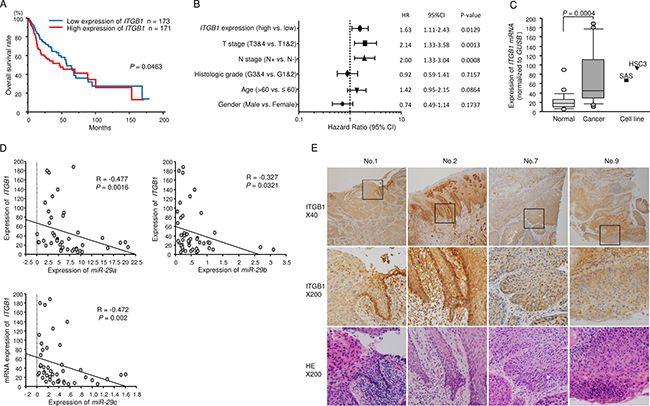
Figure 2: Expression of ITGB1 and associations between ITGB1 expression levels and clinical parameters in patients with HNSCC. (A) Kaplan-Meier analysis of ITGB1 expression and overall survival. (B) Multivariate Cox proportional hazards models. (C) Expression levels of ITGB1 in HNSCC clinical specimens and cell lines. GUSB was used as an internal control. (D) The negative correlations between ITGB1 expression and the expression of miR-29a, miR-29b, and miR-29c. Spearman’s rank test was used to evaluate the correlation. (E) Immunohistochemical staining of ITGB1 in HNSCC clinical specimens. The patients’ backgrounds and clinicopathological characteristics are summarised in Table 4. Primary rabbit anti-ITGB1 antibodies were diluted 1:100. The slides were treated with biotinylated goat anti-rabbit antibodies. ITGB1 was strongly expressed in cancer lesions (40× and 200× magnification).
Table 4: Clinical features of 22 patients with HNSCC
No. |
Age |
Sex |
Location |
T |
N |
M |
Stage |
Differentiaion |
Remarks |
|---|---|---|---|---|---|---|---|---|---|
1 |
64 |
F |
Oral floor |
4a |
2c |
0 |
IVA |
moderate |
IHC |
2 |
73 |
M |
Tongue |
3 |
2b |
0 |
IVA |
poor |
IHC |
3 |
77 |
M |
Tongue |
2 |
2b |
0 |
IVA |
poor |
|
4 |
63 |
F |
Oral floor |
2 |
2b |
0 |
IVA |
Basaloid SCC |
|
5 |
59 |
M |
Tongue |
1 |
2a |
0 |
IVA |
moderate |
|
6 |
36 |
F |
Tongue |
3 |
1 |
0 |
III |
moderate |
|
7 |
67 |
M |
Tongue |
3 |
0 |
0 |
III |
moderate |
IHC |
8 |
60 |
F |
Tongue |
2 |
I |
0 |
III |
well |
|
9 |
66 |
M |
Tongue |
2 |
0 |
0 |
II |
moderate |
IHC |
10 |
67 |
M |
Tongue |
2 |
0 |
0 |
II |
poor-moderate |
|
11 |
76 |
F |
Tongue |
1 |
0 |
0 |
I |
well |
|
12 |
69 |
M |
Tongue |
1 |
0 |
0 |
I |
well |
|
13 |
73 |
F |
Tongue |
1 |
0 |
0 |
I |
well |
|
14 |
64 |
M |
Tongue |
1 |
0 |
0 |
I |
well |
|
15 |
70 |
M |
Tongue |
1 |
0 |
0 |
I |
well |
|
16 |
38 |
M |
Tongue |
1 |
0 |
0 |
I |
well |
|
17 |
51 |
M |
Tongue |
1 |
0 |
0 |
I |
well |
|
18 |
34 |
F |
Tongue |
1 |
0 |
0 |
I |
poor |
|
19 |
70 |
M |
Tongue |
1 |
0 |
0 |
I |
moderate |
|
20 |
71 |
M |
Tongue |
1 |
0 |
0 |
I |
well |
|
21 |
82 |
M |
Oral floor |
1 |
0 |
0 |
I |
well |
|
22 |
81 |
M |
Tongue |
1 |
0 |
0 |
I |
extremely well |
We previously published several reports on ITGA6 [15, 19]; therefore, in this study, we focused on ITGB1 as a target gene of the miR-29 family. Multivariate Cox proportional hazards models were used to assess independent predictors of progression-free survival. High ITGB1 expression was a significant prognostic factor in patients with HNSCC (hazard ratio [HR] = 1.63, 95% confidence interval [CI] = 1.11–2.43, P = 0.0129; Figure 2B).
Expression of ITGB1/ITGB1 in HNSCC clinical specimens
Expression of ITGB1 was significantly upregulated in HNSCC tumor tissues (P = 0.0004, Figures 2C). Spearman’s rank test showed a negative correlation between the expression of ITGB1 and miR-29a (P = 0.0016, R = -0.477), ITGB1 and miR-29b (P = 0.0321, R = -0.327), and ITGB1 and miR-29c (P = 0.002, R = -0.472; Figure 2D).
We also examined the expression levels of ITGB1 in HNSCC clinical specimens by immunohistochemistry. ITGB1 was strongly expressed in several cancer tissues (Figure 2E).
ITGB1 was directly regulated by the miR-29 family in HNSCC cells
We also investigated whether ITGB1 expression was reduced by restoration of the miR-29 family in HNSCC cells. The mRNA and protein expression levels of ITGB1/ITGB1 were significantly repressed in all member of miR-29 family (miR-29a, miR-29b and miR-29c) transfectants compared with that in mock transfectants (Figures 3A and 3B). The synergistic effects of miR-29a, miR-29b and miR-29c were evaluated the mRNA expression levels of ITGB1 with co-transfection of miR-29a, miR-29b and miR-29c in SAS cells. However, no synergistic effects were observed (Supplementary Figure 4).
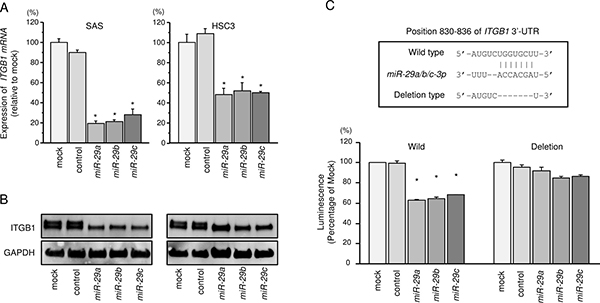
Figure 3: Regulation of ITGB1 expression by miR-29 family members in HNSCC cells. (A) Expression levels of ITGB1 mRNAs 72 h after transfection of cells with 10 nM miR-29a, miR-29b, and miR-29c. GUSB was used as an internal control. *P < 0.0001. (B) Protein expression of ITGB1 72 h after transfection with miR-29a, miR-29b, and miR-29c. GAPDH was used as a loading control. (C) miR-29 family binding sites in the 3′UTR of ITGB1 mRNA. Dual Luciferase reporter assays using vectors encoding putative miR-29 family target sites in the ITGB1 3′UTR (positions 830-836) for wild-type and deletion constructs. Normalized data were calculated as ratios of Renilla/firefly luciferase activities. *P < 0.0001.
Furthermore, we performed luciferase reporter assays in SAS cells to determine whether ITGB1 mRNA contained target sites for the miR-29 family. We used vectors encoding the partial wild-type or deletion-type sequences of the 3′UTR of ITGB1 with miR-29 family target sites. Luminescence intensity was significantly reduced by co-transfection with the miR-29 family and the vector carrying the wild-type 3′UTR of ITGB1 mRNA (Figure 3C).
Effects of ITGB1 knockdown on cell proliferation, migration, and invasion in HNSCC cell lines
Knockdown efficiency of si-ITGB1 transfection were evaluated in SAS and HSC3 cells, and these siRNAs effectively suppressed ITGB1/ITGB1 expression (Figure 4A and 4B).
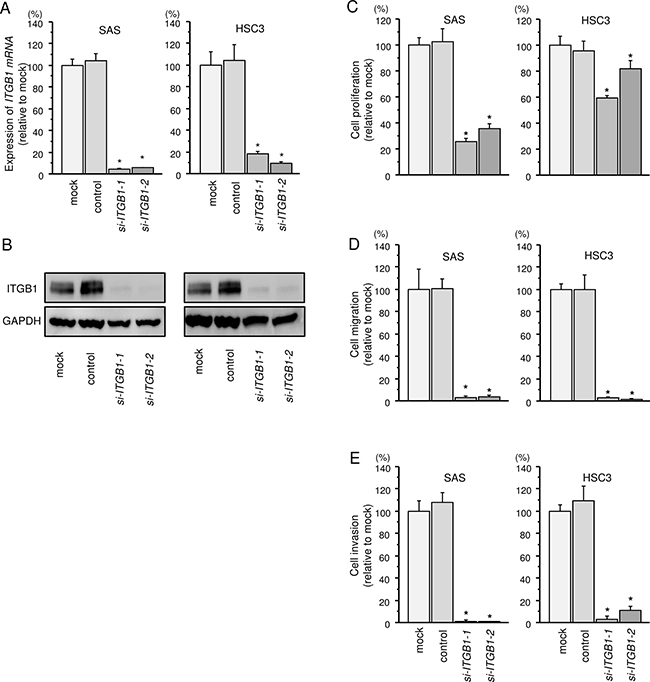
Figure 4: Effects of ITGB1 silencing by siRNA transfection in HNSCC cells. (A) ITGB1 mRNA expression 72 h after transfection of HNSCC cells with 10 nM siRNA. GUSB was used as an internal control. *P < 0.0001. (B) ITGB1 protein expression 72 h after transfection with siRNA. GAPDH was used as a loading control. (C) Cell proliferation was determined by XTT assays 72 h after transfection with siRNA. *P < 0.0001. (D) Cell movement was assessed by migration assays 48 h after transfection with siRNA. *P < 0.0001. (E) Characterization of invasion 48 h after transfection with siRNA. *P < 0.0001.
Cell proliferation, migration and invasion abilities were significantly inhibited in si-ITGB1 transfectants compared with that in mock transfectants (Figure 4C–4E).
Effects of co-transfection with ITGB1 and the miR-29 family in SAS cells
We performed gain-of-function analyses by ITGB1 expression vector transfection into SAS cells (Supplementary Figure 5A). Cancer cell migration and invasion abilities were enhanced by overexpression of ITGB1 in SAS cells (Supplementary Figure 5B and 5C).
To validate whether the ITGB1/miR-29 family axis was critical for the progression of HNSCC, we performed ITGB1 rescue experiments by co-transfection with ITGB1 and the miR-29 family in SAS cells (Figure 5A). The results showed that the proliferation abilities of SAS cells were not recovered by ITGB1 and miR-29 family transfection compared with cells showing restoration of each miR-29 family member alone (Figure 5B). In contrast, the migration and invasion abilities of SAS cells were recovered markedly by ITGB1 and miR-29 family transfection compared with cells showing restoration of each miR-29 family member alone (Figure 5C–5F). These findings suggested that ITGB1 was involved in cancer cell migration and invasion in HNSCC cells.
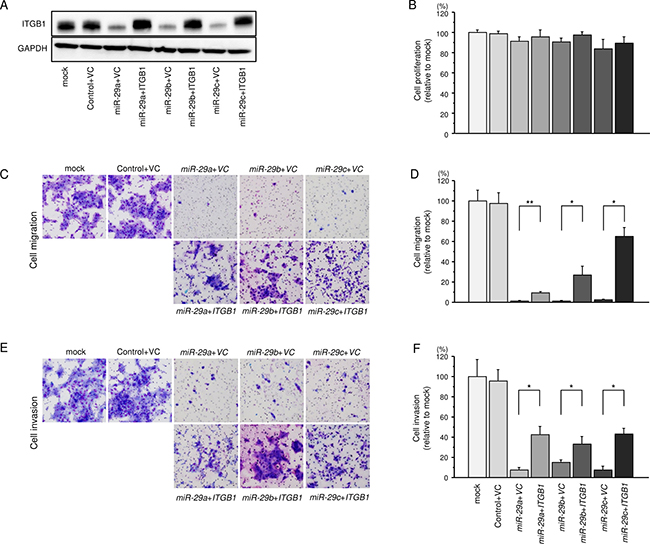
Figure 5: Effects of cotransfection with ITGB1/miR-29 family on the proliferlation, migration and invasion abilities of SAS cells. (A) Expression of ITGB1 was confirmed by western blotting 48 h after reverse transfection with the miR-29 family and 24 h after forward transfection with the vector control (VC) and ITGB1 expression vector (1 μg) in SAS cells. GAPDH was used as a loading control. (B) Cell proliferation was determined 48 h after transfection with miR-29 family members and 24 h after forward transfection with the ITGB1 expression vector (1 μg). (C) Phase micrographs of SAS cells in migration assays. (100× magnification). (D) Cell migration activity was assessed 48 h after reverse transfection with the miR-29 family and 24 h after forward transfection with the ITGB1 expression vector (1μg). *P < 0.0001, *P < 0.02. (E) Phase micrographs of SAS cells in invasion assays. (100× magnification) (F). Cell invasion activity was assessed 48 h after reverse transfection with miR-29 family members and 24 h after forward transfection with the ITGB1 expression vector (1 μg). *P < 0.0001.
Effects of ITGB1 knockdown on downstream signalling
We analysed the effects of downstream oncogenic signalling of ITGB1 using siRNA transfection of SAS cells. The phosphorylation statuses of AKT (Ser473), ERK1/2 (Thr202/Tyr204), and FAK (Tyr397) were examined. Knockdown of ITGB1 reduced the phosphorylation of AKT, ERK1/2, and FAK in SAS cells (Figure 6). We also investigated whether the expression of the miR-29 family affected downstream signalling. Restoration of the miR-29 family reduced the phosphorylation of AKT, ERK1/2, and FAK in SAS cells (Figure 6).
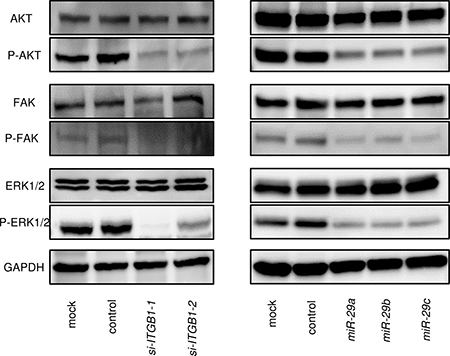
Figure 6: Effects of ITGB1-mediated downstream signalling. Knockdown of ITGB1 and restoration of the miR-29 family in SAS cells reduced the phosphorylation of AKT, ERK1/2, and FAK. GAPDH was used as a loading control.
DISCUSSION
The overall survival of patients with HNSCC recurrence or metastasis is very poor [1, 2]. Currently developed EGFR inhibitors, including monoclonal antibodies and tyrosine kinase inhibitors, have achieved only modest success in the treatment of this disease [3, 4]. Screening for novel therapeutic targets is indispensable for the development of new therapeutic strategies for patients with HNSCC recurrence or metastasis.
Our recent studies showed that antitumor miRNAs, i.e., the miR-29 family, miR-218, miR-150s, and the miR-199 family, significantly inhibited cancer cell migration and invasion, suggesting that these miRNAs controlled metastatic genes and pathways in HNSCC cells [9, 15, 19, 25]. To date, we have shown that several ECM-related genes, including LAMA3, LAMB3, LAMC2, ITGA3, and ITGA6, are overexpressed in HNSCC cells and that these genes are regulated by antitumor miRNAs [9, 15, 19, 25]. Laminins are heterotrimers containing α, β, and γ chains [26]. Laminin-332 (LAMA3, LAMB3, and LAMC2), a large multidomain molecule involved in cell adhesion and matrix assembly, is a prominent component of the ECM in SCC. Aberrantly expressed laminin-332 is correlated with patient prognosis in HNSCC [27, 28].
Integrins, cell adhesion molecules whose main function is to mediate mutual adhesion between cells and the ECM, e.g., laminin, collagen, elastin, and fibronectin [29, 30], belong to a large family of αβ heterodimeric transmembrane proteins; 24 heterodimeric combinations have been reported in humans [29, 30]. Laminin-332 can interact with two types of integrins, ITGA6/ITGB4 (α6β4) and ITGA3/ITGB1 (α3β1), and activation of laminin-332-mediated integrin signalling enhances cancer cell development and metastasis [26, 31]. Our present study showed that all members of the miR-29 family directly regulated ITGB1 in HNSCC cells. Moreover, ectopic expression of the miR-29 family and knockdown of ITGB1 suppressed cancer cell aggressiveness by inhibiting ITGB1-mediated downstream signalling. To summarise our miRNA studies to date, laminin-332-ITGA6/ITGB4 and laminin-332-ITGA3/B1 pathways were regulated by antitumor miRNAs, i.e., the miR-29 family, miR-218, miR-150-5p/-3p, and the miR-199 family, in HNSCC cells (Figure 7).
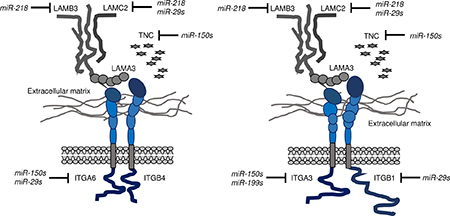
Figure 7: Illustration of inhibition of integrin receptors and ligands, i.e., laminin-332 and Tenascin C, by antitumor miRNAs in HNSCC cells. Data from our previous studies and the present study on integrins (ITGA6/ITGB4, ITGA3/ITGB1) regulated by antitumor miRNAs (the miR-29 family, miR-218, miR-150-5p, and miR-150-3p) and related ligands (LAMA3, LAMB3, LAMC2, and TNC) are summarized.
Epigenetic regulation of ITGB1 has been reported in several studies [19, 32–34]. In gastric cancer, upregulation of telomerase reverse transcriptase suppresses the expression of miR-29a and induces the expression of ITGB1 [32]. In another study, RNA sequencing demonstrated that miR-29c is downregulated in gastric cancer specimens and targets ITGB1 [33]. More recently, the pivotal tumor suppressor p53 was shown to induce miR-30e-5p, which targets both ITGA6 and ITGB1 in colorectal cancer [35]. Our present and past studies showed that the miR-29 family directly regulates both ITGA6 and ITGB1 in HNSCC cells [19]. Moreover, our recent study of the miRNA signature of HNSCC showed that the expression of miR-30e-5p was significantly reduced in HNSCC tissues [15]. These findings indicate that the miR-29 family and miR-30e-5p function as important regulators of cancer cell migration and invasion. We also revealed that miR-223 acted as an antitumor miRNA through targeting ITGA3 and ITGB1 in prostate cancer [34].
ITGB1 can form heterodimers with α subunits, and these heterodimers regulate numerous signalling pathways in both physiological and pathophysiological conditions [30]. Overexpression of ITGB1 was frequently observed several cancers, including HNSCC, resulting in activation of ITGB1-mediated downstream signalling pathways [32, 34–36]. Previous studies have shown that crosstalk of integrins and several growth factor receptors, such as EGFR and the hepatocyte growth factor receptor (c-Met), activated downstream signalling cooperatively [37, 38]. Overexpression and aberrant activation of EGFR signalling enhance proliferation, invasion, metastasis, and angiogenesis and are deeply involved in HNSCC aggressiveness [39, 40]. Currently, the EGFR inhibitor cetuximab has been approved for HNSCC as a first-line treatment in patients with recurrent or metastatic disease [41]. Importantly, EGFR inhibitors induced c-MET signal activation, resulting in resistance to EGFR-targeted therapy [42]. Several studies have demonstrated that activation of ITGB1-mediated signals induces radioresistance in HNSCC and breast cancer [43, 44]. Moreover, activation of ITGB1-mediated signals enhances chemoresistance in several cancers [45, 46]. Increasing knowledge of ITGB1 suggests that aberrant expression and activation of ITGB1-mediated cancer signalling is involved in cancer cell aggressiveness. Therefore, inhibition of ITGB1 and ITGB1-mediated cancer signalling is attractive as a new treatment strategy for cancer cells that have acquired treatment resistance.
In conclusions, analysis of oncogenes targeted by the antitumor miR-29 family (miR-29a, miR-29b, and miR-29c) showed that ITGA6 and ITGB1 were directly regulated by these miRNAs in HNSCC. High expression of these oncogenic genes was associated with poor prognosis in patients with HNSCC. Inhibition of ITGB1 significantly reduced cancer cell aggressiveness, indicating that ITGB1 and ITGB1-mediated cancer signalling may be promising therapeutic targets for HNSCC. Identification of antitumor miRNA-mediated novel RNA networks may contribute to the development of new therapeutic strategies.
MATERIALS AND METHODS
Clinical specimens of patients with HNSCC and cell lines
The patients’ backgrounds and clinicopathological characteristics are summarised in Table 4.
Informed consent was done properly for all patients in this study. This study protocol was approved by the Institutional Review Board of Chiba University. Two human HNSCC cell lines, SAS and HSC3, were investigated in this study.
Expression analyses of patients with HNSCC and cell lines
PCR quantification was carried out essentially as previously described [9, 15]. To quantify the expression level of miRNAs, we utilised stem-loop qRT-PCR for miR-29a (assay ID: 002112; Applied Biosystems, Foster City, CA, USA), miR-29b (assay ID: 000413), and miR-29c (assay ID: 000587) following the manufacturer’s protocol. TaqMan probes and primers were used for ITGB1 expression (assay ID: Hs00559595_m1; Applied Biosystems). GUSB (assay ID: Hs99999908_m1; Applied Biosystems) and RNU48 (assay ID: 001006; Applied Biosystems) were used as internal controls.
Transfection of HNSCC cell lines with miRNA mimic, small interfering RNA (siRNA), and plasmid vector
Pre-miR miRNA precursors (miR-29a-3p; P/N: MC12499, miR-29b-3p; P/N: MC10103, miR-29c-3p; P/N: MC10518, and negative control miR; P/N: AM17111; Applied Biosystems) were used in gain-of-function assays. si-ITGB1 (P/N: HSS105559 and HSS105560; Invitrogen) was used in loss-of-function assays. Transfection procedures of RNAs or plasmid DNA were described as previously [9, 15].
Cell proliferation, migration, and invasion assays
Cell proliferation, migration, and invasion assays were carried out as previously described [9, 15].
Identification of putative genes regulated by the miR-29 family in HNSCC cells
Oncogenic genes regulated by the miR-29 family were identified by a combination of in silico database analyses and gene expression analyses as described previously [9, 15]. The microarray data were deposited into GEO database (http://www.ncbi.nlm.nih.gov/geo/; accession number: GSE47657).
Western blotting
Immunoblotting was performed with rabbit anti-ITGB1 antibodies (1:1000, #9699; Cell Signaling Technology, Danvers, MA, USA), anti-Akt antibodies (1:1000, #4691; Cell Signaling Technology), anti-phospho-Akt antibodies (1:1000, #4060; Cell Signaling Technology), anti-extracellular signal-regulated kinase (ERK1/2) antibodies (1:1000, #4695; Cell Signaling Technology), anti-phospho-ERK1/2 antibodies (1:2000, #4370; Cell Signaling Technology), anti-focal adhesion kinase (FAK) antibodies (1:1000, #3285; Cell Signaling Technology), and anti-phospho-FAK antibodies (1:1000, #8556; Cell Signaling Technology). Anti-GAPDH antibodies (1:10000, ab8246; Abcam, Cambridge, UK) were used as an internal control.
Immunohistochemistry
Anti-ITGB1 antibodies (#9699; Cell Signaling Technology) were used in immunohistochemistry.
Plasmid construction and dual-luciferase reporter assays
The wild-type or deletion-type sequences of the 3′-untranslated region (UTR) of ITGB1 in miR-29a, miR-29b, and miR-29c target sites were inserted in the psiCHECK-2 vector (C8021; Promega, Madison, WI, USA). The procedure for dual luciferase reporter assays was described previously [9].
Analysis of HNSCC specimens using The Cancer Genome Atlas (TCGA)
HNSCC specimens in TCGA database (https://tcga-data.nci.nih.gov/tcga/) were divided into two groups, i.e., high and low expression of ITGB1. The groups were analysed by Kaplan–Meier survival curves and log-rank statistics using OncoLnc (http://www.oncolnc.org) [47]. The genomic and clinical data were retrieved from cBioportal (http://www.cbioportal.org/), which were downloaded on May 9, 2017. Detailed information on the method is described in our previous paper [48].
Statistical analysis
Statistical analysis was performed as described previously [9, 15]. All analyses were performed using Expert StatView (version 4, SAS Institute Inc., Cary, NC, USA). Multivariate Cox proportional hazard regression models were used to determine independent factors for survival with JMP Pro 13.
CONFLICTS OF INTEREST
The authors declare no conflicts of interest.
FUNDING
This study was supported by JSPS KAKENHI(C) (grant nos. 17K16893, 16K20229, 15K10801, 16K11224, and 17K11375).
REFERENCES
1. Siegel RL, Miller KD, Jemal A. Cancer statistics, 2016. CA Cancer J Clin. 2016; 66:7–30.
2. Perez-Ordonez B, Beauchemin M, Jordan RC. Molecular biology of squamous cell carcinoma of the head and neck. J Clin Pathol. 2006; 59:445–453.
3. Bonner JA, Harari PM, Giralt J, Cohen RB, Jones CU, Sur RK, Raben D, Baselga J, Spencer SA, Zhu J, Youssoufian H, Rowinsky EK, Ang KK. Radiotherapy plus cetuximab for locoregionally advanced head and neck cancer: 5-year survival data from a phase 3 randomised trial, and relation between cetuximab-induced rash and survival. Lancet Oncol. 2010; 11:21–28.
4. Moreira J, Tobias A, O’Brien MP, Agulnik M. Targeted Therapy in Head and Neck Cancer: An Update on Current Clinical Developments in Epidermal Growth Factor Receptor-Targeted Therapy and Immunotherapies. Drugs. 2017; 77:843–857.
5. Bartel DP. MicroRNAs: genomics, biogenesis, mechanism, and function. Cell. 2004; 116:281–297.
6. Lewis BP, Burge CB, Bartel DP. Conserved seed pairing, often flanked by adenosines, indicates that thousands of human genes are microRNA targets. Cell. 2005; 120:15–20.
7. Lin S, Gregory RI. MicroRNA biogenesis pathways in cancer. Nat Rev Cancer. 2015; 15:321–333.
8. Garzon R, Marcucci G, Croce CM. Targeting microRNAs in cancer: rationale, strategies and challenges. Nat Rev Drug Disc. 2010; 9:775–789.
9. Koshizuka K, Hanazawa T, Kikkawa N, Arai T, Okato A, Kurozumi A, Kato M, Katada K, Okamoto Y, Seki N. Regulation of ITGA3 by the anti-tumor miR-199 family inhibits cancer cell migration and invasion in head and neck cancer. Cancer Sci. 2017; 108:1681–1692.
10. Goto Y, Kurozumi A, Nohata N, Kojima S, Matsushita R, Yoshino H, Yamazaki K, Ishida Y, Ichikawa T, Naya Y, Seki N. The microRNA signature of patients with sunitinib failure: regulation of UHRF1 pathways by microRNA-101 in renal cell carcinoma. Oncotarget. 2016; 7:59070–59086. https://doi.org/10.18632/oncotarget.10887.
11. Nishikawa R, Chiyomaru T, Enokida H, Inoguchi S, Ishihara T, Matsushita R, Goto Y, Fukumoto I, Nakagawa M, Seki N. Tumour-suppressive microRNA-29s directly regulate LOXL2 expression and inhibit cancer cell migration and invasion in renal cell carcinoma. FEBS Lett. 2015; 589:2136–2145.
12. Nohata N, Sone Y, Hanazawa T, Fuse M, Kikkawa N, Yoshino H, Chiyomaru T, Kawakami K, Enokida H, Nakagawa M, Shozu M, Okamoto Y, Seki N. miR-1 as a tumor suppressive microRNA targeting TAGLN2 in head and neck squamous cell carcinoma. Oncotarget. 2011; 2:29–42. https://doi.org/10.18632/oncotarget.213.
13. Idichi T, Seki N, Kurahara H, Yonemori K, Osako Y, Arai T, Okato A, Kita Y, Arigami T, Mataki Y, Kijima Y, Maemura K, Natsugoe S. Regulation of actin-binding protein ANLN by antitumor miR-217 inhibits cancer cell aggressiveness in pancreatic ductal adenocarcinoma. Oncotarget. 2017; 8:53180–53193. https://doi.org/10.18632/oncotarget.18261.
14. Mataki H, Seki N, Mizuno K, Nohata N, Kamikawaji K, Kumamoto T, Koshizuka K, Goto Y, Inoue H. Dual-strand tumor-suppressor microRNA-145 (miR-145-5p and miR-145-3p) coordinately targeted MTDH in lung squamous cell carcinoma. Oncotarget. 2016; 7:72084–72098. https://doi.org/10.18632/oncotarget.12290.
15. Koshizuka K, Nohata N, Hanazawa T, Kikkawa N, Arai T, Okato A, Fukumoto I, Katada K, Okamoto Y, Seki N. Deep sequencing-based microRNA expression signatures in head and neck squamous cell carcinoma: dual strands of pre-miR-150 as antitumor miRNAs. Oncotarget. 2017; 8:30288–30304. https://doi.org/10.18632/oncotarget.16327.
16. Itesako T, Seki N, Yoshino H, Chiyomaru T, Yamasaki T, Hidaka H, Yonezawa T, Nohata N, Kinoshita T, Nakagawa M, Enokida H. The microRNA expression signature of bladder cancer by deep sequencing: the functional significance of the miR-195/497 cluster. PLoS One. 2014; 9:e84311.
17. Goto Y, Kojima S, Nishikawa R, Kurozumi A, Kato M, Enokida H, Matsushita R, Yamazaki K, Ishida Y, Nakagawa M, Naya Y, Ichikawa T, Seki N. MicroRNA expression signature of castration-resistant prostate cancer: the microRNA-221/222 cluster functions as a tumour suppressor and disease progression marker. Br J Cancer. 2015; 113:1055–1065.
18. Nishikawa R, Goto Y, Kojima S, Enokida H, Chiyomaru T, Kinoshita T, Sakamoto S, Fuse M, Nakagawa M, Naya Y, Ichikawa T, Seki N. Tumor-suppressive microRNA-29s inhibit cancer cell migration and invasion via targeting LAMC1 in prostate cancer. Int J Oncol. 2014; 45:401–410.
19. Kinoshita T, Nohata N, Hanazawa T, Kikkawa N, Yamamoto N, Yoshino H, Itesako T, Enokida H, Nakagawa M, Okamoto Y, Seki N. Tumour-suppressive microRNA-29s inhibit cancer cell migration and invasion by targeting laminin-integrin signalling in head and neck squamous cell carcinoma. Br J Cancer. 2013; 109:2636–2645.
20. Mizuno K, Seki N, Mataki H, Matsushita R, Kamikawaji K, Kumamoto T, Takagi K, Goto Y, Nishikawa R, Kato M, Enokida H, Nakagawa M, Inoue H. Tumor-suppressive microRNA-29 family inhibits cancer cell migration and invasion directly targeting LOXL2 in lung squamous cell carcinoma. Int J Oncol. 2016; 48:450–460.
21. Fukumoto I, Kikkawa N, Matsushita R, Kato M, Kurozumi A, Nishikawa R, Goto Y, Koshizuka K, Hanazawa T, Enokida H, Nakagawa M, Okamoto Y, Seki N. Tumor-suppressive microRNAs (miR-26a/b, miR-29a/b/c and miR-218) concertedly suppressed metastasis-promoting LOXL2 in head and neck squamous cell carcinoma. J Hum Genet. 2016; 61:109–118.
22. Wu L, Zhu Y. The function and mechanisms of action of LOXL2 in cancer (Review). Int J Mol Med. 2015; 36:1200–1204.
23. Desgrosellier JS, Cheresh DA. Integrins in cancer: biological implications and therapeutic opportunities. Nat Rev Cancer. 2010; 10:9–22.
24. Gilcrease MZ. Integrin signaling in epithelial cells. Cancer Lett. 2007; 247:1–25.
25. Kinoshita T, Hanazawa T, Nohata N, Kikkawa N, Enokida H, Yoshino H, Yamasaki T, Hidaka H, Nakagawa M, Okamoto Y, Seki N. Tumor suppressive microRNA-218 inhibits cancer cell migration and invasion through targeting laminin-332 in head and neck squamous cell carcinoma. Oncotarget. 2012; 3:1386–1400. https://doi.org/10.18632/oncotarget.709.
26. Marinkovich MP. Tumour microenvironment: laminin 332 in squamous-cell carcinoma. Nat Rev Cancer. 2007; 7:370–380.
27. Nakayama M, Sato Y, Okamoto M, Hirohashi S. Increased expression of laminin-5 and its prognostic significance in hypopharyngeal cancer. Laryngoscope. 2004; 114:1259–1263.
28. Yuen HW, Ziober AF, Gopal P, Nasrallah I, Falls EM, Meneguzzi G, Ang HQ, Ziober BL. Suppression of laminin-5 expression leads to increased motility, tumorigenicity, and invasion. Exp Cell Res. 2005; 309:198–210.
29. Humphries JD, Byron A, Humphries MJ. Integrin ligands at a glance. J Cell Sci. 2006; 119:3901–3903.
30. Harburger DS, Calderwood DA. Integrin signalling at a glance. J Cell Sci. 2009; 122:159–163.
31. Ramovs V, Te Molder L, Sonnenberg A. The opposing roles of laminin-binding integrins in cancer. Matrix Biol. 2017; 57–58:213–243.
32. He B, Xiao YF, Tang B, Wu YY, Hu CJ, Xie R, Yang X, Yu ST, Dong H, Zhao XY, Li JL, Yang SM. hTERT mediates gastric cancer metastasis partially through the indirect targeting of ITGB1 by microRNA-29a. Sci Rep. 2016; 6:21955.
33. Moreira FC, Assumpcao M, Hamoy IG, Darnet S, Burbano R, Khayat A, Goncalves AN, Alencar DO, Cruz A, Magalhaes L, Araujo W Jr, Silva A, Santos S, et al. MiRNA expression profile for the human gastric antrum region using ultra-deep sequencing. PLoS One. 2014; 9:e92300.
34. Kurozumi A, Goto Y, Matsushita R, Fukumoto I, Kato M, Nishikawa R, Sakamoto S, Enokida H, Nakagawa M, Ichikawa T, Seki N. Tumor-suppressive microRNA-223 inhibits cancer cell migration and invasion by targeting ITGA3/ITGB1 signaling in prostate cancer. Cancer Sci. 2016; 107:84–94.
35. Laudato S, Patil N, Abba ML, Leupold JH, Benner A, Gaiser T, Marx A, Allgayer H. P53-induced miR-30e-5p inhibits colorectal cancer invasion and metastasis by targeting ITGA6 and ITGB1. Int J Cancer. 2017; 141:1879–1890.
36. Ding Y, Pan Y, Liu S, Jiang F, Jiao J. Elevation of MiR-9-3p suppresses the epithelial-mesenchymal transition of nasopharyngeal carcinoma cells via down-regulating FN1, ITGB1 and ITGAV. Cancer Biol Ther. 2017:1–11.
37. Carpenter BL, Chen M, Knifley T, Davis KA, Harrison SM, Stewart RL, O’Connor KL. Integrin alpha6beta4 Promotes Autocrine Epidermal Growth Factor Receptor (EGFR) Signaling to Stimulate Migration and Invasion toward Hepatocyte Growth Factor (HGF). J Biol Chem. 2015; 290:27228–27238.
38. Tesfay L, Schulz VV, Frank SB, Lamb LE, Miranti CK. Receptor tyrosine kinase Met promotes cell survival via kinase-independent maintenance of integrin alpha3beta1. Mol Biol Cell. 2016; 27:2493–2504.
39. Koshizuka K, Hanazawa T, Fukumoto I, Kikkawa N, Matsushita R, Mataki H, Mizuno K, Okamoto Y, Seki N. Dual-receptor (EGFR and c-MET) inhibition by tumor-suppressive miR-1 and miR-206 in head and neck squamous cell carcinoma. J Hum Genet. 2017; 62:113–121.
40. Kalyankrishna S, Grandis JR. Epidermal growth factor receptor biology in head and neck cancer. J Clin Oncol. 2006; 24:2666–2672.
41. Sacco AG, Cohen EE. Current Treatment Options for Recurrent or Metastatic Head and Neck Squamous Cell Carcinoma. J Clin Oncol. 2015; 33:3305–3313.
42. Bardelli A, Corso S, Bertotti A, Hobor S, Valtorta E, Siravegna G, Sartore-Bianchi A, Scala E, Cassingena A, Zecchin D, Apicella M, Migliardi G, Galimi F, et al. Amplification of the MET receptor drives resistance to anti-EGFR therapies in colorectal cancer. Cancer Disc. 2013; 3:658–673.
43. Eke I, Zscheppang K, Dickreuter E, Hickmann L, Mazzeo E, Unger K, Krause M, Cordes N. Simultaneous beta1 integrin-EGFR targeting and radiosensitization of human head and neck cancer. J Natl Cancer Inst. 2015; 107.
44. Yao ES, Zhang H, Chen YY, Lee B, Chew K, Moore D, Park C. Increased beta1 integrin is associated with decreased survival in invasive breast cancer. Cancer Res. 2007; 67:659–664.
45. Ju L, Zhou C. Association of integrin beta1 and c-MET in mediating EGFR TKI gefitinib resistance in non-small cell lung cancer. Cancer Cell Int. 2013; 13:15.
46. Xu Z, Zou L, Ma G, Wu X, Huang F, Feng T, Li S, Lin Q, He X, Liu Z, Cao X. Integrin beta1 is a critical effector in promoting metastasis and chemo-resistance of esophageal squamous cell carcinoma. Am J Cancer Res. 2017; 7:531–542.
47. Anaya J. OncoLnc: linking TCGA survival data to mRNAs, miRNAs, and lncRNAs. Peer J Comp Sci. 2016; 2:e67.
48. Gao J, Aksoy BA, Dogrusoz U, Dresdner G, Gross B, Sumer SO, Sun Y, Jacobsen A, Sinha R, Larsson E, Cerami E, Sander C, Schultz N. Integrative analysis of complex cancer genomics and clinical profiles using the cBioPortal. Sci Signal. 2013; 6:pl1.