
INTRODUCTION
Pancreatic cancer (PC) is a highly sinister disease with an extremely poor prognosis and a five-year survival rate of less than 5% [1]. PC is the fourth leading cause of cancer-related death for males and females in the United States with the least improvement in survival during the past 30 years [1, 2]. Although some dietary factors have been considered to be associated with PC risk, no dietary factors have been convincingly established for PC as reported by the Continuous Update Project of the World Cancer Research Fund (WCRF) in 2012 [3]. Consumption of fruit and vegetable was often considered to be protective against PC. However, most of the data are derived from case-control studies, which may be subject to inaccurate measurements of dietary consumption and recall bias. Additionally, citrus and cruciferous vegetables, as important fruits and vegetables, were considered to be protective against cancers [4–6], but there have been no further investigations in PC. The Continuous Update Project of WCRF in 2012 (which is based on prospective studies published through 2011) reported that the evidence for fruit and vegetable consumption in reducing PC risk was “limited – no conclusion” because of the inconsistent data. Wu et al [7] carried out a meta-analysis and found that fruit and vegetable intake is associated inversely with pancreatic cancer risk. However, the authors acknowledged that there was significant heterogeneity in the combined evaluations (cohort studies and case-control studies) and study design may play a key role for their findings (significant inverse associations were observed in the analysis of case-control studies but not cohort studies). Koushik et al [8] carried out a pooled analysis of cohort studies and found that during adulthood, fruit and vegetable intake is not associated with a reduced pancreatic cancer risk. Nevertheless, the included studies were published up to 2005 in Koushik et al study [8] and high-quality studies have appeared during the last 11 years (approximately).
Therefore, in consideration of the large burden of PC worldwide and the controversial evidence, we conducted an updated meta-analysis of prospective studies based on a quantitative amalgamation of the eligible data with the following objectives: (1) to gain a better understanding of the associations of fruit and vegetable consumption with PC risk; (2) to further examine the associations according to subtype analyses for citrus fruit and cruciferous vegetables and subgroup analyses for gender and other factors, including geographic area, sample size, publication year, periods of follow-up and main adjustments; and (3) to further evaluate the dose-response associations between fruit and vegetable consumption and PC risk.
RESULTS
Literature selection, study characteristics and quality scores
Figure 1 shows the flowchart of the search strategy for selecting the eligible studies. A total of 4416 studies were initially identified for this meta-analysis; 2853 studies were selected for further consideration after excluding 1163 studies for duplication. Of the 2853 identified, 2761 studies were excluded after reviewing the titles and abstracts, and 81 studies were further excluded after reviewing the full-text article. Finally, 12 studies met the eligibility criteria after including 1 study from the reference review. The range of the quality scores was 6–9 for PC and the mean study quality score was 7.33 (Table 1). The 12 selected studies were from 13 countries in North America, Europe and Asia with 1,263,396 participants and 3,300 cases (Table 1). The references and exclusion reasons for the excluded studies were listed in Table 2.
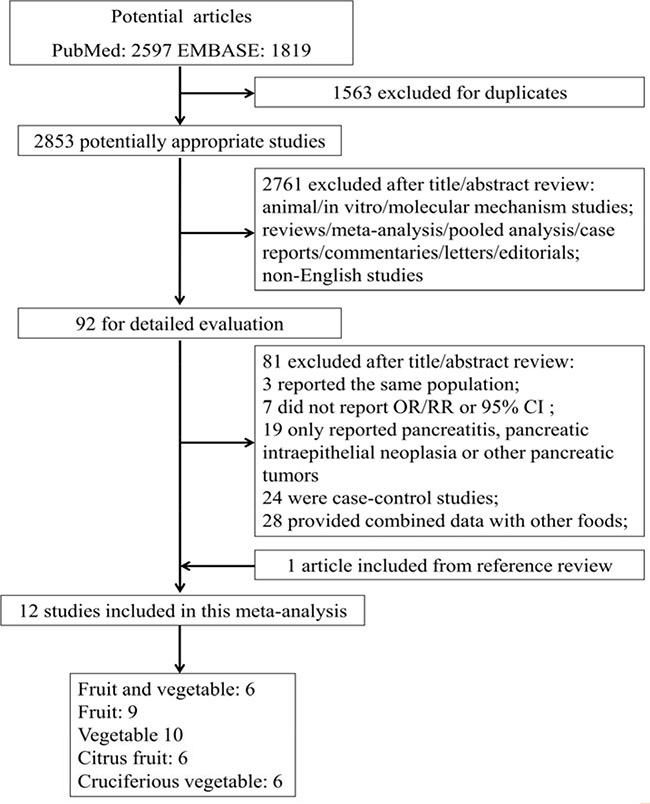
Figure 1: Flowchart of the processs for the identification of relevant studies.
Table 1: Baseline characteristics of studies investigating fruit and vegetable consumption and pancreatic cancer risk
First author, year, country or region |
Cases/participants |
Study population |
Study period |
Dietary assessment |
Exposure categories |
Type, RR (95% CI) |
Controlled variables |
Quality score |
|---|---|---|---|---|---|---|---|---|
Shibata 1994 USA [15] |
63/13979 |
M & F |
1981–1990 |
FFQ-59 |
Tertile |
Fruit, 0.89 (0.49–1.62) |
Age, sex, smoking |
6 |
Stolzenberg-solomon 2002 Finland [16] |
163/27111 |
M |
1985–1997 |
FFQ-276 |
Quintile |
Fruit and vegetable |
age, smoking, energy intake |
6 |
Inoue 2003 Japan (nested case-control) [26] |
200/2000 |
M & F |
1988–1999 |
FFQ-NS |
Less versus every day |
Vegetable, 0.71 (0.51–0.99) |
age, gender, family history of pancreatic cancer, history of diabetes, physical exercise, bowel habits and alcohol |
7 |
Larsson 2006 Sweden [17] |
135/81922 |
M & F |
1998–2004 |
FFQ-96 |
Quartile |
Fruit and vegetable 1.13 (0.66–1.94) Fruit, 1.10 (0.64–1.88) Vegetable, 1.08 (0.63–1.85) |
age, sex, education, BMI, physical activity, smoking, history of diabetes, multivitamin supplement use, energy intake, alcohol |
7 |
Nothlings1 2007 USA [27] |
434/162150 |
M & F |
1993–2002 |
FFQ-NS |
Quartile |
Fruit, 1.42 (1.05–1.93) |
age, sex, ethnicity, family history of pancreatic cancer, smoking, intakes of red meat and processed meat, energy intake and BMI |
8 |
Nothlings2 2007 USA [28] |
529/183522 |
M & F |
1993–2002 |
FFQ-180 |
Quintile |
Vegetable, 0.86 (0.65–1.14) |
age, sex, ethnicity, history of diabetes, family history of pancreatic cancer, smoking, intakes of red meat and processed meat, energy intake and BMI |
8 |
Bobe 2008 Finland [29] |
306/27111 |
M |
1985–2004 |
FFQ-276 |
Quintile |
Fruit, 0.95 (0.67–1.34) |
age, smoking, history of diabetes and energy-adjusted saturated fat intake |
7 |
Vrieling 2009 Europe [30] |
555/478400 |
M & F |
1991–2000 |
FFQ-NS |
Quartile |
Fruit and vegetable, 0.92 (0.68–1.25) |
age, sex, energy, BMI, history of diabetes, smoking |
8 |
George 2009 USA [31] |
713/288109 |
M |
1995–2003 |
FFQ-124 |
Quintile |
Fruit, 0.73 (0.57–0.95) Vegetable, 1.03 (0.81–1.32) |
age, smoking, energy intake, BMI, alcohol, physical activity, education, race, marital status, family history of cancers and fruit intake |
8 |
Inoue-choi 2011 USA [32] |
256/34642 |
F |
1991–2007 |
FFQ-42 |
Quintile |
Fruit and vegetable, 1.18 (0.79–1.77) Fruit, 0.98 (0.64–1.50) Vegetable, 1.21 (0.81–1.80) |
age, race, alcohol, education, smoking and physical activity |
7 |
Heinen 2011 Netherlands [33] |
406/120852 |
M & F |
1986–2002 |
FFQ-150 |
Quintile |
Fruit and vegetable, 0.89 (0.64–1.24) Fruit, 0.90 (0.66–1.24) Vegetable, 1.23 (0.86–1.75) |
age, sex, smoking, BMI, history of diabetes, family history of pancreatic cancer, energy intake, red meat, coffee and alcohol |
9 |
Shigihara 2014 Japan [18] |
137/32859 |
M & F |
1994–2005 |
FFQ-40 |
Tertile |
Fruit and vegetable, 0.57 (0.39–1.11) Fruit, 0.64 (0.32–1.20) Vegetable, 0.67 (0.33–1.35) |
age, BMI, family history of cancer, history of diabetes, smoking, alcohol, physical activity, education, marital status, job status, meat and energy intake |
7 |
FFQ: food frequency questionnaire (food items); NS: not specified; BMI: body mass index; M: males; F: females.
Table 2: Exclusion table for meta-analysis of fruit and vegetable consumption and pancreatic cancer risk
Excluded studies |
Country |
Study design |
Study population |
Exposure type |
Exclusion reason |
|---|---|---|---|---|---|
Mills 1988 [34] |
USA |
Prospective cohort |
M & F |
Citrus fruit |
Mortality |
Coughlin 2000 [35] |
USA |
Prospective cohort |
M & F |
Citrus fruit Vegetable |
Mortality Mortality |
Appleby 2002 [36] |
UK |
Prospective cohort |
M & F |
Fruit |
Mortality |
Stolzenberg-solomon 2002 [16] |
Finland |
Prospective cohort |
M |
Fruit Citrus fruit Vegetable |
Superseded by Bobe 2008 Superseded by Bobe 2008 Superseded by Bobe 2008 |
Sauvaget 2003 [37] |
Japan |
Prospective cohort |
M & F |
Fruit |
Mortality |
Khan 2004 [38] |
Japan |
Prospective cohort |
M & F |
Fruit |
Mortality |
Lin 2006 [39] |
Japan |
Prospective cohort |
M & F |
Fruit Citrus fruit Vegetable Cruciferous vegetable |
Mortality Mortality Mortality Mortality |
M: males; F: females.
The association between consumption of fruits and vegetables with PC risk
Highest vs lowest consumption
Six studies showed the results for the highest vs lowest consumption. A random-effects model yielded the results (Figure 2A) that fruit and vegetable consumption was not associated with PC risk (RR = 0.92, 95% CI = 0.78–1.08, P = 0.31) without heterogeneity (P = 0.44, I2 = 0%) (Table 3).
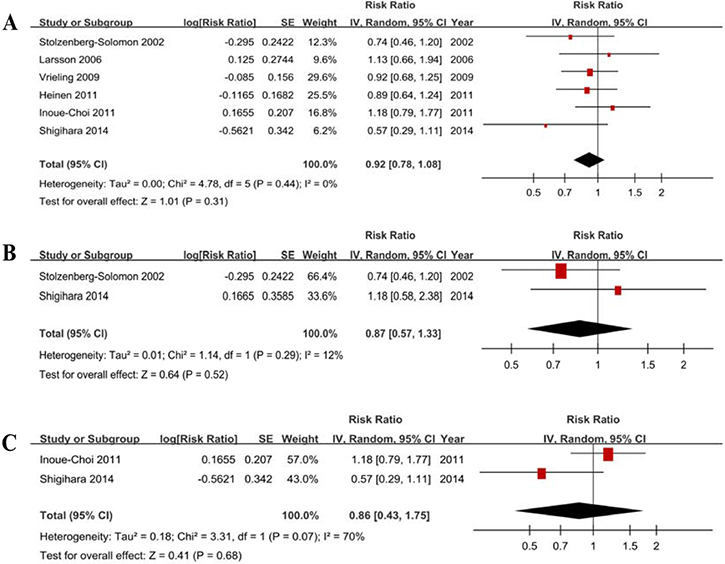
Figure 2: Forest plots of fruits and vegetables consumption (highest vs lowest category) and PC risk. (A) Total estimate. (B) In men. (C) In women.
Table 3: Subgroup analyses of fruit and vegetable consumption and pancreatic cancer risk
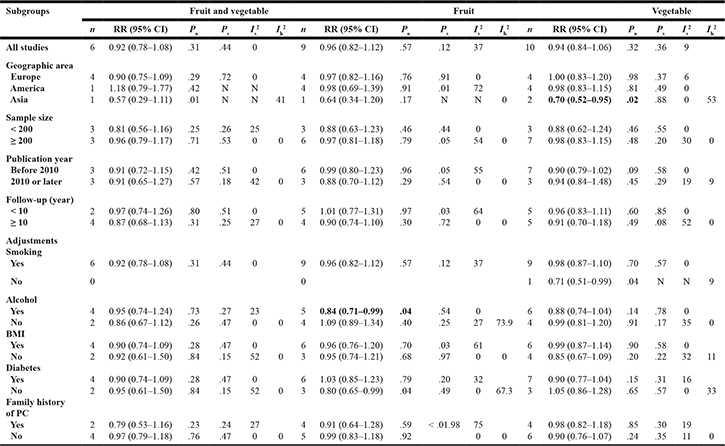
BMI: body mass index. Po: test for over effect. Ps: P value for heterogeneity within each subgroup. Is2: I2 (%) value for heterogeneity within each subgroup. Ih2: I2 (%) value for heterogeneity between subgroups. N: not applicable. Bold text indicates statistical significance.
Dose-response analysis
Five studies were included, and the RR per 100 g/d increase in fruit and vegetable consumption was 1.00 (0.98–1.02) without heterogeneity (P = 0.63, I2 = 0%). We further checked for nonlinearity of the dose-response relationship between fruit and vegetable consumption and PC risk, and there was no evidence of a potential nonlinear relationship (Pnonlinearity = 0.56).
Heterogeneity
There was no significant heterogeneity (P = 0.44, I2 = 0%) of the included studies. Subgroup analyses showed that the differences in the RRs were not significant for the geographic area, sample size, publication year, periods of follow-up and all of the adjustable variables (Table 3).
Publication bias
The funnel plot (Supplementary Figure 1A), Egger’s test (P = 0.511) and Begg’s test (P = 0.452) did not suggest significant evidence of publication bias. The sensitivity analysis suggested that the change in recalculated RRs was not significant, with a range from 0.87 (0.73–1.05) when excluding Inoue-Choi 2011 to 0.95 (0.80–1.12) when excluding Shigihara 2014.
Subgroup analysis according to gender
Two studies with men and 2 studies with women were included. The results (Table 4, Figure 2B, Figure 2C) indicated that fruit and vegetable consumption is not associated with PC risk in men (RR = 0.87, 95% CI = 0.57–1.33) without heterogeneity (P = 0.29, I2 = 12%) and in women (RR = 0.86, 95% CI = 0.43–1.75) with heterogeneity (P = 0.07, I2 = 70%).
Table 4: Subgroup analyses of pancreatic cancer risk according to gender
Subgroups |
n |
OR (95% CI) |
Po |
Ph |
I2 (%) |
|---|---|---|---|---|---|
Fruits and vegetables |
|||||
Male |
2 |
0.87 (0.57–1.33) |
.52 |
.29 |
12 |
Female |
2 |
0.86 (0.43–1.75) |
.68 |
.07 |
70 |
Fruits |
|||||
Male |
3 |
0.80 (0.66–0.98) |
.03 |
.50 |
0 |
Female |
3 |
0.99 (0.72–1.36) |
.95 |
.21 |
35 |
Vegetables |
|||||
Male |
4 |
0.86 (0.70–1.07) |
.18 |
.28 |
22 |
Female |
4 |
0.89 (0.71–1.13) |
.34 |
.33 |
12 |
Po: test for over effect. Ph: P value for heterogeneity between subgroups. I2: I2 value for heterogeneity within each subgroup.
The association between fruits consumption with PC risk
Highest vs lowest consumption
Nine studies showed the results for the highest vs lowest consumption. A random-effects model yielded the results (Figure 3A) that fruit consumption was not associated with PC risk (RR = 0.96, 95% CI = 0.82–1.12, P = 0.57) without heterogeneity (P = 0.12, I2 = 37%) (Table 3).
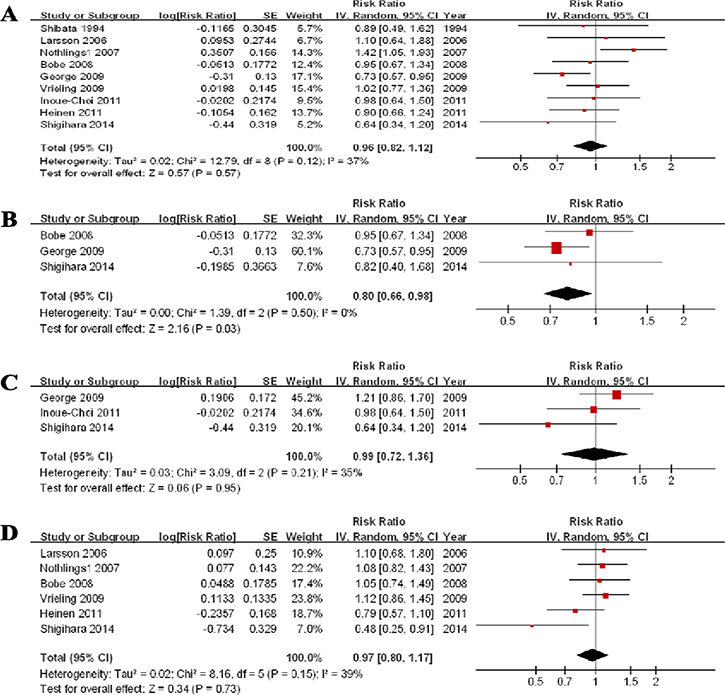
Figure 3: Forest plots of fruits consumption (highest vs lowest category) and PC risk. (A) Total estimate. (B) In men. (C) In women. (D) for citrus fruit.
Dose-response analysis
Eight studies were eligible, and the RR per 100 g/d increase in fruit consumption was 1.01 (0.97–1.05) without heterogeneity (P = 0.47, I2 = 0%). We further checked for nonlinearity of the dose-response relationship, and there was no evidence of a potential nonlinear relationship between fruit consumption and PC risk (Pnonlinearity = 0.15).
Heterogeneity
There was no significant heterogeneity (P = 0.12, I2 = 37%) of the included studies. Subgroup analyses showed that the differences in the RRs were not significant for the geographic area, sample size, publication year, periods of follow-up and all of the adjustable variables except for alcohol (RR = 0.81, 95% CI = 0.71–0.99) (Table 3).
Publication bias
The funnel plot (Supplementary Figure 1B), Egger’s test (P = 0.911) and Begg’s test (P = 0.917) did not suggest significant evidence of publication bias. The sensitivity analysis suggested that the change in recalculated RRs was not significant, with a range from 0.89 (0.78–1.01) when excluding Nothling 2007 to 1.02 (0.89–1.08) when excluding George 2009.
Subgroup analysis according to gender
Three studies for men and 3 studies for women were included. The results (Table 4, Figure 3B, Figure 3C) indicated that fruit consumption is not associated with PC risk in women (RR = 0.99, 95% CI = 0.72–1.36) without significant heterogeneity (P = 0.21, I2 = 35%). An RR of 0.80 (0.66–0.98) suggested a significant association between fruit consumption and PC risk in men without heterogeneity (P = 0.50, I2 = 0%).
Subtype analysis for citrus fruit
Six studies were eligible and, the RR was 0.97 (0.80–1.17) without significant heterogeneity (P = 0.15, I2 = 39%) (Figure 3D). The sensitivity analysis suggested no significant change in the recalculated RRs, with a range from 0.92 (0.73–1.16) when excluding Vrieling 2009 to 1.03 (0.89–1.18) when excluding Shigihara 2014. The funnel plot (Supplementary Figure 1C), Egger’s test (P = 0.151) and Begg’s test (P = 0.133) suggested no significant evidence of publication bias.
The association between fruits consumption with PC risk
Highest vs lowest consumption
Ten studies showed the results for the highest vs lowest consumption. A random-effects model yielded the results that vegetable consumption was not associated with PC risk (RR = 0.94, 95% CI = 0.84–1.06, P = 0.32) without heterogeneity (P = 0.36, I2 = 9%) (Figure 4A, Table 3).
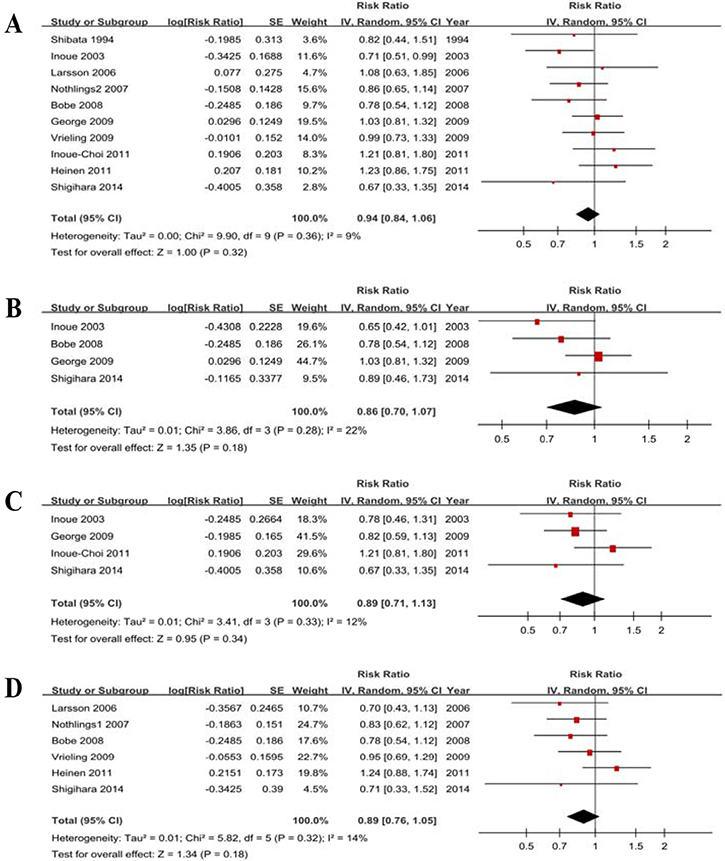
Figure 4: Forest plots of vegetables consumption (highest vs lowest category) and PC risk. (A) Total estimate. (B) In men. (C) In women. (D) for cruciferous vegetables.
Dose-response analysis
Eight studies were eligible, and the RR per 100 g/d increase in vegetable consumption was 1.00 (0.97–1.03) without heterogeneity (P = 0.40, I2 = 4%) (Figure 5). We further checked for nonlinearity of the dose-response relationship between vegetable consumption and PC risk, and there was no evidence of a potential nonlinear relationship (Pnonlinearity = 0.76).
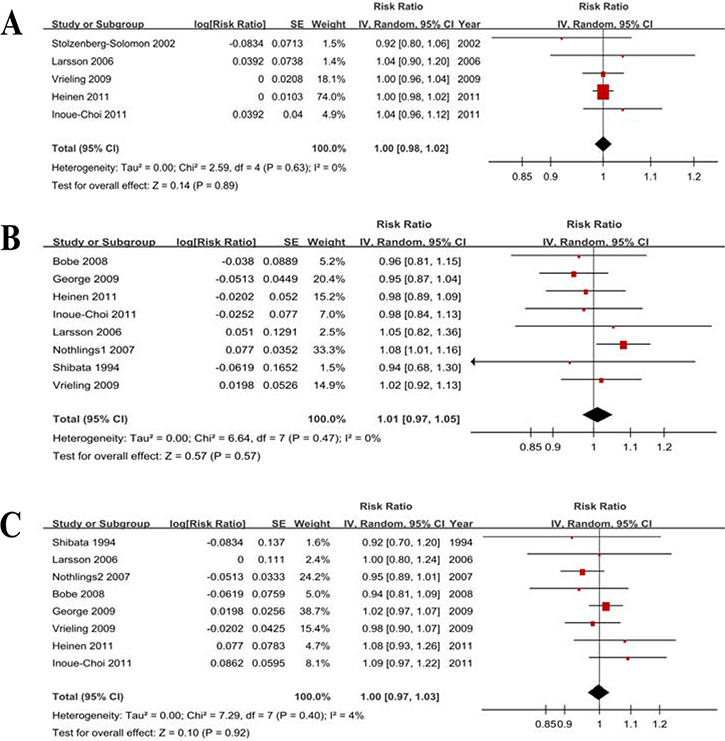
Figure 5: Forest plots of dose-response analyses. (A) Fruits and vegetables. (B) Fruit. (C) Vegetables.
Heterogeneity
There was no heterogeneity (P = 0.36, I2 = 9%) of the included studies. Subgroup analyses showed that the differences in the RRs were not significant for geographic area, sample size, publication year, periods of follow-up and all of the adjustable variables (Table 3).
Publication bias
The funnel plot (Supplementary Figure 1D), Egger’s test (P = 0.649) and Begg’s test (P = 0.721) did not suggest significant evidence of publication bias. The sensitivity analysis suggested that the change in the recalculated RRs was not significant, with a range from 0.91 (0.81–1.03) when excluding Heinen 2011 to 0.98 (0.87–1.10) when excluding Inoue 2003.
Subgroup analysis according to gender
Four studies for men and 4 studies for women were included. The results (Table 4, Figure 4B, Figure 4C) indicated that vegetable consumption is not associated with PC risk in men (RR = 0.86, 95% CI = 0.70–1.07) without heterogeneity (P = 0.28, I2 = 22%) and in women (RR = 0.89, 95% CI = 0.71–1.13) without heterogeneity (P = 0.33, I2 = 12%).
Subtype analysis for cruciferous vegetable
Six studies were eligible, and the RR was 0.89 (0.76–1.05) without heterogeneity (P = 0.32, I2 = 14%) (Figure 4D). The sensitivity analysis suggested a significant change in the recalculated RRs, with a range from 0.83 (0.70–0.98) when excluding Heinen 2011 to 0.92 (0.75–1.11) when excluding Bobe 2008. The funnel plot (Supplementary Figure 1E), Egger’s test (P = 0.425) and Begg’s test (P = 0.452) suggested no significant evidence of publication bias.
DISCUSSION
In general, fruit and vegetable consumption has been reported to be protective against diabetes [9], cardiovascular disease [10], stroke [11] and some cancers [12, 13]. However, the results were inconsistent in epidemiological studies [14]. Although many case-control studies have suggested inverse associations with the consumption of both fruits and vegetables, bias is possible in these studies due to recall and selection between cases and controls. This evidence was not supported by many cohort studies [14].
Our findings provide more detailed evidence that high total consumption of fruits and vegetables, fruits, vegetables, citrus fruit or cruciferous vegetables is not associated with a decreased risk of PC overall; although increased consumption of fruits but not vegetables is associated with a lower PC risk in men but not in women, the included studies are limited. Furthermore, dose-response analyses suggested that there are no significant dose-response relationships between a 100 g/d increment in fruit and vegetable consumption and PC risk. Additionally, the results of subgroup analyses and subtype analyses were consistent with the original analyses. Overall, our analyses based on prospective studies showed that there was no evidence of associations between fruit and vegetable consumption and pancreatic cancer risk, and the detailed findings including subgroup analyses and subtype analyses further clarify the associations between fruit and vegetable consumption and PC risk and can be used as a reference for the update of dietary guidelines.
Study strengths and limitations
Our study had several strengths. The first strength is that a long duration of the follow-up and the large sample size of the included studies provided robust evidence to date and increased the statistical power. Second, included studies were identified from 13 countries in Europe, North America and Asia, which increased the statistical generalizability. Third, detailed subgroup analyses were conducted according to the main potential confounders of the studies and main adjustable variables of PC, including gender. These independent results increased the significant power and provided more detailed data of reference significance for dietary guidelines concerning PC worldwide. Fourth, we performed dose-response analyses in addition to simply performing comparisons of the lowest versus highest categories, which further verified our results. Fifth, we conducted further subtype analyses for the two main types of fruits and vegetables reported: citrus fruit and cruciferous vegetables; these analyses strengthened our findings in the details. Finally, the heterogeneity between the studies was not statistically significant in all of the analyses except the analysis of fruits and vegetables in women. Additionally, publication bias was negligible based on the results of the funnel plots, Egger’s tests, Begg’s tests and sensitivity analyses. These statistical results increased reliability of our data.
Several limitations of this study must be taken into consideration. First, the included studies were observational studies, which were liable to residual confounding and other unmeasured factors. Nevertheless, the main confounders were adjusted in most included studies, and we further conducted subgroup analyses to assess the effects of these confounders, including sex, smoking, alcohol use, body mass index, family history of PC and history of diabetes mellitus. In general, these findings were similar to the summary estimates and were consistent for each of the subgroup analyses except for alcohol and fruit consumption. Nevertheless, storage conditions, production methods, cooking methods and nutrient content might be different among the included studies, and measurement errors to assess dietary consumption can lead to bias; and we cannot thoroughly exclude potential residual confounding.
Second, the exposure ranges from the lowest to highest categories were different among the included studies, which contributed to incomparable results and heterogeneity to some extent. However, we adopted and pooled the RRs for the comparison of the highest versus lowest category, and the dose-response analyses verified the results. Additionally, there was no statistically significant heterogeneity in all of the analyses except the analysis of fruits and vegetables in women.
Third, although we further explored the associations between the consumption of citrus fruit or cruciferous vegetables and PC risk, there were no subtype analyses for other types of fruits and vegetables. Therefore, our findings should not be used to analyze other specified fruits or vegetables. Additionally, because we only focused on PC, the available results should not be used to determine associations with pancreatic intraepithelial neoplasia and pancreatic benign tumors.
Last but not least, the quality of two included studies was not high [15, 16] and the sample size of several studies was not large (< 200 cases) [15–18] despite meeting the eligibility criteria. Nevertheless, the detailed subgroup analyses addressed these issues and showed that the separate estimates were consistent with the overall results.
Last but not least, the dietary information of all of the included studies was limited to middle-aged and older persons. The average ages were more than 50 years old in all of the studies, and most of the subjects were older than 60 years of age. Our findings cannot capture the pertinent exposure period of whether fruit and vegetable consumption during childhood, adolescence or early adulthood may be protective against PC.
MATERIALS AND METHODS
Selection criteria
1. Prospective cohort studies and nested case-control studies were included.
2. Histological features that were not consistent with the diagnostic gold standard of PC such as pancreatic benign tumors and pancreatitis were excluded.
3. Systematic reviews, meta-analyses, narrative reviews, pooled analyses were excluded.
4. Comments, editorials, letters, case reports were excluded.
5. Studies in which only the abstract could be obtained were excluded.
6. Data that could not be combined or that were incomplete were excluded.
7. Studies were limited to those involving humans; and the publication language of the included studies was limited to English.
8. The highest quality studies, the largest sample sizes and the most recent studies when identifying studies with the same patient cohort were selected.
Search strategy
We comprehensively identified eligible studies through searching the PubMed and EMBASE databases up to March 2017 using the following search terms: “fruit”, “fruits”, “vegetable”, “vegetables”, “diet”, “dietary”, “food” and “foods” in combination with “gastrointestinal/digestive/alimentary/pancreatic/pancreas”. We identified additional literature by manually searching the reference lists of the reviews and the extracted studies. The two sets of keywords were combined individually. The eligibility criteria were judged independently by two authors (ZZ, PY).
Study quality
Two researchers (ZZ, PY) independently assessed the study quality using the Newcastle-Ottawa Scale (NOS) [19]. The NOS is judged on three parameters: the elucidation of the exposure or outcomes of interest for case-control or cohort studies, the selection of the study populations and the comparability of the populations. The maximum score was 9 stars, with 7 or more stars indicating a high-quality study [19, 20].
Data extraction
Two researchers (ZZ, PY) independently extracted primary relevant data from the studies. Disagreement was resolved by reaching a consensus. The first author, country, year of publication, study period, study population, method of dietary assessment, dietary exposure categories, type of dietary exposure measured, adjusted RR (95% CI) (highest to lowest), adjustments and NOS score of each study were summarized and shown in a data extraction sheet (Table 1). For each study, we extracted the RRs and 95% CIs that reflected the greatest degree of control for potential confounders.
Statistical analysis
Random-effects models were used to quantify the associations between fruit and vegetable consumption and PC risk. The method described by Greenland and Longnecker [21] was used for the dose-response meta-analysis. Only studies that reported the RR with their corresponding 95% CIs for at least three quantitative exposure categories were included. The mean or median level of fruit and vegetable consumption for each category was assigned to the corresponding RR for each study. When the data were not reported, the midpoint of the upper and lower boundaries in each category was assigned as the average consumption. If the lowest category was open-ended, we assumed the lowest boundary to be 0 [22]. When the highest category was open-ended, we assumed the open-ended interval to be the same as that of the adjacent interval [23]. The best-fitting models were used to examine the potential nonlinear dose-response relationships between fruit and vegetable consumption and PC risk [24]. Pnonlinearity < 0.05 indicates a nonlinear model.
Heterogeneity among the studies was assessed using Cochran Q and I2 statistics according to the updated version 5.1.0 of Cochrane Handbook for Systematic Reviews of Interventions (0%–40% represents minimal to no heterogeneity). Subgroup analyses were conducted to further explore the sources of heterogeneity by publication year, geographic area, sample size, period of follow-up and adjustments (e.g., smoking, alcohol, BMI, family history of PC and history of diabetes).
We used funnel plots, Begg’s test and Egger’s test to assess publication bias (P < 0.1 was considered to indicate significant publication bias) [25]. We conducted sensitivity analyses to investigate the influence of a specific study on the pooled risk estimate by removing one study in each turn.
Data were collected and extracted using SPSS 17.0 (Chicago, Illinois, USA). STATA version 12.1 (STATA Corporation, College Station, TX) and RevMan5.3 (The Cochrane Collaboration, Oxford, UK) were used for synthesis and analysis, respectively.
CONCLUSIONS
This meta-analysis does not support significant associations between fruit and vegetable consumption and pancreatic cancer risk. The observed decrease in PC risk with fruit consumption in men needs further investigation because of limited included studies.
Author contributions
Zhanwei Zhao, Pengfei Yu and Xiangying Feng wrote the main manuscript and participated in the study design and the data analysis. Zifang Yin, Shiqi Wang and Zhaoyan Qiu participated in the study design and prepared the figures and tables. Qingchuan Zhao completed the design of the work and drafted the manuscript. All of the authors have reviewed the manuscript text. ZZ, PY and XF contributed equally to this work.
CONFLICTS OF INTEREST
There is no conflicts of interest for each author.
FUNDING
This study was supported by the National Science Foundation of China: No.81370564 and 81400662.
REFERENCES
1. Siegel R, Ma J, Zou Z, Jemal A. Cancer statistics, 2014. CA Cancer J Clin. 2014; 64:9–29.
2. Mayer RJ, Venook AP, Schilsky RL. Progress against GI cancer during the American Society of Clinical Oncology’s first 50 years. J Clin Oncol. 2014; 32:1521–1530.
3. World Cancer Research Fund/American Institute for Cancer Research. Continuous Update Project Report. Food, Nutrition, Physical Activity, and the Prevention of Pancreatic Cancer. 2012.
4. Bosetti C, Filomeno M, Riso P, Polesel J, Levi F, Talamini R, Montella M, Negri E, Franceschi S, La Vecchia C. Cruciferous vegetables and cancer risk in a network of case-control studies. Ann Oncol. 2012; 23:2198–2203.
5. Wu QJ, Xie L, Zheng W, Vogtmann E, Li HL, Yang G, Ji BT, Gao YT, Shu XO, Xiang YB. Cruciferous vegetables consumption and the risk of female lung cancer: a prospective study and a meta-analysis. Ann Oncol. 2013; 24:1918–1924.
6. Li WQ, Kuriyama S, Li Q, Nagai M, Hozawa A, Nishino Y, Tsuji I. Citrus consumption and cancer incidence: the Ohsaki cohort study. Int J Cancer. 2010; 127:1913–1922.
7. Wu QJ, Wu L, Zheng LQ, Xu X, Ji C, Gong TT. Consumption of fruit and vegetables reduces risk of pancreatic cancer: evidence from epidemiological studies. Eur J Cancer Prev. 2016; 25:196–205.
8. Koushik A, Spiegelman D, Albanes D, Anderson KE, Bernstein L, van den Brandt PA, Bergkvist L, English DR, Freudenheim JL, Fuchs CS, Genkinger JM, Giles GG, Goldbohm RA, et al. Intake of fruits and vegetables and risk of pancreatic cancer in a pooled analysis of 14 cohort studies. Am J Epidemiol. 2012; 176:373–386.
9. Carter P, Gray LJ, Troughton J, Khunti K, Davies MJ. Fruit and vegetable intake and incidence of type 2 diabetes mellitus: systematic review and meta-analysis. BMJ. 2010; 341:c4229.
10. Gan Y, Tong X, Li L, Cao S, Yin X, Gao C, Herath C, Li W, Jin Z, Chen Y, Lu Z. Consumption of fruit and vegetable and risk of coronary heart disease: a meta-analysis of prospective cohort studies. Int J Cardiol. 2015; 183:129–137.
11. He FJ, Nowson CA, MacGregor GA. Fruit and vegetable consumption and stroke: meta-analysis of cohort studies. Lancet. 2006; 367:320–326.
12. Turati F, Rossi M, Pelucchi C, Levi F, La Vecchia C. Fruit and vegetables and cancer risk: a review of southern European studies. Br J Nutr. 2015; 113:S102–S110.
13. Potter JD. Vegetables, fruit, and cancer. Lancet. 2005; 366:527–530.
14. Maisonneuve P, Lowenfels AB. Risk factors for pancreatic cancer: a summary review of meta-analytical studies. Int J Epidemiol. 2015; 44:186–198.
15. Shibata A, Mack TM, Paganini-Hill A, Ross RK, Henderson BE. A prospective study of pancreatic cancer in the elderly. Int J Cancer. 1994; 58:46–49.
16. Stolzenberg-Solomon RZ, Pietinen P, Taylor PR, Virtamo J, Albanes D. Prospective study of diet and pancreatic cancer in male smokers. Am J Epidemiol. 2002; 155:783–792.
17. Larsson SC, Hakansson N, Naslund I, Bergkvist L, Wolk A. Fruit and vegetable consumption in relation to pancreatic cancer risk: a prospective study. Cancer Epidemiol Biomarkers Prev. 2006; 15:301–305.
18. Shigihara M, Obara T, Nagai M, Sugawara Y, Watanabe T, Kakizaki M, Nishino Y, Kuriyama S, Tsuji I. Consumption of fruits, vegetables, and seaweeds (sea vegetables) and pancreatic cancer risk: the Ohsaki Cohort Study. Cancer Epidemiol. 2014; 38:129–136.
19. Stang A. Critical evaluation of the Newcastle-Ottawa scale for the assessment of the quality of nonrandomized studies in meta-analyses. Eur J Epidemiol. 2010; 25:603–605.
20. Zhang Z, Xu G, Ma M, Yang J, Liu X. Dietary fiber intake reduces risk for gastric cancer: a meta-analysis. Gastroenterology. 2013; 145:113–120.
21. Greenland S, Longnecker MP. Methods for trend estimation from summarized dose-response data, with applications to meta-analysis. Am J Epidemiol. 1992; 135:1301–1309.
22. Aune D, Lau R, Chan DS, Vieira R, Greenwood DC, Kampman E, Norat T. Nonlinear reduction in risk for colorectal cancer by fruit and vegetable intake based on meta-analysis of prospective studies. Gastroenterology. 2011; 141:106–118.
23. Ben Q, Sun Y, Chai R, Qian A, Xu B, Yuan Y. Dietary fiber intake reduces risk for colorectal adenoma: a meta-analysis. Gastroenterology. 2014; 146:689–699.
24. Royston P. A strategy for modelling the effect of a continuous covariate in medicine and epidemiology. Stat Med. 2000; 19:1831–1847.
25. Egger M, Davey SG, Schneider M, Minder C. Bias in meta-analysis detected by a simple, graphical test. BMJ. 1997; 315:629–634.
26. Inoue M, Tajima K, Takezaki T, Hamajima N, Hirose K, Ito H, Tominaga S. Epidemiology of pancreatic cancer in Japan: a nested case-control study from the Hospital-based Epidemiologic Research Program at Aichi Cancer Center (HERPACC). Int J Epidemiol. 2003; 32:257–262.
27. Nothlings U, Murphy SP, Wilkens LR, Henderson BE, Kolonel LN. Dietary glycemic load, added sugars, and carbohydrates as risk factors for pancreatic cancer: the Multiethnic Cohort Study. Am J Clin Nutr. 2007; 86:1495–1501.
28. Nothlings U, Wilkens LR, Murphy SP, Hankin JH, Henderson BE, Kolonel LN. Vegetable intake and pancreatic cancer risk: the multiethnic cohort study. Am J Epidemiol. 2007; 165:138–147.
29. Bobe G, Weinstein SJ, Albanes D, Hirvonen T, Ashby J, Taylor PR, Virtamo J, Stolzenberg-Solomon RZ. Flavonoid intake and risk of pancreatic cancer in male smokers (Finland). Cancer Epidemiol Biomarkers Prev. 2008; 17:553–562.
30. Vrieling A, Verhage BA, van Duijnhoven FJ, Jenab M, Overvad K, Tjonneland A, Olsen A, Clavel-Chapelon F, Boutron-Ruault MC, Kaaks R, Rohrmann S, Boeing H, Nothlings U, et al. Fruit and vegetable consumption and pancreatic cancer risk in the European Prospective Investigation into Cancer and Nutrition. Int J Cancer. 2009; 124:1926–1934.
31. George SM, Park Y, Leitzmann MF, Freedman ND, Dowling EC, Reedy J, Schatzkin A, Hollenbeck A, Subar AF. Fruit and vegetable intake and risk of cancer: a prospective cohort study. Am J Clin Nutr. 2009; 89:347–353.
32. Inoue-Choi M, Flood A, Robien K, Anderson K. Nutrients, food groups, dietary patterns, and risk of pancreatic cancer in postmenopausal women. Cancer Epidemiol Biomarkers Prev. 2011; 20:711–714.
33. Heinen MM, Verhage BA, Goldbohm RA, van den Brandt PA. Intake of vegetables, fruits, carotenoids and vitamins C and E and pancreatic cancer risk in The Netherlands Cohort Study. Int J Cancer. 2012; 130:147–158.
34. Mills PK, Beeson WL, Abbey DE, Fraser GE, Phillips RL. Dietary habits and past medical history as related to fatal pancreas cancer risk among Adventists. Cancer. 1988; 61:2578–2585.
35. Coughlin SS, Calle EE, Patel AV, Thun MJ. Predictors of pancreatic cancer mortality among a large cohort of United States adults. Cancer Causes Control. 2000; 11:915–923.
36. Appleby PN, Key TJ, Burr ML, Thorogood M. Mortality and fresh fruit consumption. IARC Sci Publ. 2002; 156:131–133.
37. Sauvaget C, Nagano J, Hayashi M, Spencer E, Shimizu Y, Allen N. Vegetables and fruit intake and cancer mortality in the Hiroshima/Nagasaki Life Span Study. Br J Cancer. 2003; 88:689–694.
38. Khan MM, Goto R, Kobayashi K, Suzumura S, Nagata Y, Sonoda T, Sakauchi F, Washio M, Mori M. Dietary habits and cancer mortality among middle aged and older Japanese living in hokkaido, Japan by cancer site and sex. Asian Pac J Cancer Prev. 2004; 5:58–65.
39. Lin Y, Kikuchi S, Tamakoshi A, Yagyu K, Obata Y, Inaba Y, Kurosawa M, Kawamura T, Motohashi Y, Ishibashi T. Dietary habits and pancreatic cancer risk in a cohort of middle-aged and elderly Japanese. Nutr Cancer. 2006; 56:40–49.