
INTRODUCTION
Differential gene expression analysis has been widely used to identify critical gene and pathways involved in tumorigenesis [1–3]. However, a part from differential gene expression data, there is tremendous amount of critical information in the gene expression datasets that is ignored. For example, some mutant proteins with altered functions show similar expression in diseased and healthy individuals [3]. Therefore, diagnosis or prognosis based on the expression of a single biomarker gene may not be reliable. This implies that differential co-expression and differential network analysis are more relevant as they help in understanding the underlying biological processes that are key to the disease understanding and therapy [3–8].
Another strategy to optimize gene expression data involves comparative and integrative analyses of gene expression in multiple cancer types [9, 10]. The integrative approach improves reproducibility and identifies common markers for multiple types of cancer. The multi-cancer biomarkers are more reliable and superior than cancer-specific biomarkers [11]. Genes or proteins that are directly linked are most likely to belong to the same biological pathway or function [12]. Such groups of genes or proteins that belong to the same biological pathway are called modules. A common module that is found in multiple cancers is defined as the consensus module.
Squamous cell carcinoma (SCC) is the most common histological type of head and neck cancer (HNC) and cervical cancer (CC). Both HNC and CC demonstrate similar multistep progression, where in normal squamous epithelial cells undergo dysplastic changes followed by carcinoma formation, which subsequently becomes invasive and metastatic. Moreover, human papilloma virus type 16 (HPV16) is a major pathogen in HNC and CC [13]. Therefore, in this study, we investigated consensus gene modules of HNC and CC to identify common targets for therapy of HPV16-positive HNC and CC.
RESULTS
Common differentially expressed genes of HNC and CC
The GSE6791 microarray dataset was analyzed to identify common genes that play a significant role in HNC and CC. The dataset included 54675 probes and 84 samples (42 HNC and14 normal head and neck samples as well as 20 CC and 8 normal cervical tissue samples). We analyzed only HPV16 positive samples to exclude bias because of different HPV types.
We identified significantly expressed genes separately in HNC and CC, based on Mann-Whitney U test. The rates of commonly identified genes were 43.8% and 28.9% of the detected significant genes from HNC and CC, respectively. This indicated that these two types of cancers might have similar genomic variations to some extent.
Among 3824 complete genes, 977 genes with high connectivity were used to construct the consensus module. The expression patterns of common genes in HNC and CC samples were analyzed by unsupervised hierarchical clustering (Figure 1; orange indicates low and yellow indicates high expression). The genes were classified into 2 groups based on their expression patterns in HNC and CC samples compared to their respective normal samples (Figure 1). Genes that were downregulated in HNC and CC samples than normal samples were clustered into one group, whereas genes that were upregulated in the two cancer types than corresponding normal samples were clustered into another group (Figure 1).
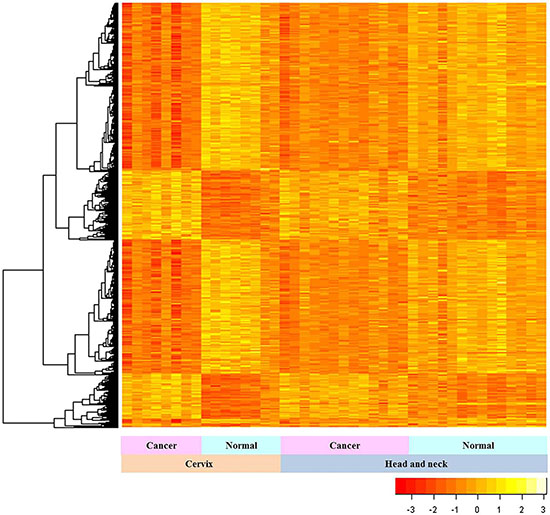
Figure 1: Gene expression patterns in HNC and CC. The expression patterns of 3824 common genes in HNC and CC samples relative to their corresponding controls are shown. The statistical analysis was performed with Mann-Whitney U test. The vertical and horizontal axes represent the gene lists and samples, respectively.
Consensus modules in HNC and CC
Next, we used the dissimilarity measure and average linkage hierarchical clustering method to construct consensus modules with common genes between HNC and CC [7, 12]. Genes in similar consensus modules were assigned a color code, whereas unassigned genes were colored grey. As shown in Figure 2A, we identified eight consensus modules that were assigned specific color codes, namely, brown (83 genes), yellow (80 genes), blue (105 genes), turquoise (141 genes), green (62 genes), red (53 genes), black (45 genes), pink (40 genes) and grey (368 genes).
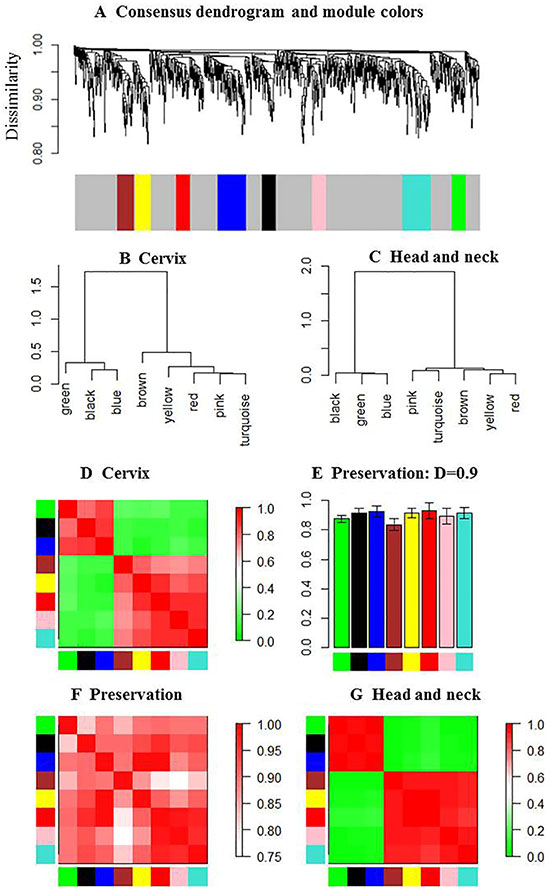
Figure 2: Eigengene network in HNC and CC. (A) Dendrogram shows hierarchical clustering of genes used to identify the consensus modules in HNC and CC samples. Branches of the dendrogram correspond to consensus modules. Genes in each module are assigned a particular color code, which is shown below the dendrogram. Genes not assigned to any of the modules are colored grey. (B and C) Clustering dendrograms show consensus module eigengenes in HNC and CC. The two major modules are evident in both dendrograms. (D) Heatmap shows eigengene proximities in the consensus eigengene network for CC samples. Each row and column corresponds to one eigengene (labeled by consensus module color). In the heatmap, red denoteshigh proximity (positive correlation) and green denotes low proximity (negative correlation). (E) Bar graph showing preservation measure (D) for each consensus eigengene (vertical axes). The module color is represented in each bar for the corresponding eigengenes. (F) Heatmap shows proximities in the preservation of eigengene networks of HNC and CC modules. Each row and column corresponds to a consensus module. The red pattern reveals the proximity of specific module in HNC and CC. (G) Heatmap shows eigengene proximities in the consensus eigengene network for HNC samples. The 8 consensus modules were clearly merged into two modules in HNC.
The modules were characterized by height and minimum size of branch. Consensus modules represent biological pathways shared between the HNC and CC data sets. For each data set, we represented the consensus modules by their corresponding eigengenes and then constructed a eigengene network (Figure 2). The consensus eigengenes in HNC and CC groups belonged to one of two branches (Figure 2B–2C). The green, black and blue modules formed the first branch, whereas the brown, yellow, red, pink and turquoise modules formed the second branch. The module eigengenes were highly preserved (Figure 2). The eigengene networks of HNC and CC are shown in Figure 2D and 2G, respectively. The high connectivity showed that each individual eigengene in a module was highly preserved relative to the other eigengenes. The preservation indices were 0.811, 0.938, 0.933, 0.92, 0.835, 0.963, 0.92 and 0.919 for the brown, yellow, blue, turquoise, green, red, black and pink modules, respectively, with the overall preservation of 0.90 (Figure 2E). The consensus modules were preserved between the two data sets (Figure 2F).
Gene expression patterns of eight consensus modules
Next, we explored the gene expression patterns of the 8 consensus gene modules between the cancer and their corresponding normal samples (Figure 3). We observed much clearer distinct differences in expression patterns between CC and normal cervical samples comparing to the differences between HNC and their corresponding normal head and neck samples. The genes in the 8 consensus modules are shown in Table 1 and Supplementary Table 1.
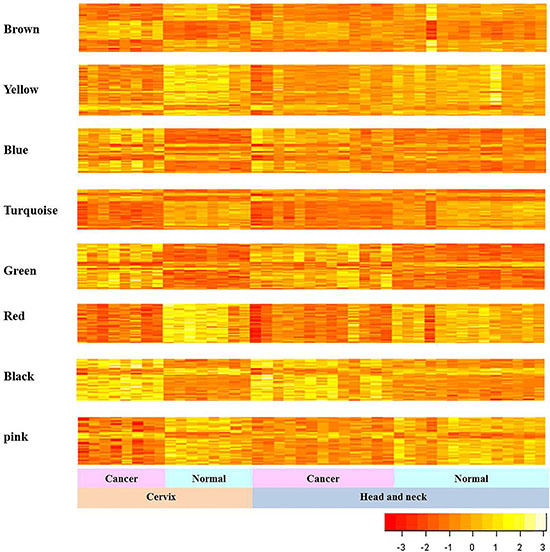
Figure 3: Gene expression patterns of consensus modules in HNC and CC. The expression patterns of genes in the consensus modules of HNC and CC samples are shown. The vertical and horizontal axes of heat map represent gene expressions and samples, respectively.
Table 1: Gene lists of eight consensus modules
Brown |
Yellow |
Blue |
Turquoise |
Green |
Red |
Black |
Pink |
|---|---|---|---|---|---|---|---|
LRRN4CL |
TRIM40 |
CDC42SE2 |
KRT78 |
KLF7 |
TMEM72 |
TYMS |
HYDIN2 |
NAV3 |
HOXC12 |
CNOT6L |
LRRC43 |
STAT1 |
LOC285300 |
LOC375196 |
CCDC26 |
STMN1 |
MGC20647 |
FLJ31715 |
ATP6V1C2 |
CTSC |
TP53BP1 |
DHFR |
C18orf20 |
CACYBP |
C21orf15 |
OSGIN2 |
C1orf177 |
CTSL1 |
F11 |
DHFR.2 |
OLFM3 |
DHFR |
NFYC |
EME2 |
C5orf28 |
SLC16A1 |
KDM5B |
STIM1 |
C9orf68 |
SMAD2 |
LOC338694 |
RPAP3 |
CTNND1 |
CDKN2A |
ACAA2 |
RNASEH2A |
OR2C3 |
CDK1 |
CHML |
LOC283888 |
RABEPK |
CFB |
TAOK2 |
RFC5 |
RNASET2 |
FAIM2 |
C6orf174 |
NEDD1 |
GBP6 |
IFI27 |
RAB3A |
CDC45 |
C10orf44 |
MAPT |
C9orf29 |
KIAA1543 |
HCG22 |
PLSCR1 |
SLC14A1 |
CLUAP1 |
LOC729870 |
ZWINT |
KRT79 |
CBX3 |
LOC441178 |
PLOD2 |
INS |
NFE2L3 |
RNF103 |
HSD11B2 |
SLC39A6 |
GNG10 |
TRIP10 |
LTBP1 |
IFNW1 |
MLF1 |
SAMD5 |
PDE2A |
DGCR2 |
MED13 |
HOPX |
LAMA3 |
PSG4 |
CXCL13 |
BHLHB9 |
PMAIP1 |
FAM20B |
TNFAIP3 |
C9orf169 |
LOX |
CLDN6 |
SYNGR3 |
DDX19A |
ACOX2 |
SMAD2 |
IL8 |
TCP11L2 |
LDOC1 |
SELPLG |
RIBC2 |
MLEC |
BRCA1 |
SLC13A2 |
BCAS2 |
FMN1 |
MMP1 |
FAM120A |
SYCP2 |
MLF1 |
NEK2 |
DAPK3 |
KIF2A |
EMP1 |
HOMER3 |
PBX2 |
HOXC6 |
ZNF135 |
ABCA8 |
CA12 |
NFIL3 |
SOX4 |
HLF |
PATZ1 |
ATP4A |
ARMCX4 |
TGFBR3 |
ST3GAL2 |
NDST2 |
IFI30 |
PLAU |
IGHA |
CBX5 |
PDIA4 |
CKM |
PRIM2 |
SLC43A1 |
FARP1 |
ISG15 |
POU2F2 |
NEDD4L |
KCNK2 |
TTK |
HSPB2 |
GAS1 |
MTMR3 |
MMP10 |
FSHB |
OLFM1 |
RGSL1 |
PLK4 |
HOXD3 |
RECQL |
LYN |
PLA2G7 |
CYP11B2 |
APITD1 |
GABARAPL3 |
CLEC3B |
ALOX15B |
TMEFF1 |
ITPR2 |
PAK2 |
PVT1 |
HSP90AA1 |
C1orf216 |
PHYHIP |
GCKR |
SNX4 |
AKAP2 |
APOL1 |
KIR2DL1 |
IPO9 |
RAB7A |
CCL14 |
FOXE1 |
CASK |
C1QB |
NCF2 |
KLF11 |
DTL |
OR2J3 |
Twentyfour genes for each module were shown in the table and the order is insignificant.
Annotation of gene ontology (GO) terms and KEGG pathways of eight consensus modules
Table 2 shows the annotation of the genes in the 8 consensus modules using GO terms and KEGG pathways with DAVID gene annotation tool (http://david.abcc.ncifcrf.gov/). We determined the P-values (modified Fisher exact p-value) and the Benjamini-Hochberg false discovery rate (FDR) to determine the significance of enrichment of the annotated terms. Red and black modules represent the key GO terms and KEGG pathways with significant Benjamini adjusted P-values (Table 2). These two modules were clearly distinct and showed high connectivity (red = 0.963, black = 0.920; Figure 2B–2C).
Table 2: KEGG pathways and GO terms of identified consensus modules for head and neck cancer and cervical cancer
Module |
Enriched terms associated with gene list in module |
Category |
P-value* |
Benjamini** |
|---|---|---|---|---|
Brown |
Fanconi anemia pathway |
KEGG-pathway |
1.6E-3 |
1.1E-1 |
ATP binding |
GOTERM |
4.4E-4 |
3.6E-2 |
|
Yellow |
anterior/posterior pattern specification |
GOTERM |
1.8E-3 |
4.4E-1 |
Blue |
nucleus |
GOTERM | 2.3E-3 |
1.6E-1 |
Hedgehog signaling pathway |
KEGG-pathway |
9.8E-2 |
9.9E-1 |
|
Turquoise |
Serotonergic synapse |
KEGG-pathway |
3.4E-3 |
4.1E-1 |
extracellular exosome |
GOTERM |
8.5E-5 |
1.4E-2 |
|
Green |
Herpes simplex infection |
KEGG-pathway |
2.2E-2 |
8.0E-1 |
type I interferon signaling pathway |
GOTERM |
2.5E-5 |
6.5E-5 |
|
Red |
Antigen processing and presentation |
KEGG-pathway |
6.3E-11 |
3.3E-9 |
regulation of immune response |
GOTERM |
7.2E-4 |
2.0E-1 |
|
Black |
GOTERM_ |
6.4E-6 |
1.2E-3 |
|
regulation of transcription involved in G1/S transition of mitotic cell cycle |
5.7E-4 |
5.4E-2 |
||
One carbon pool by folate |
KEGG-pathway |
3.4E-2 |
5.7E-1 |
|
Pink |
melanosome membrane |
GOTERM |
1.6E-2 |
6.8E-1 |
*P-value: modified Fisher Exact p-value, **Benjamini: Benjamini-Hochberg false discovery rate (FDR) adjusted p-value.
DISCUSSION
Although single-target drugs inhibit or activate a specific target, their effects may be sub-optimal because of compensatory mechanisms [14–17]. Therefore, multi-target dugs are preferred to deal with the complexity of diseases [14, 16–18]. Cancer cell types are commonly classified by histopathology as well as molecular characteristics like gene expression, mutations, copy number variations and epigenetic alterations. These molecular characteristics help identify cancer-type and stage-specific prognostic biomarkers. In comparison to cancer type-specific biomarkers, multi-cancer biomarkers are more precise and accurate in research and clinic [11].
Previously, various specific biomarkers have been described for HNC or CC [19, 20]. However, consensus biomarkers are not well known for HNC and CC. Therefore, we investigated the various consensus gene modules in HNC and CC. We identified 8 consensus gene modules that showed differential expression patterns between cancer and normal samples in both types of cancers. Each module contained common genes that were important in HNC and CC. For example, SMAD2 that was included in the brown module correlated with poor prognosis in oral SCC [21] as well as cell cycle regulation and epithelial to mesenchymal transition (EMT) in CC [22]. Moreover, well known molecular biomarkers of HNC such as IL8, MMP1, and MMP10 [20] were included in the blue and green modules (Supplementary Table 1). Some of the genes in the modules are well known in various cancers, but have not been fully investigated in HNC or CC. For example, CACYBP in the brown module correlates with proliferation and metastasis in colon cancer [23, 24] as well as drug resistance in pancreatic cancer [25]. The modules also contained genes like LRRN4CL, NAV3 and STMN1 that have not yet been investigated in cancer research. Functional studies of these genes, which are not well known in HNC and CC will potentially reveal novel molecular mechanisms for both cancers and identify new molecular targets for the diagnosis and treatment.
We also explored the biological functions of each module by GO terms and KEGG pathway annotation. GO terms such as cancer initiation and progression, chemotherapy, cell cycle, immune response, tetrahydrofolate metabolic process and cell adhesion molecules were included in the red and black modules. Functional enrichment analysis identified cancer cell migration, invasion and survival as common pathways.
In the brown module, ATP binding was a significant term with many ATP binding-associated genes like NIMA related kinase 2 (NEK2). NEK2 regulates centrosome separation by phosphorylating centrosomal proteins [26–28]. Aberrant NEK2 activity has been investigated in various malignancies [29–31] including CC [32, 33] and HNC [34]. In the turquoise module, extracellular exosome was identified as a significant term. Extracellular exosome is an organelle that contributes to intercellular communication and is produced by all cell types [35, 36]. It is implicated in the progression of various cancers, including brain and head and neck cancer [37–40]. The turquoise module included 33 extracellular exosome associated genes. These included LYN, a member of the SRC family of protein tyrosine kinases. Lyn is a key mediator of cell proliferation, migration and invasion in CC [41] and HNC [42].
The type I interferon (IFN) signaling pathway, which is involved in the antiviral response [43], host immunity [44] and cytotoxicity [45] was a significant term of the green module. IFNs belong to a family of multifunctional cytokines that activate (Janus Kinases)/STAT (Signal Transducer and Activator of Transcription) signaling pathway [46, 47], which up-regulates IFN-stimulated genes (ISG) [48]. ISG15 was localized in the green module [49].
A limitation of this study is that we used genes with significantly different expression patterns between cancer and normal samples for identifying consensus module. In future studies, we plan to pursue the whole gene set to identify the consensus modules that will also include similarly expressed genes with aberrant function due to mutations. Future studies will also include the validation of the identified gene modules using other cancer types.
In conclusion, we identified consensus gene modules of HNC and CC to identify common targets for multicancer therapy, especially for cancers that are HPV16-positive. The modules included genes that are involved in significant biological functions associated with cancer progression.
MATERIALS AND METHODS
Gene expression dataset analysis
We used a publicly available gene expression dataset (GSE6791) [50] that included 42 head and neck cancer, 14 normal head and neck, 20 cervical cancer and 8 normal cervix tissue samples. The HPV types in these cancer samples were HPV16, HPV18, HPV33, HPV31, HPV35, HPV55 and HPV66. We analyzed HPV16-positive samples only to exclude bias due to different HPV types. The dataset is summarized in Table 3.
Table 3: Summary of the dataset used in this work
Dataset |
Platform |
Number of |
Number of HPV16 positivesamples |
|---|---|---|---|
GSE6791 [14] |
HG-U133Plus2 |
42 HNC, 14 normal tissues of head and neck,20 CC, 8 normal tissues of cervix, 54675 probes |
13 HNC, 8 CC |
*HNC: Head and neck cancer; CC: Cervical cancer; HPV: Human papilloma virus.
Statistical analysis
Mann–Whitney U test was performed to determine the differently expressed genes in HNC and CC cancer samples in relation to their corresponding controls. After identifying the differentially expressed genes in HNC and CC, hierarchical clustering analysis was performed to construct different modules, as described previously [7, 12]. Principal component analysis (PCA) was used to identify the eigengene of each cluster or module. All statistical analyses were conducted using Rversion 3.3.1 software package including packages for consensus module detection.
Consensus module construction
Gene modules refer to genes that show similar expression patterns in cancer cells or tissues in comparison to normal cells or tissues. Consensus modules refer to modules that are similar in multiple cancers. Hierarchical clustering according to a measure of dissimilarity is used to group genes with similar expression profiles into modules [12]. We used average linkage hierarchical clustering with consensus dissimilarity measure and defined modules as branches of a tree [7, 51]. For cut-off branches, we used a fixed height cut-off value of 0.95. The modules contained a minimum number of genes (25 genes per module in this study).We identified modules in a multistep process [7]. First, we performed hierarchical clustering based on consensus dissimilarity measure. Then, the cluster tree was cut at a fixed height cut-off value. Each branch was considered a separate module. Genes that were not assigned to any branch or module were denoted in grey.
Construction of the eigengenes network
We performed principal component analysis (PCA) to identify eigengenes in the consensus gene modules. PCA is a nonparametric statistical method that reduces data dimensionality and converts correlated variables into uncorrelated variables called principal components [52, 53]. We calculated principal components of each gene module. The first principal component is called an eigengene and represents the module. Each principal component is represented in the form of linear combinations of gene expressions in the module according to the following formula:

where g1, g2, g3… gn are gene expressions, and C1, C2, C3…Cn are weights of each gene expression.
Module preservation and biological validation of modules
Module preservation statistics were used to evaluate if a module defined in one data set was also present in another data set. The preservation among modules was evaluated by the correlation of eigengenes of each module [51]. The preservation of eigengenes between the ith and jthconsensus modules in data sets A and B were calculated as

where  and
and  denote the eigengenes of the ithconsensus module in data sets A and B, respectively; cor(X,Y) represents correlation coefficient of X and Y.
High values indicate strong preservation between the ithand jthconsensus modules across the two data sets. The preservation statistic is maximized when the correlation of the ithand jthconsensus modules in data set A is the same as in data set B. For biological validation, we used the KEGG pathways to determine the consensus biological terms that were associated with the gene lists in modules [54].
Abbreviations
SCC: Squamous cell carcinoma; HPV16: Human papillomavirus type 16; PCA: principal component analysis; HNC: head neck cancer; CC: cervical cancer; GO: gene ontology; FDR: false discovery rate; NEK2: NIMA related kinase 2; IFN: interferon; STAT: Signal Transducer and Activator of Transcription; ISG: IFN-stimulated genes.
Author contributions
K-Y Kim conceptualized and designed this study; X. Zhang and K-Y Kim developed the methodology; X. Zhang, I-H Cha and K-Y Kim analyzed and interpreted the data as well as wrote, reviewed and revised the manuscript; X. Zhang and K-Y Kim supervised the study.
ACKNOWLEDGMENTS AND FUNDING
This work was supported by Basic Science Research Program through the National Research Foundation of Korea (NRF) funded by the Ministry of Education (NRF-2016R1D1A1B03934112, NRF-2017R1D1A1B03034921 and NRF-2016R1D1A1B03934296), and by a grant from National Natural Science Foundation of China (NSFC, No. 81460408).
CONFLICTS OF INTEREST
All authors declare that there are no conflicts of interest.
REFERENCES
1. Cui X, Churchill GA. Statistical tests for differential expression in cDNA microarray experiments. Genome Biol. 2003; 4:210.
2. Choi Y, Kendziorski C. Statistical methods for gene set co-expression analysis. Bioinformatics. 2009; 25:2780–2786.
3. de la Fuente A. From ‘differential expression’ to ‘differential networking’ - identification of dysfunctional regulatory networks in diseases. Trends Genet. 2010; 26:326–333.
4. Yu H, Liu BH, Ye ZQ, Li C, Li YX, Li YY. Link-based quantitative methods to identify differentially coexpressed genes and gene pairs. BMC Bioinformatics. 2011; 12:315.
5. Yip AM, Horvath S. Gene network interconnectedness and the generalized topological overlap measure. BMC Bioinformatics. 2007; 8:22.
6. Cho SB, Kim J, Kim JH. Identifying set-wise differential co-expression in gene expression microarray data. BMC Bioinformatics. 2009; 10:109.
7. Langfelder P, Horvath S. Eigengene networks for studying the relationships between co-expression modules. BMC Syst Biol. 2007; 1:54.
8. Tesson BM, Breitling R, Jansen RC. DiffCoEx: a simple and sensitive method to find differentially coexpressed gene modules. BMC Bioinformatics. 2010; 11:497.
9. Xu K, Cui J, Olman V, Yang Q, Puett D, Xu Y. A comparative analysis of gene-expression data of multiple cancer types. PLoS One. 2010; 5:e13696.
10. Song R, Huang J, Ma S. Integrative prescreening in analysis of multiple cancer genomic studies. BMC Bioinformatics. 2012; 13:168.
11. Martinez-Ledesma E, Verhaak RG, Trevino V. Identification of a multi-cancer gene expression biomarker for cancer clinical outcomes using a network-based algorithm. Sci Rep. 2015; 5:11966.
12. Ravasz E, Somera AL, Mongru DA, Oltvai ZN, Barabasi AL. Hierarchical organization of modularity in metabolic networks. Science. 2002; 297:1551–1555.
13. Herrero R, Castellsague X, Pawlita M, Lissowska J, Kee F, Balaram P, Rajkumar T, Sridhar H, Rose B, Pintos J, Fernandez L, Idris A, Sanchez MJ, et al. Human papillomavirus and oral cancer: the International Agency for Research on Cancer multicenter study. J Natl Cancer Inst. 2003; 95:1772–1783.
14. Csermely P, Agoston V, Pongor S. The efficiency of multi-target drugs: the network approach might help drug design. Trends Pharmacol Sci. 2005; 26:178–182.
15. Puls LN, Eadens M, Messersmith W. Current status of SRC inhibitors in solid tumor malignancies. Oncologist. 2011; 16:566–578.
16. Boran AD, Iyengar R. Systems approaches to polypharmacology and drug discovery. Curr Opin Drug Discov Devel. 2010; 13:297–309.
17. Lu JJ, Pan W, Hu YJ, Wang YT. Multi-target drugs: the trend of drug research and development. PLoS One. 2012; 7:e40262.
18. Petrelli A, Giordano S. From single- to multi-target drugs in cancer therapy: when aspecificity becomes an advantage. Curr Med Chem. 2008; 15:422–432.
19. Dasari S, Wudayagiri R, Valluru L. Cervical cancer: Biomarkers for diagnosis and treatment. Clin Chim Acta. 2015; 445:7–11.
20. Dahiya K, Dhankhar R. Updated overview of current biomarkers in head and neck carcinoma. World J Methodol. 2016; 6:77–86.
21. Mangone FR, Walder F, Maistro S, Pasini FS, Lehn CN, Carvalho MB, Brentani MM, Snitcovsky I, Federico MH. Smad2 and Smad6 as predictors of overall survival in oral squamous cell carcinoma patients. Mol Cancer. 2010; 9:106.
22. Zhao JL, Zhang L, Guo X, Wang JH, Zhou W, Liu M, Li X, Tang H. miR-212/132 downregulates SMAD2 expression to suppress the G1/S phase transition of the cell cycle and the epithelial to mesenchymal transition in cervical cancer cells. IUBMB Life. 2015; 67:380–394.
23. Zhai H, Shi Y, Chen X, Wang J, Lu Y, Zhang F, Liu Z, Lei T, Fan D. CacyBP/SIP promotes the proliferation of colon cancer cells. PLoS One. 2017; 12:e0169959.
24. Ghosh D, Li Z, Tan XF, Lim TK, Mao Y, Lin Q. iTRAQ based quantitative proteomics approach validated the role of calcyclin binding protein (CacyBP) in promoting colorectal cancer metastasis. Mol Cell Proteomics. 2013; 12:1865–1880.
25. Chen X, Zheng P, Xue Z, Li J, Wang W, Chen X, Xie F, Yu Z, Ouyang X. CacyBP/SIP enhances multidrug resistance of pancreatic cancer cells by regulation of P-gp and Bcl-2. Apoptosis. 2013; 18:861–869.
26. Fang G, Zhang D, Yin H, Zheng L, Bi X, Yuan L. Centlein mediates an interaction between C-Nap1 and Cep68 to maintain centrosome cohesion. J Cell Sci. 2014; 127:1631–1639.
27. Man X, Megraw TL, Lim YP. Cep68 can be regulated by Nek2 and SCF complex. Eur J Cell Biol. 2015; 94:162–172.
28. Chen C, Tian F, Lu L, Wang Y, Xiao Z, Yu C, Yu X. Characterization of Cep85 - a new antagonist of Nek2A that is involved in the regulation of centrosome disjunction. J Cell Sci. 2015; 128:3290–3303.
29. Hayward DG, Clarke RB, Faragher AJ, Pillai MR, Hagan IM, Fry AM. The centrosomal kinase Nek2 displays elevated levels of protein expression in human breast cancer. Cancer Res. 2004; 64:7370–7376.
30. Andreasson U, Dictor M, Jerkeman M, Berglund M, Sundstrom C, Linderoth J, Rosenquist R, Borrebaeck CA, Ek S. Identification of molecular targets associated with transformed diffuse large B cell lymphoma using highly purified tumor cells. Am J Hematol. 2009; 84:803–808.
31. Zeng X, Shaikh FY, Harrison MK, Adon AM, Trimboli AJ, Carroll KA, Sharma N, Timmers C, Chodosh LA, Leone G, Saavedra HI. The Ras oncogene signals centrosome amplification in mammary epithelial cells through cyclin D1/Cdk4 and Nek2. Oncogene. 2010; 29:5103–5112.
32. Naro C, Barbagallo F, Chieffi P, Bourgeois CF, Paronetto MP, Sette C. The centrosomal kinase NEK2 is a novel splicing factor kinase involved in cell survival. Nucleic Acids Res. 2014; 42:3218–3227.
33. Koch M, Wiese M. Gene expression signatures of angiocidin and darapladib treatment connect to therapy options in cervical cancer. J Cancer Res Clin Oncol. 2013; 139:259–267.
34. Duan X, Chen H, Ma H, Song Y. NEK2 is up-regulated in oral squamous cell carcinoma and correlates with patients’disease severity. International Journal of Experimental Pathology. 2017; 10:3594–3600.
35. Mathivanan S, Ji H, Simpson RJ. Exosomes: extracellular organelles important in intercellular communication. J Proteomics. 2010; 73:1907–1920.
36. Kowal J, Tkach M, Thery C. Biogenesis and secretion of exosomes. Curr Opin Cell Biol. 2014; 29:116–125.
37. Bobrie A, Krumeich S, Reyal F, Recchi C, Moita LF, Seabra MC, Ostrowski M, Thery C. Rab27a supports exosome-dependent and -independent mechanisms that modify the tumor microenvironment and can promote tumor progression. Cancer Res. 2012; 72:4920–4930.
38. Epple LM, Griffiths SG, Dechkovskaia AM, Dusto NL, White J, Ouellette RJ, Anchordoquy TJ, Bemis LT, Graner MW. Medulloblastoma exosome proteomics yield functional roles for extracellular vesicles. PLoS One. 2012; 7:e42064.
39. Ludwig S, Floros T, Theodoraki MN, Hong CS, Jackson EK, Lang S, Whiteside TL. Suppression of lymphocyte functions by plasma exosomes correlates with disease activity in patients with head and neck cancer. Clin Cancer Res. 2017; 23:4843–4854. https://doi.org/10.1158/1078-0432.CCR-16-2819.
40. Steinbichler TB, Dudas J, Riechelmann H, Skvortsova II. The Role of Exosomes in Cancer Metastasis. Semin Cancer Biol. 2017; 44:170–181. https://doi.org/10.1016/j.semcancer.2017.02.006.
41. Liu S, Hao X, Ouyang X, Dong X, Yang Y, Yu T, Hu J, Hu L. Tyrosine kinase LYN is an oncotarget in human cervical cancer: A quantitative proteomic based study. Oncotarget. 2016; 7:75468–75481. https://doi.org/10.18632/oncotarget.12258.
42. Wheeler SE, Morariu EM, Bednash JS, Otte CG, Seethala RR, Chiosea SI, Grandis JR. Lyn kinase mediates cell motility and tumor growth in EGFRvIII-expressing head and neck cancer. Clin Cancer Res. 2012; 18:2850–2860.
43. Perry AK, Chen G, Zheng D, Tang H, Cheng G. The host type I interferon response to viral and bacterial infections. Cell Res. 2005; 15:407–422.
44. Stetson DB, Medzhitov R. Type I interferons in host defense. Immunity. 2006; 25:373–381.
45. Khodarev NN, Roizman B, Weichselbaum RR. Molecular pathways: interferon/stat1 pathway: role in the tumor resistance to genotoxic stress and aggressive growth. Clin Cancer Res. 2012; 18:3015–3021.
46. Laurence A, Pesu M, Silvennoinen O, O’Shea J. JAK Kinases in Health and Disease: An Update. Open Rheumatol J. 2012; 6:232–244.
47. Yanai H, Negishi H, Taniguchi T. The IRF family of transcription factors: Inception, impact and implications in oncogenesis. Oncoimmunology. 2012; 1:1376–1386.
48. Andersen JB, Hassel BA. The interferon regulated ubiquitin-like protein, ISG15, in tumorigenesis: friend or foe? Cytokine Growth Factor Rev. 2006; 17:411–421.
49. Blomstrom DC, Fahey D, Kutny R, Korant BD, Knight E Jr. Molecular characterization of the interferon-induced 15-kDa protein. Molecular cloning and nucleotide and amino acid sequence. J Biol Chem. 1986; 261:8811–8816.
50. Pyeon D, Newton MA, Lambert PF, den Boon JA, Sengupta S, Marsit CJ, Woodworth CD, Connor JP, Haugen TH, Smith EM, Kelsey KT, Turek LP, Ahlquist P. Fundamental differences in cell cycle deregulation in human papillomavirus-positive and human papillomavirus-negative head/neck and cervical cancers. Cancer Res. 2007; 67:4605–4619.
51. Zhang B, Horvath S. A general framework for weighted gene co-expression network analysis. Stat Appl Genet Mol Biol. 2005; 4:Article17.
52. Hotelling H. Analysis of a complex of statistical variables into principal components. Journal of Educational Psychology. 1933; 24:417–441.
53. Pearson K. On Lines and Planes of Closest Fit to Systems of Points in Space. Philosophical Magazine. 1901; 2:559–572.
54. Huang da W, Sherman BT, Lempicki RA. Systematic and integrative analysis of large gene lists using DAVID bioinformatics resources. Nat Protoc. 2009; 4:44–57.