
INTRODUCTION
The circadian clock programs daily rhythms and coordinates multiple metabolic processes and results in the diurnal oscillation of glucose, amino acids, and fatty acids in wild and clock-/- animals [1–4]. However, the diurnal oscillation of circulating nutrient metabolism is not only regulated by circadian rhythms, but is also affected by the L:D cycle, temperature, and food availability. Once the diurnal oscillation of these metabolites is disrupted, it eventually results in various syndromes, including obesity and glucose tolerance [5], hyperleptinemia, hyperlipidemia, hepatic steatosis, hyperglycemia, and hypoinsulinemia [6].
Circadian rhythms of cells and organismal physiology are controlled by an autoregulatory transcription-translation feedback loop that regulates the expression of rhythmic genes at the transcription level. Studies on the brain, liver, and heart tissues have shown that up to approximately 10% of the transcripts are under circadian clock regulation, in a tissue specific manner [7–11]. In the transcriptional cascade, the CLOCK–BMAL1 complex directly induces the expression of transcription factors that are subsequently responsible for the majority of circadian rhythms. The components of the circadian pacemaker, such as the transcription factor Clock and Per2 gene products, program metabolic processes of cells via RNA transcription periodicity [12]. Although it has been well demonstrated that the circadian clock programs genes involved in metabolism in nocturnal mice, the diurnal variation of the expression of these genes should be studied in diurnal animals, since the expression of circadian pacemakers, i.e., CLOCK and Per, also vary diurnally over 24 h [13–14].
It has been found that changing the daily rhythm of food ingestion also changes the metabolite rhythms. When changing the daily rhythm of methionine ingestion, with 25% of the total methionine ingested in the morning, and 75% at night, the serum total cholesterol (TC), triglyceride (TG), total protein (TP), and calcium of laying hens were significant lower in the early morning [13]. Based on these findings, we focused on the oscillation of circulating nutriments under normal circadian rhythms, L:D cycle, temperature, and food availability. We also hypothesized that changing the ingestion time of nutrients may affect multiple metabolic processes and energy/nutrient storage, and, in food producing animals, may affect production performance.
Therefore, in the current study, diurnal variation of nutrients and genes related to nutrient metabolism were studied in laying hens using hepatic transcriptomic and targeted metabolomic approaches. Using these approaches, we discovered a 24-h rhythm in circulating nutrient metabolism. The diurnal variations of glucose, amino acids, and fatty acids in serum were also investigated. Our results showed that most of the circulating nutrients displayed a time-of-day dependent pattern, and all diurnal variations were highly correlated with the diurnal rhythm of related transcripts.
RESULTS
Daily egg production rates
Of all the eggs collected, 72.58 ± 6.33% were collected in the morning (7:30), 23.90 ± 5.75% were collected in the afternoon (12:00), and 3.52 ± 0.94% were collected in the evening (19:30).
Illumina sequencing and read mapping
RNA-sequencing was used to capture the dynamic temporal changes of liver transcriptomes at 3:30, 7:30, 11:30, 15:30, 19:30, and 23:30 daily (note that hereafter these sampling times will be referred to as C3, C7, C11, C15, C19, and C23 respectively). Six sequencing libraries were prepared and sequenced with the Illumina paired-end method. Approximately 2.5 × 10⁷ raw reads were generated in each group. After removing low quality reads, clean reads were obtained, and > 95% of the clean reads had Phred-like quality scores at the Q20 level (an error probability of 0.01) and GC-contents of approximately 50% (Supplementary Table 1). After RNA sequencing, 74.81–80.24% of the total reads in different samples were mapped to the genome of G. gallus; and 73.47–79.02% of the reads in each sample were uniquely mapped to the genome (Supplementary Table 2). Pearson correlations between biological replicates were greater than 0.8, which indicates high reliability of the experiment and rationality of sample selection (Supplementary Table 3).
Differentially expressed genes
To better understand the circadian rhythm of genes related to metabolism, the differentially expressed genes between different samples were analyzed. The differentially expressed genes in response to circadian rhythm were clustered as shown in Supplementary Figure 1. The overall distributions of differentially expressed genes of different expression levels in six groups are shown in Figure 1. When comparing the abundance of annotated genes in each group of two sample groups, 419 differentially expressed genes were found, including 74 novel genes. The enriched GO functions were closely related to oxidative metabolism, lipid biosynthesis and metabolism, and heme- or iron-related molecular functions and biological processes, including signal-organism metabolic process, oxidation-reduction processes, oxidoreductase activity, lipid biosynthetic processes, lipid metabolic processes, and iron-ion binding (Figure 2).
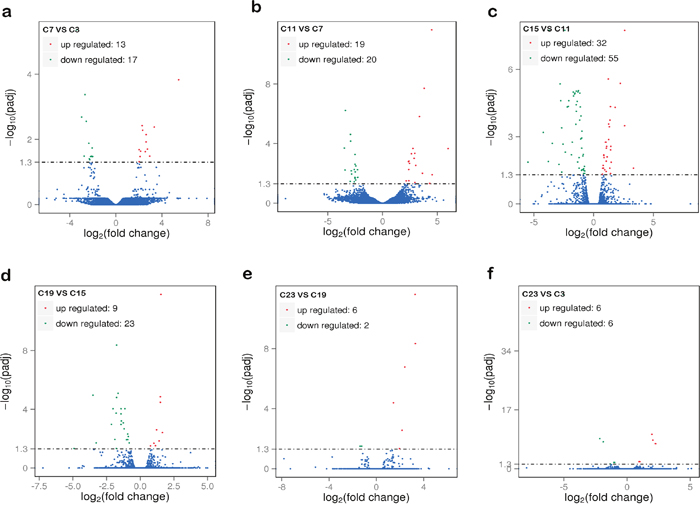
Figure 1: The overall distribution of differentially expressed genes in samples. (a) Comparison group: C7 and C3; (b) comparison group: C11 and C7; (c) comparison group: C15 and C11; (d) comparison group: C19 and C15; (e) comparison group: C23 and C19; (f) comparison group: C23 and C3. The horizontal axis shows the change of expression levels of DE genes in different samples; the vertical axis shows the statistical significance of the change of expression levels. Red dots represent genes that are up regulated and green dots represent genes that are down regulated. C3, C7, C11, C15, C19, and C23 refer to samples collected at 03:30, 07:30, 11:30, 15:30, 19:30, and 23:30.
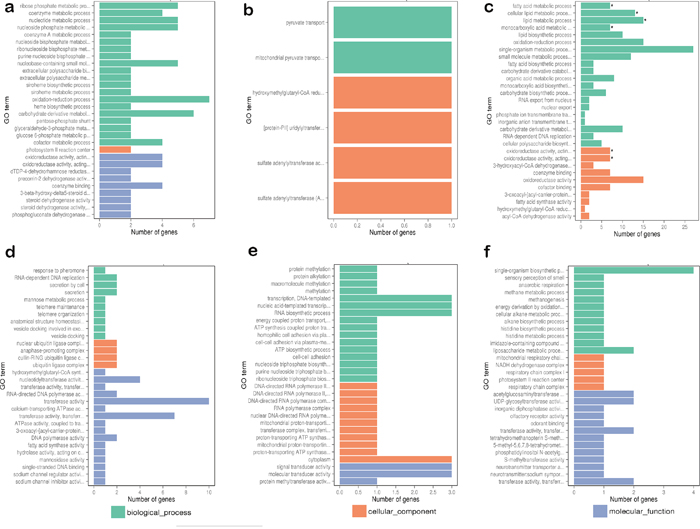
Figure 2: Comparing functional annotations of contigs between different samples. (a) Comparison group: C7 and C3; (b) comparison group: C11 and C7; (c) comparison group: C15 and C11; (d) comparison group: C19 and C15; (e) comparison group: C23 and C19; (f) comparison group: C23 and C3. The green bars represent the biological process; orange bars represent the cellular component; purple bars represent the molecular function. C3, C7, C11, C15, C19, and C23 refer to samples collected at 03:30, 07:30, 11:30, 15:30, 19:30, and 23:30.
Verification of changes in transcriptomic analysis
To verify the results from RNA-sequencing, 6 differentially expressed transcriptions namely ATP-binding cassette transporters G5 (ABCG5), cytochrome P450 1A4 enzyme (CYP1A4), Hexokinase Domain Containing 1 (HKDC1), heat shock 70 kDa protein 5 (HSPA5), β3 polypeptide chain of laminin 5 (LAMB3), and organic anion transporting polypeptide 2B1 (SLCO2B1) were randomly selected for RT-PCR analysis. Our results showed that the detection of relative up- and down-regulation of these mRNA levels by RT-PCR was in agreement with the transcriptomics results (Figure 3).
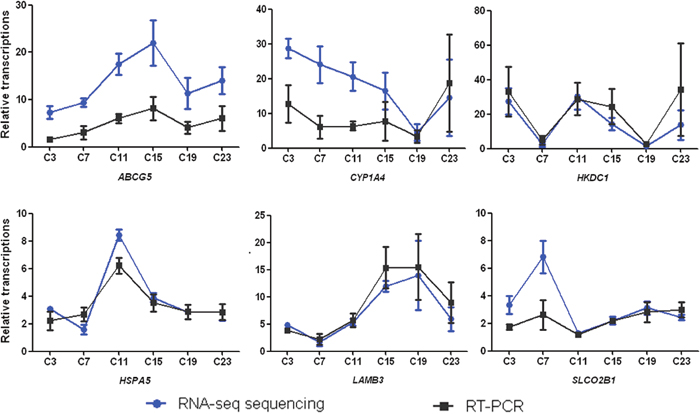
Figure 3: Diurnally regulated transcripts of liver targeted for nutrient metabolism. (a) Lipid biosynthesis and metabolism; (b) protein catabolism and amino acid generation; (c) transporters; (d) oxidation-reduction metabolism; (e) anti-stress response; (f) steroid biosynthesis. C3, C7, C11, C15, C19, and C23 refer to samples collected at 03:30, 07:30, 11:30, 15:30, 19:30, and 23:30.
Diurnal variation of glucose, amino acids, fatty acid metabolism and steroid biosynthesis
Diurnal variation of glucose, amino acids, and fatty acids in serum is shown in Tables 1 and 2. The levels of glucose, amino acids, and most of the fatty acids in serum of laying hens fluctuated in a day. The nadir of glucose was at C7, and glucose reached a peak at C11. Subsequently, glucose remained at a relatively constant concentration in the afternoon and night. However, the highest levels of amino acids were found at night, at C23 or C3. Amino acid levels decreased in the day, and most of the amino acids reached a nadir at C15. With the exception of fatty acids, undecanoic acid (MAG C11:0), myristoleic acid (C14:1), cis-11, 14-eicosenoic acid (C20:2), and (cis-4, 7, 10, 13, 16, 19-docosahexaenoic acid) C20:3N6, which did not vary diurnally, fatty acids had two peak concentrations at C7 and C15. After “CircWave” analysis, the diurnal variation of amino acids including Trp, Ser, Arg, Asp, Thr, Val, Ala, Ile, Pro, Leu, Cys, and Phe exhibited circadian rhythms in the serum of hens.
Table 1: Circadian rhythm characteristics of amino acids (μmol/L) in serum1
C3 |
C7 |
C11 |
C15 |
C19 |
C23 |
P |
SEM |
Cosine P |
Acrophase (hh:mm) |
Mesor |
Amplitude |
|
|---|---|---|---|---|---|---|---|---|---|---|---|---|
His |
22.60 a |
21.64 a |
23.02 a |
15.29b |
24.09 a |
23.12 a |
<0.05 |
0.81 |
>0.05 |
- |
- |
- |
Trp |
16.10 a |
11.42 b |
10.47c |
11.47 b |
13.01 b |
13.47 b |
<0.01 |
0.43 |
<0.01 |
01:00 |
12.6 |
2.2 |
Ser |
85.11 a |
80.57a |
77.96ab |
65.93b |
83.94a |
88.01a |
<0.05 |
2.05 |
<0.05 |
01:40 |
80.3 |
8.6 |
Arg |
87.95 a |
79.39 ac |
68.19 c |
52.69 b |
75.66 ac |
70.90 c |
<0.01 |
2.62 |
<0.01 |
03:35 |
72.7 |
13.3 |
Gly |
52.56 a |
41.33 b |
42.20bc |
42.18 bc |
49.48 ac |
45.00 bc |
<0.05 |
1.21 |
>0.05 |
- |
- |
- |
Asp |
16.46 a |
10.79 bcd |
7.65cd |
8.25cd |
13.95 ab |
9.82 bcd |
<0.05 |
0.86 |
<0.05 |
01:26 |
11.1 |
3.1 |
Glu |
39.75 a |
28.93 bc |
27.83c |
29.38bc |
36.81ab |
30.20 bc |
<0.05 |
1.28 |
>0.05 |
- |
- |
- |
Thr |
61.00 a |
50.48 ab |
44.69 b |
38.47 b |
44.32b |
42.41 b |
<0.05 |
2.03 |
<0.01 |
04:36 |
47.0 |
8.8 |
Val |
32.68 a |
25.82 bc |
24.87 bc |
21.21 c |
27.57 ab |
27.49 ab |
<0.05 |
1.00 |
<0.01 |
02:19 |
26.6 |
4.3 |
Ala |
50.68ac |
40.50 abg |
42.09 abfg |
32.35b |
54.36 c |
51.11 acefg |
<0.01 |
1.94 |
<0.01 |
00:05 |
45.2 |
8.5 |
Iie |
18.94 a |
14.53 bc |
13.99 bc |
12.08 c |
16.06 ab |
16.98 ab |
<0.01 |
0.56 |
<0.01 |
01:41 |
15.4 |
2.9 |
Pro |
53.63a |
39.14 c |
34.80 bc |
25.77 b |
49.90 a |
52.79 a |
<0.01 |
2.21 |
<0.01 |
00:57 |
42.7 |
13.6 |
Leu |
35.23a |
29.63 c |
30.52 c |
24.37b |
34.04 ac |
33.65ac |
<0.01 |
0.91 |
<0.01 |
01:20 |
31.2 |
4.1 |
Cys |
9.60 a |
6.56 abce |
6.00 cbde |
2.50 df |
3.80 bef |
3.47bf |
<0.01 |
0.62 |
<0.01 |
05:40 |
5.3 |
2.9 |
Phe |
22.64ac |
17.81b |
17.44 b |
17.34 b |
21.89cd |
19.18bd |
<0.01 |
0.54 |
<0.01 |
00:07 |
19.3 |
2.2 |
Tyr |
38.14a |
35.96a |
35.14 a |
35.93a |
38.99a |
28.45b |
<0.05 |
0.99 |
>0.05 |
- |
- |
- |
1 The amino acids that of p >0.05 after ANOVA analysis were not involved.
(–) depicts no significance in cosinor waveform characteristics.
Table 2: Diurnal variation of glucose and fatty acids in serum
C3 |
C7 |
C11 |
C15 |
C19 |
C23 |
P |
SEM |
Cosine P |
|
|---|---|---|---|---|---|---|---|---|---|
Glucose (mmol/L) |
|||||||||
Glu |
12.89 ac |
11.45 bc |
13.41a |
13.19 ac |
12.03 bc |
12.20abc |
0.02 |
0.21 |
0.35 |
Fatty acids (mg/L) |
|||||||||
C11:0 |
2.27 |
2.24 |
2.45 |
2.36 |
2.51 |
2.06 |
0.96 |
0.14 |
0.77 |
C14:0 |
68.93 a |
104.80 b |
59.70a |
64.83a |
81.63 ab |
72.92 a |
0.07 |
4.46 |
0.57 |
C14:1 |
63.71 |
70.81 |
56.28 |
65.92 |
61.69 |
59.48 |
0.61 |
2.31 |
0.86 |
C15:0 |
9.90 a |
14.54 b |
8.51 a |
9.94 a |
12.09 ab |
10.82 ab |
0.08 |
0.60 |
0.73 |
C16:0 |
5798.60 a |
8648.73 b |
4731.54a |
5340.59 a |
6851.06 ab |
5962.55 a |
0.06 |
379.06 |
0.56 |
C16:1 |
551.93a |
1054.67 b |
354.66c |
492.24a |
789.33ab |
580.44 abc |
0.01 |
59.10 |
0.56 |
C17:0 |
36.09 ab |
50.07 b |
31.69 a |
33.26a |
40.49ab |
37.05ab |
0.30 |
2.29 |
0.63 |
C18:0 |
2821.59 ab |
3455.79 b |
2556.58 a |
2691.48 a |
3172.83 ab |
2732.58 ab |
0.16 |
106.07 |
0.81 |
C18:1N9C |
5623.24 a |
9402.78 b |
4292.64a |
4644.44 a |
7394.63 ab |
5976.66 a |
0.06 |
522.71 |
0.53 |
C18:1N9T |
290.92a |
503.92b |
237.31a |
248.66a |
374.35ab |
316.91a |
0.02 |
24.41 |
0.45 |
C18:2N6C |
2176.44 a |
3439.05 b |
1515.19c |
1917.63a |
2687.94 ab |
2385.32abc |
0.04 |
176.79 |
0.42 |
C20:0 |
16.39 |
19.14 |
16 |
17.61 |
18.31 |
14.94 |
0.55 |
0.70 |
0.75 |
C20:1 |
17.96 a |
30.88 b |
10.77c |
11.48a |
22.19 ab |
19.58ac |
0.01 |
1.81 |
0.18 |
C20:3N3 |
21.33a |
35.88b |
16.34a |
19.00a |
25.69 ab |
23.17ab |
0.08 |
1.92 |
0.49 |
C20:4N6 |
416.33a |
768.39b |
343.93 a |
383.70a |
529.93ab |
467.67a |
0.04 |
39.93 |
0.51 |
C22:6N3 |
70.86 |
149.47 |
59.49 |
60.32 |
153.41 |
87.57 |
0.31 |
15.72 |
0.86 |
Diurnal variation in transcripts in hens’ liver
The diurnally varied genes related to circadian rhythms are shown in Figure 4. After CircWave analysis, the genes, including Bmal1, Clock, Per1 and Cry2, exhibited circadian rhythms in the livers of hens. Meanwhile, the transcripts of enzymes involved in protein catabolism, i.e., peptidase and aminotransferase peaked at C3 (Figure 5a), However, the transcripts that were encoded by the genes involved in lipid and fatty acid metabolism had two nadirs, in contrast to the free fatty acid levels in serum (Figure 5b). Moreover, the transporters related to nutrient transport in solute carrier family included SLC2A5, SLC16A1, SLC26A2, SLC7A2, SLC38A2, and SLC30A10 (Figure 5c). These genes are involved in glucose/oligosaccharides, monocarboxylic acid, sulfate anion, cationic amino acid, and sodium-coupled neutral amino acid transportation, respectively.
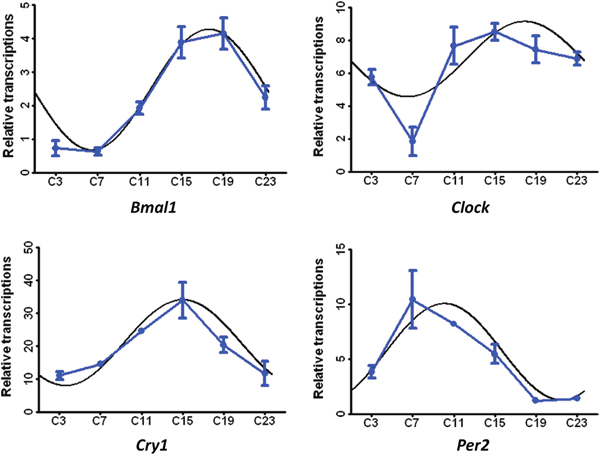
Figure 4: Confirmation of transcriptomics quantification by qRT-PCR. (a) ABCG5, ATP-binding cassette transporters G5; (b) CYP1A4, cytochrome P450 1A4 enzyme; (c) HKDC1, Hexokinase Domain Containing 1; (d) HSPA5, heat shock 70 kDa protein 5; (e) LAMB3, β3 polypeptide chain of laminin 5 and (f) SLCO2B1, organic anion transporting polypeptide 2B1. C3, C7, C11, C15, C19, and C23 refer to samples collected at 03:30, 07:30, 11:30, 15:30, 19:30, and 23:30.
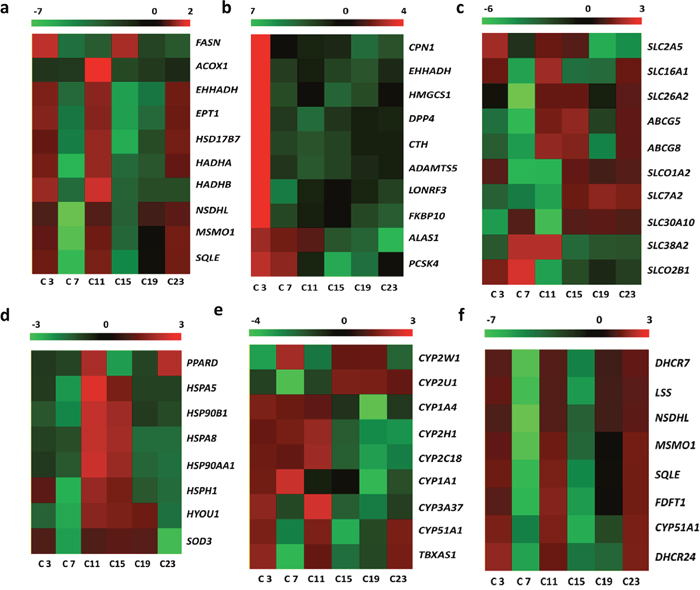
Figure 5: Diurnally regulated transcripts of liver targeted for nutrient metabolism. (a) protein catabolism; (b) lipid and fatty acid metabolism; (c) transporters; (d) oxidative stress and anti-stress responses; (e) endogenic sterol and xenobiotic metabolism; (f) steroid biosynthesis C3, C7, C11, C15, C19, and C23 refer to samples collected at 03:30, 07:30, 11:30, 15:30, 19:30, and 23:30.
However, transcripts related to oxidative stress and anti-stress responses were also found to be differentially expressed. The molecular chaperones, including heat shock protein Hsp A5, Hsp A8, Hsp90 AA1, Hsp 90B1, Hsp H1, and HYOU1 (Hsp12A) are diurnally expressed in response to daily stresses. The peroxisome proliferator-activated receptor delta (PPARD) and Cu-Zn superoxide dismutase (SOD3) were also diurnally expressed (Figure 5d). The ABCG5, ABCG8, SLC01A2, and SLCO2B1 transporters, which are involved in drug and xenobiotic transportation, also displayed time-of-day dependent rhythms. In addition, the CYP oxidases that targeted endogenic sterol and xenobiotic oxidation and reduction also displayed diurnal variations (Figure 5e).
KEGG pathway analysis of differentially expressed genes showed that only a small number of genes were annotated to the KEGG pathways and most of these were related to steroid biosynthesis. Therefore, the transcripts related to dynamic synthesis of steroids were clustered in Figure 3f. The enriched genes displayed time-of–day rhythms. One of the steroids, cholesterol, also displayed time-of-day rhythms.
DISCUSSION
The 24-h rhythms of targeted metabolites, including glucose, fatty acids, and amino acids were investigated in laying hens during egg production. Except for fatty acids C11.0, C14.1, C20.2, and C20.6N3, all metabolites investigated displayed time-of-day rhythms. The variation of these metabolites was closely related to the genes for transportation, lipogenesis, lipid catabolism, sterol metabolism, as well as oxidative/anti-oxidative systems in the liver. These findings are partially consistent with results found in nocturnal mice, where expression of metabolic enzymes, transport systems involved in cholesterol metabolism, amino acid regulation, drug and toxin metabolism, the citric acid cycle, and glycogen and glucose metabolism varied diurnally in response to Clock control, but the trends of individual metabolites were different [2, 7].
The circadian clock has been reported to regulate glycometabolism, and glucose has been shown to phase-shift the clock in peripheral tissues in various animals [15]. In laying hens, the plasma glucose concentrations peaked at C11 and reached a nadir at C7. These trends were similar to those found in human adolescents, where glucose significantly increased starting at 5:30 [16–17]. However, glucose reached a peak in the middle of the night in nocturnal mice [18]. In diurnal horses and sheep, plasma glucose concentrations peaked around the middle of the night and at dusk [19]. The fluctuation of glucose concentrations in plasma mainly results from the coordinated regulation of glucose input (food intake, hepatic glucose production) and its utilization (uptake by skeletal and cardiac muscles, and adipose tissues). Since energy requirements of organisms fluctuate temporally throughout the day, diurnal oscillations in glucose metabolism are partially owing to daily changes in sleep/wake cycles and glucose utilization [20]. In our study, the glucose concentration in blood reached its nadir in the morning after consumption, and increased immediately after ingestion, suggesting the diurnal variation of glucose is related to feeding/fasting cycles.
The effects of the circadian clock on proteometabolism have not been extensively studied in diurnal animals. In the current study, we found that most of the amino acids in plasma and the transcripts related to protein catabolism peaked at night in hens. Moreover, it has been reported that the transcription of amino acid transporters, including SLC1A2, SLC6A20, SLC7A1, and SLC6A14 was higher at 23:30, 3:30, and 7:30 than at 11:30, 15:30, and 19:30 in piglets [21], suggesting amino acid uptake also peaked at night. Similar results were found in mice where amino acid metabolism-related biochemicals peaked at night [2]. Together, both the diurnal and nocturnal study animals displayed similar rhythms in proteometabolism. The regulation of amino acid metabolism by the circadian clock is not simply an indirect effect of its regulation of glucose metabolism [2], but also directly affected by the diurnal variation of protein catabolism and amino acid uptake.
For lipid metabolism, higher levels of plasma free fatty acids (FFA) were found at night in humans because of enhanced lipolytic activity [22–23]. However, FFA levels are lower at night and increase in the early morning in goats and horses [24–25]. In rodents, the long chain fatty acids margarate (17:0), 10-heptadecenoate (17:1n7), and oleate (18:1n9) all peaked at 9:30 [2]. In pigs, most of the long chain fatty acids peaked at night [14]. However, in the current study, we found that long chain fatty acids in the serum of hens fluctuated over 24 h, and most of the long chain fatty acids had two peaks at 7:30 and 19:30. Furthermore, this fluctuation coincides with the variation of transcripts related to lipid synthesis, lipid metabolism, and fatty acid metabolism, including ACOX1, EHHADH, SQLE, HADHA, HADHB, EPT1, HSD17B7, FASN, NSDHL, and MSMO1. However, the genes involved in lipid synthesis that were previously reported to vary diurnally in pigs and mice [14, 26–27], such as apolipoprotein B (apoB), fatty acid binding protein (FABP), delta 5-desaturase (FASD1), delta 6-desaturase (FASD2), fatty acid elongase 5 (ELOVL5), and fatty acid elongase 2 (ELOVL2), were not found in hens.
Collectively, our results showed that the de novo synthesis of steroid hormones, and the metabolism of glucose, proteins, lipids, as well as oxidative and anti-oxidative enzymes displayed time-of-day rhythms. Since nutritional challenges could reprogram the circadian clock, these findings are of great importance in animal precision nutrition, and prevention of nutritional and metabolic diseases related to the circadian clock.
MATERIALS AND METHODS
Experimental design and sample collection
A total of 60 brown Hy-line laying hens were selected at 41 wk (Xingjia Inc., Changsha, China) and housed individually in 39 × 35 × 38 cm wire cages. Hens were kept under a 16L:8D cycle from 06:00 to 22:00 with ad libitum access to corn-soybean-based diets (NRC, 1994) [28] (Supplementary Table 4) and drinking water for 70 d to acquire the same biological rhythm. During these days, eggs were collected and counted daily at 07:30, 12:00, and 19:30 to calculate diurnal egg-laying rates. Subsequently, blood samples (n = 6 per sampling time point) of the hens were collected intravenously at 4-h intervals in a daily cycle starting at 03:30, and then livers were harvested, rinsed in PBS, and snap frozen in liquid nitrogen for RNA sequencing. Particularly, the heads of the chickens that slaughtered at 3:30 and 23:30 were with lightproof bags to avoid light exposure.
Transcriptomic study
Liver samples of 36 hens that were slaughtered at 3:30, 7:30, 11:30, 15:30, 19:30, and 23:30 (n = 6 at each sampling time) were used for total RNA isolation. After quantification, the six samples in each group were pooled into three biological replicates and submitted for DGE experiments by Novogene Bioinformatics Technology Co. Ltd (Beijing) on an Illumina Hiseq platform, and 125/150 bp paired-end reads were generated. Total reads were mapped to the Gallus gallus genome in ensemble (http://www.ensembl.org/Gallus_gallus/Info/Index) using Bowtie v2.2.3 and TopHat v2.0.12 software. HTSeq v0.6.1 was used to count the read numbers mapped to each gene based on the length of the gene and read count mapped to this gene. Differential expression analysis of two groups was performed using the DESeq R package (1.18.0). The resulting P-values were adjusted using Benjamini and Hochberg’s approach for controlling the false discovery rate. Genes with log2 fold change >1 and adjusted P-value < 0.05 found by DESeq were assigned as differentially expressed.
Real-time polymerase chain reaction (RT-PCR)
Quantitative real-time polymerase chain reaction (RT-PCR) was performed to validate the results of transcriptome sequencing and determine the expression levels of the selected genes in livers in different sampling periods. Fold differences in expression levels were calculated using the 2-ΔΔCtmethod. Primers and amplicon sizes are listed in Supplementary Table 5.
Glucose, amino acids, and fatty acids analyses
Serum glucose was assessed using a discrete type of auto analyzer, the Hitachi 7150 (Hitachi Medical, Tokyo, Japan). Serum free amino acids were measured on an Automatic Amino Acid Analyzer (Hitach L-8800) as previously described. PUFA contents were analyzed according to previously reported methods by GC-MS, using 19:0 methyl ester as an internal standard [14].
Statistical analysis
Statistical analysis was performed using SPSS 17.0 for Windows (SPSS Inc., Chicago, IL). All results are expressed as Mean values. The differences among treatments were evaluated using one-way analysis of variance (ANOVA), considering time point as a fixed effect and hen ID as a randomized effect. Data are presented as least squares means ± SEM. Data were also analyzed by “CircWave” software (v. 1.4, courtesy of R. Hut; http://www.euclock.org) to confirm the diurnal rhythmicity. Probability values < 0.05 were considered statistically significant.
Abbreviations
PUFA, long chain polyunsaturated FA; FFA, free fatty acids; CYPs, cytochrome oxidases; HSP, heat shock proteins; TC, total cholesterol; TG, triglyceride; TP, total protein; RT-PCR, Quantitative real-time polymerase chain reaction; HPA, hypothalamic-pituitary-gonadal; PPARD, peroxisome proliferator-activated receptor delta; SOD3, Cu-Zn superoxide dismutase; ABCG5, ATP-binding cassette transporters G5; CYP1A4, cytochrome P450 1A4 enzyme; HKDC1, Hexokinase Domain Containing 1; HSPA5, heat shock 70 kDa protein 5; LAMB3, β3 polypeptide chain of laminin 5; SLCO2B1, organic anion transporting polypeptide 2B1.
Author contributions
W.D, Z.X, W.X, H.R, R.Z and Y.Y designed the experiment. W.D, L.Y, L.G, Z.Y and L.L conducted the experiment. W.D, Z.Y and Z.X analyzed the data and prepared tables and figures. W.D, W.X and Z.X prepared the manuscript. All authors reviewed the manuscript.
CONFLICTS OF INTEREST
The authors declare no competing interests.
FUNDING
This research received financial support from National Key R&D Program of China (2016YFD0500504; 2016YFD0501201), Major Project of Henan Province (171100110500).
REFERENCES
1. Oishi K, Miyazaki K, Kadota K, Kikuno R, Nagase T, Atsumi G, Ohkura N, Azama T, Mesaki M, Yukimasa S, Kobayashi H, Iitaka C, Umehara T, et al. Genome-wide expression analysis of mouse liver reveals CLOCK regulated circadian output genes. J Biol Chem. 2003; 278: 41519-41527.
2. Eckel-Mahan KL, Patel VR, Mohney RP, Vignola KS, Baldi P, Sassone-Corsi P. Coordination of the transcriptome and metabolome by the circadian clock. Proc Natl Acad Sci U S A. 2012; 109: 5541-5546.
3. Bailey SM, Udoh US, Young ME. Circadian regulation of metabolism. J Endocrinol. 2014; 222: R75-R96.
4. Gooley J. Circadian regulation of lipid metabolism. Proc Nutr Soc. 2016; 75: 440-450. https://doi.org/10.1017/S0029665116000288.
5. Rudic RD, McNamara P, Curtis AM, Boston RC, Panda S, Hogenesch JB, Fitzgerald GA. BMAL1 and CLOCK, two essential components of the circadian clock, are involved in glucose homeostasis. PLoS Biol. 2004; 2: 377.
6. Liu Y, Lin X, Zhou X, Wan D, Wang Z, Wu X, Yin Y. Effects of dynamic feeding low and high methionine diets on egg quality traits in laying hens. Poult Sci. 2017; 96: 1459-1465.
7. Miller BH, McDearmon EL, Panda S, Hayes KR, Zhang J, Andrews JL, Antoch MP, Walker JR, Esser KA, Hogenesch JB, Takahashi JS. Circadian and CLOCK-controlled regulation of the mouse transcriptome and cell proliferation. Proc Natl Acad Sci U S A. 2007; 104: 3342-3347.
8. Akhtar RA, Reddy AB, Maywood ES, Clayton JD, King VM, Smith AG, Grant TW, Hastings MH, Kyriacou CP. Circadian cycling of the mouse liver transcriptome, as revealed by cDNA microarray, is driven by the suprachiasmatic nucleus. Curr Biol. 2002; 12: 540-550.
9. Panda S, Antoch MP, Miller BH, Su AI, Schook AB, Straume M, Schultz PG, Kay SA, Takahashi JS, Hogenesch JB. Coordinated transcription of key pathways in the mouse by the circadian clock. Cell. 2002; 109: 307-320.
10. Storch KF, Lipna OIL, Viswanathan N, Davis F, Wong W, Weitz C. Extensive and divergent circadian gene expression in liver and heart. Nature. 2002; 417: 78-83.
11. Ueda HR, Chen W, Adachi A, Wakamatsu H, Hayashi S, Takasugi T, Nagano M, Nakahama K, Suzuki Y, Sugano S, Iino M, Shigeyoshi Y, Hashimoto S. A transcription factor response element for gene expression during circadian night. Nature. 2002; 418: 534.
12. Kohsaka A, Laposky AD, Ramsey KM, Estrada C, Joshu C, Kobayashi Y, Turek FW, Bass J. High-fat diet disrupts behavioral and molecular circadian rhythms in mice. Cell Metab. 2007; 6: 414-421.
13. Zhou X, Wan D, Zhang Y, Zhang Y, Long C, Chen S, He L, Tan B, Wu X, Yin Y. Diurnal variations in polyunsaturated fatty acid contents and expression of genes involved in their de novo synthesis in pigs. Biochem Biophys Res Commun. 2017; 483: 430-434.
14. Froy O. The relationship between nutrition and circadian rhythms in mammals. Front Neuroendocrinol. 2007; 28: 61-71.
15. Bolli GB, De Feo P, De Cosmo S, Perriello G, Ventura MM, Calcinaro F, Lolli C, Campbell P, Brunetti P, Gerich JE. Demonstration of a dawn phenomenon in normal human volunteers. Diabetes. 1984; 33: 1150-1153.
16. Arslanian S, Ohki Y, Becker DJ, Drash AL. Demonstration of a dawn phenomenon in normal adolescents. Horm Res. 1990; 34: 27-32.
17. Dyar KA, Ciciliot S, Wright LE, Biensø RS, Tagliazucchi GM, Patel VR, Forcato M, Paz MI, Gudiksen A, Solagna F, Albiero M, Moretti I, Eckel-Mahan KL, et al. Muscle insulin sensitivity and glucose metabolism are controlled by the intrinsic muscle clock. Mol Metab. 2014; 3: 29-41.
18. Piccione G, Caola G, Refinetti R. Temporal relationships of 21 physiological variables in horse and sheep. Comp Biochem Physiol A Mol Integr Physiol. 2005; 142: 389-396.
19. Kumar Jha P, Challet E, Kalsbeek A. Circadian rhythms in glucose and lipid metabolism in nocturnal and diurnal mammals. Mol Cell Endocrinol. 2015; 418: 74-88. https://doi.org/10.1016/j.mce.2015.01.024.
20. Zhang Y, Zhou X, Zhang B, Wu X, Yin Y. Diurnal rhythm in mRNA expression of genes encoding amino acid transporter and circadian gene cry in intestinal mucosa of piglets. Biol Rhythm Res. 2017; 48: 1-9.
21. Carroll KF, Nestel PJ. Diurnal variation in glucose tolerance and in insulin secretion in man. Diabetes. 1973; 22: 333-348.
22. Gibson T, Stimmler L, Jarrett RJ, Rutland P, Shiu M. Diurnal variation in the effects of insulin on blood glucose, plasma non-esterified fatty acids and growth hormone. Diabetologia. 1975; 11: 83-88.
23. Orme CE, Dunnett M, Harris RC. Variation in the concentration of long chain free fatty acids in equine plasma over 24 hours. Br Vet J. 1994; 150: 339-347.
24. Alila-Johansson A, Eriksson L, Soveri T, Laakso ML. Daily and annual variations of free fatty acid, glycerol and leptin plasma concentrations in goats (Capra hircus) under different photoperiods. Comp Biochem Physiol A Mol Integr Physiol. 2004; 138: 119-31.
25. Pan X, Hussain MM. Diurnal regulation of microsomal triglyceride transfer protein and plasma lipid levels. J Biol Chem. 2007; 282: 24707-24719.
26. Pan X, Zhang Y, Wang L, Hussain MM. Diurnal regulation of MTP and plasma triglyceride by CLOCK is mediated by SHP. Cell Metab. 2010; 12: 174-186.
27. National Research Council. 1994. Nutrient Requirements of Poultry. 9th Rev. ed. Acad. Press, Washington, DC.
28. Xie C, Wu X, Guo X, Long C, Li S, Hu CA, Yin Y. Maternal chitosan oligosaccharide supplementation affecting expression of circadian clock genes, and possible association with hepatic cholesterol accumulation in suckling piglets. Biol Rhythm Res. 2016; 47: 253-265.