
INTRODUCTION
Intraductal papillary mucinous neoplasm (IPMN) has been increasingly recognized as an important cystic precursor of pancreatic cancer [1]. It has been suggested that IPMN undergoes a progression pattern, which consists of hyperplasia, dysplasia, and invasive carcinoma sequence [2, 3]. Numerous efforts have been made to identify the genetic changes associated with progression of IPMN. Since preoperative assessment of gene expression profiling has been used to differentiate invasive from noninvasive IPMNs [4], GNAS and KRAS mutations have been identified by direct sequencing [5], and immunohistochemical analysis suggested correlations between fascin overexpression and increased histological grade of IPMN [6]. Copy number gain of chromosome 3q was also found to be associated with IPMN progression [7]. Loss of expression of PTEN [8] and Plectin-1 [9] have also been reported to be associated with poor prognosis or malignant progression of IPMN.
However, despite the previous efforts, the molecular mechanism involved in the malignant progression in IPMN remains unknown. Moreover, many lesions are heterogeneous, with varying degrees of dysplastic and invasive regions within the same specimen [10]. Adequate sampling is crucial for recognition of invasive carcinoma, as it may be present in only as small part of the lesion. Current consensus guidelines still rely mostly on radiologic findings to detect signs of high-grade or invasive lesions, which commonly lead to misdiagnosis of its invasiveness. The role of imaging modalities to predict cancer progression and individualize patient management is limited, since they do not predict risk of malignant transformation [11]. Therefore, there is an urgent need to investigate the genetic changes of carcinogenesis of IPMN in order to improve the diagnosis and management of IPMN. In this study, gene expression profiling was performed to determine differentially expressed genes (DEGs) associated with malignant progression of IPMN; the prognostic significance of the identified DEGs, as well as their potential as biomarkers, were evaluated.
RESULTS
Patient characteristics
For gene expression profiling, 76 IPMN samples consisted of 47 gastric, 16 intestinal, 11 pancreatobiliary, and 2 oncocytic subtypes were used. Samples included low-grade (n = 11), intermediate-grade (n = 31), high-grade dysplasia (n = 14), as well as IPMN with an associated invasive carcinoma (invasive IPMN, n = 20). Patients consisted of 46 men (63.9%) with a median age of 65.5 ± 7.7 years at the time of diagnosis. For final analysis, low-grade dysplasia (n = 11) and invasive IPMN samples (n = 9) of the gastric subtype were compared; this included 11 men (64.7%) with a median age of 63.0 ± 6.5 years at the time of diagnosis. The diameter of the tumor ranged between 2.4-7.6 cm (median 3.1 cm); and the number of main duct, branch duct, and mixed type cases were 2, 10, and 5, respectively. Lymph node metastasis was identified in 1 out of 9 invasive IPMNs.
Detailed clinicopathological data of patients whose samples were subjected to immunohistochemical analysis are presented in Table 1. Of the 87 patients, pancreas head resection was performed in 44 cases, distal resection and limited pancreatic resection were conducted in 27 and 7 cases, respectively. Curative resection was performed in 86 cases except for one patient, who showed peritoneal seeding. Invasive carcinoma was diagnosed in 20.7% of the cases, and lymph node metastasis was found in 4 patients. The histologic subtype of the study patients were as follows: 52 (59.8%) gastric types, 17 (19.5%) pancreatobiliary types, 16 (18.4%) intestinal types, and 2 (2.3%) oncocytic types. Overall 5 year disease-specific survival rate of patients was 72.2%. No disease-related death was observed in low, moderate, and high grade dysplasia IPMN. Among the 18 patients with invasive IPMN, 5 patients died as a result of IPMNs, and 2 patients died owing to other types of cancer. During the 51.8 months of median follow-up period, recurrence was observed in 9 patients: 1 patient with low-grade dysplasia, 2 patients with intermediate-grade dysplasia, and 6 patients with invasive IPMN.
Table 1: Clinicopathological characteristics of 87 IPMNs included in immunohistochemical analysis
Parameter |
n = 87 |
|---|---|
Age (years, median ± SD) |
65.0 ± 8.3 |
Sex (male) |
53 (60.9%) |
Dysplasia |
|
Low grade |
15 (17.2%) |
Intermediate grade |
40 (46.0%) |
High grade |
14 (16.1%) |
IPMN associated with an invasive carcinoma |
18 (20.7%) |
Histologic subtype |
|
Gastric |
52 (59.8%) |
Pancreatobiliary |
17 (19.5%) |
Intestinal |
16 (18.4%) |
Oncocytic |
2 (2.3%) |
Operative methods |
|
Whipple’s operation/PPPD |
13/31 (50.6%) |
DP/SPDP |
24/3 (31.0%) |
Total/subtotal pancreatectomy |
5/4 (10.3%) |
Enucleation |
4 (4.6%) |
Others* |
3 (3.4%) |
Cyst size (mm, median ± SD) |
28.0 ± 17.0 |
≥30 mm |
40 (46.0%) |
Diameter of main pancreatic duct (mm, median ± SD) |
3.3 ± 5.2 |
<5 mm |
52 (59.8%) |
≥5, <10 mm |
21 (24.1%) |
≥10 mm |
14 (16.1%) |
T stage |
|
T is/1/2 |
14/1/5 (23.0%) |
T3/4 |
11/1 (13.8%) |
Lymph node metastasis |
4 (4.6%) |
Distant metastasis |
1 (1.1%) |
5 year disease-specific survival |
94.3% |
Noninvasive (n = 69) |
100.0% |
IPMN associated with an invasive carcinoma (n = 18) |
72.2% |
*Pancreatic head resection with segmental duodenectomy (n = 2), Duodenal-preserving resection of the head of the pancreas (n = 1)
SD, standard deviation; IPMN, intraductal papillary mucinous neoplasm; PPPD, pylorus-preserving pancreaticoduodenectomy; DP, distal pancreatectomy; SPDP, spleen-preserving distal pancreatectomy
Differentially expressed gene analysis
In order to find the minimal number of factor that can consistently match the gene expression pattern of the control genes, the relative log expression (RLE) boxplots of the control genes were obtained (Figure 1). The expressions of the control genes were not properly normalized using the Robust Multi-Array Average (RMA) normalization (Figure 1A). When Removing Unwanted Variation (RUV) was performed, the median of RLE boxplots of all samples became almost constant (Figure 1B–1I). When the number of factors was more than 3, the inter quartile range (IQR) values of the control gene became similar (Figure 1D–1I). Since one cannot completely match the number of the factors with gene expression patterns, and the expression patterns of the control genes within IQR levels can be adjusted by RUV, the optimal number of factors was considered to be 3–5.
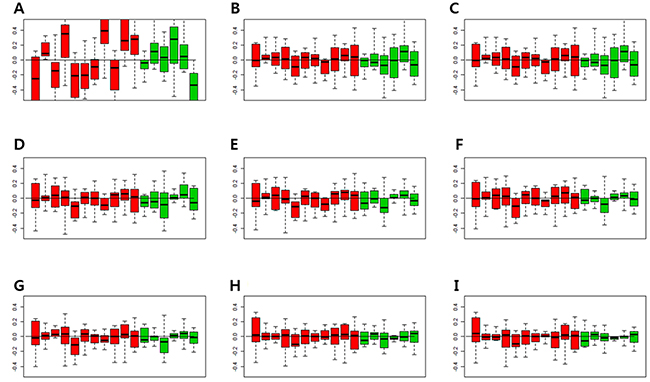
Figure 1: Relative log expression (RLE) plots for all control genes. The RLE plots of control genes with 1-8 factors were compared to determine the appropriate number of factors that were consistent with the gene expression patterns of control genes. (A) RLE plot by the RMA normalization. (B) RLE plot normalized by RUV, number of factors (κ) = 1. (C) RLE plot normalized by RUV, κ = 2. (D) RLE plot normalized by RUV, κ = 3. (E) RLE plot normalized by RUV, κ = 4. (F) RLE plot normalized by RUV, κ = 5. (G) RLE plot normalized by RUV, κ = 6. (H) RLE plot normalized by RUV, κ = 7. (I) RLE plot normalized by RUV, κ = 8. (Red boxplots indicate low-grade dysplasia and green boxplots indicate invasive IPMNs. Lines inside the boxplots indicate median values).
Figure 2 shows p-values of DEGs obtained by the RUV-4 method, with an increase in the number of factors. P-values of some control genes were less than 0.05 before RUV was performed (Figure 2A). After RUV-4 was performed, the control genes with p-value of less or equal to 0.2 were identified when the number of factors was 1 or 2 (Figure 2B, 2C). The p-values of control genes were greater or equal to 0.2 when more than 4 factors were used (Figure 2E–2H). When the number of factors was greater than 6, the control genes lost too much variation, and the p-value tended to become extremely high (Figure 2G, 2H). Therefore, Figure 2D seemed appropriate. Figure 3 shows the RLE plot of all genes. When the number of factors was greater than 7, the range of gene expression in some samples became much smaller as compared with that in other samples (Figure 3H, 3I). These results suggested that the optimal number of factors required to maintain the expression patterns of DEGs while adjusting for expression patterns of the control gene was 3–5 (Figure 3A–3G). Since the RUV method cannot eliminate all unwanted variations, and fitting too many factors causes biases, it was decided to use 3 factors to perform RUV-4.
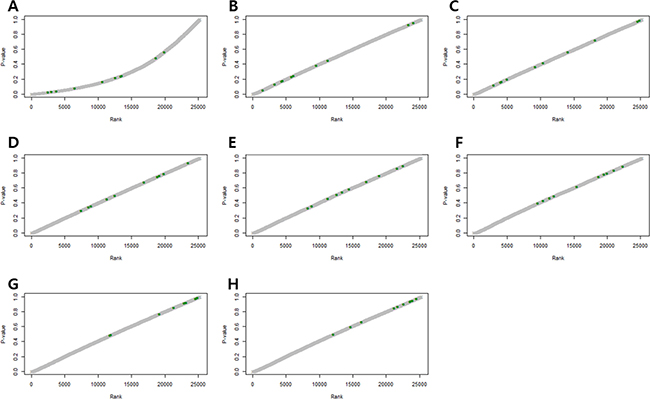
Figure 2: P-value plots of control genes. (A) Unadjusted P-value plots. Some p-values of the control genes are less than 0.05. (B) P-value plots normalized by RUV, κ = 1. (C) P-value plots normalized by RUV, κ = 2. (D) P-value plots normalized by RUV, κ = 3. (E) P-value plots normalized by RUV, κ = 4. (F) P-value plots normalized by RUV, κ = 5. (G) P-value plots normalized by RUV, κ = 6. (H) P-value plots normalized by RUV, κ = 7. (Green dots indicate control genes).
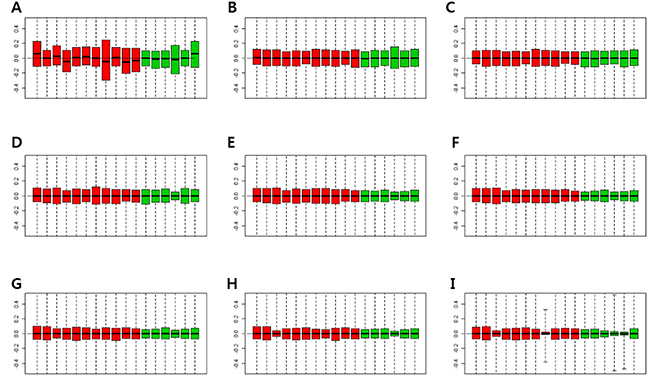
Figure 3: Relative log expression (RLE) plots for all genes. (A) RLE plot by RMA normalization. (B) RLE plot normalized by RUV-4 method with number of factors (κ) = 1. (C) RLE plot normalized by RUV-4, κ = 2. (D) RLE plot normalized by RUV-4, κ = 3. (E) RLE plot normalized by RUV-4, κ = 4. (F) RLE plot normalized by RUV-4, κ = 5. (G) RLE plot normalized by RUV-4, κ = 6. (H) RLE plot normalized by RUV-4, κ = 7. (I) RLE plot normalized by RUV-4, κ = 8. (Red boxplots indicate low-grade dysplasia, green boxplots indicate invasive IPMN. Lines inside the boxplot indicate median values).
The p-value histograms of each methodology used to calculate the p-value is shown in Figure 4. The histogram obtained from t-tests exhibited an exponential distribution (Figure 4A). This suggested that unwanted variations of the control genes caused p-value deflation when t-tests were performed. Variance calculation using statistical methods such as the standard, empirical Bayes (e-bayes), rescaled variance (rsvar), and rescaled variance with empirical Bayes (rsvar e-bayes) demonstrated uniform distribution when p-value was greater or equal to 0.1 (Figure 4B–4E). However, extremely low p-values were obtained for many genes, which implied that there were more false positives present owing to calculation error of the variance of the statistic. When the variance of the statistic was calculated using the empirical variance, the distribution of the p-value (≥ 0.01) was uniformly adjusted. In addition, the peak was found only in p-values that were less or equal to 0.01 (Figure 4F). Therefore, DEGs were established by the RUV-4 method with 3 factors and empirical variance adjustments. Table 2 lists the top 10 DEGs, of which the q-values were less than 0.05. Among the listed DEGs, zinc finger E-box binding homeobox 1 (ZEB1), which is a crucial regulator of EMT, was selected for validation of results. E-cadherin and vimentin were also validated to figure out an association of EMT with the prognosis of IPMN.
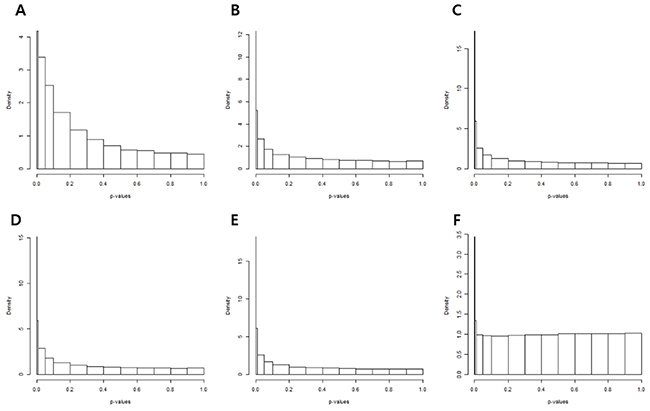
Figure 4: P-value histograms of each removing unwanted variation methodology. (A) The histogram obtained from t-tests show exponential distribution. The variance of the statistic was calculated by (B) the standard method, (C) empirical bayes, (D) rescaled variance, and (E) rescaled variance with empirical Bayes. (F) Distribution and peak of p-values when variance of the statistic was calculated by the empirical variance
Table 2: Top 10 differentially expressed gene
Probe ID |
Gene name |
RUV-4 |
t-test |
||||
|---|---|---|---|---|---|---|---|
Log2 (fold change) |
p-value* |
q-value |
Log2 (fold change) |
p-value |
q-value |
||
7927732 |
ARID5B |
0.731982 |
2.30E-09 |
5.81E-05 |
0.426343 |
0.019245 |
0.232898 |
7925320 |
NID1 |
0.903102 |
1.02E-08 |
0.000129 |
0.365858 |
0.123152 |
0.347692 |
7926916 |
ZEB1 |
0.905861 |
1.40E-07 |
0.001182 |
0.358714 |
0.144518 |
0.368832 |
8145470 |
DPYSL2 |
0.696156 |
4.71E-07 |
0.002803 |
0.167631 |
0.3867 |
0.586169 |
8077528 |
SETD5 |
0.458547 |
5.54E-07 |
0.002803 |
0.502361 |
0.003411 |
0.226113 |
8143054 |
AKR1B1 |
0.720922 |
4.84E-06 |
0.020398 |
0.433627 |
0.053769 |
0.271417 |
7965123 |
PPP1R12A |
0.654542 |
6.09E-06 |
0.020952 |
0.347578 |
0.103782 |
0.326709 |
8049487 |
MLPH |
–0.88485 |
6.63E-06 |
0.020952 |
–0.00721 |
0.984862 |
0.992079 |
8119016 |
MAPK13 |
–0.54298 |
7.64E-06 |
0.021475 |
–0.07527 |
0.647691 |
0.783974 |
8141035 |
SGCE |
0.654982 |
1.43E-05 |
0.036157 |
0.079062 |
0.722441 |
0.833266 |
*The variance of the statistic calculated by empirical variance.
Correlation between the expression of immunohistochemical markers and clinicopathological factors
The correlation between immunohistochemical patterns of E-cadherin and ZEB1 and clinicopathological factors was analyzed. Loss of E-cadherin (p = 0.015) and presence of ZEB1 expression in stromal cells (stromal ZEB1, p < 0.001) were significantly associated with degree of dysplasia (Table 3).
Table 3: Correlation between expression of immunohistochemical markers and clinicopathological factors
Parameters |
E-cadherin |
Epithelial ZEB1 |
Stromal ZEB1 |
||||||
|---|---|---|---|---|---|---|---|---|---|
No loss (n = 77) |
Loss (n = 10) |
p-value |
Negative (n = 84) |
Positive (n = 3) |
p-value |
Negative (n = 77) |
Positive (n = 10) |
p-value |
|
Age (years, median ± SD) |
63.6 ± 8.3 |
68.1 ± 7.7 |
0.103 |
64.0 ± 8.2 |
66.7 ± 11.2 |
0.585† |
63.9 ± 8.6 |
65.3 ± 5.9 |
0.623 |
Sex (male) |
47 |
6 |
0.949 |
51 |
2 |
0.836* |
45 |
8 |
0.189 |
Dysplasia |
0.015 |
0.107* |
<0.001* |
||||||
Noninvasive |
64 |
5 |
68 |
1 |
67 |
2 |
|||
Invasive |
13 |
5 |
16 |
2 |
10 |
8 |
|||
Subtype (noninvasive : invasive) |
|||||||||
Gastric |
46:0 |
4:2 |
0.011* |
49:1 |
0:2 |
0.002* |
48:1 |
1:2 |
0.007* |
Intestinal |
9:4 |
1:2 |
0.518* |
10:5 |
1:0 |
1.00* |
10:4 |
0:2 |
0.125* |
Pancreatobiliary |
9:7 |
0:1 |
0.471* |
9:8 |
0:0 |
NA |
9:4 |
0:4 |
0.029* |
Oncocytic |
0:2 |
0:0 |
NA |
0:2 |
0:0 |
NA |
0:1 |
0:1 |
NA |
T stage |
0.268* |
0.529* |
0.316* |
||||||
T1/T2 |
3 |
3 |
6 |
0 |
4 |
1 |
|||
T3/T4 |
10 |
2 |
10 |
2 |
6 |
7 |
|||
Lymph node metastasis |
2 |
2 |
0.063* |
3 |
1 |
0.133* |
3 |
1 |
0.359* |
Cyst size (≥30 mm) |
37 |
3 |
0.331* |
39 |
1 |
1.00* |
36 |
4 |
1.00* |
Diameter of pancreatic duct (mm, median ± SD) |
5.3 ± 5.3 |
5.4 ± 4.9 |
0.957 |
5.3 ± 5.3 |
5.4 ± 3.9 |
0.976† |
5.1 ± 5.3 |
6.8 ± 4.1 |
0.365 |
*Fisher’s exact test
†Mann-Whitney U test
SD, standard deviation; NA, not available.
Since DEGs were obtained by comparing low-grade dysplasia and invasive IPMN of the gastric subtype, subgroup analysis was performed according to histological subtypes. In the gastric subtype, loss of E-cadherin expression was observed more frequently in invasive IPMN (100.0%) as compared with noninvasive IPMN (8.0%, p = 0.011). ZEB1 expression in epithelial cells (epithelial ZEB1, 66. 7% vs. 0%, p = 0.002) and expression of stromal ZEB1 (66.7% vs. 2.0%, p = 0.007) were also significantly different between invasive and noninvasive IPMN. Stromal ZEB1 was more frequently expressed in invasive IPMN of the pancreatobiliary subtype (50.0% vs. 0%, p = 0.029). However, E-cadherin and epithelial ZEB1 did not show significant association with invasive IPMN in the subgroup analysis (Table 3). Both epithelial and stromal ZEB1 were expressed in two samples, and statistically relevant correlations were obtained between the epithelial and stromal ZEB1 expression (p = 0.002).
Positive staining of vimentin, though rarely seen, was found in 3.4% of the samples (n = 3). However, two of those three samples were stained less than 5% of the cytoplasm (grade 1) in non-neoplastic lesion of IPMN with intermediate-dysplasia. Only one sample of intermediate-dysplasia was stained as grade 2.
Logistic regression analysis revealed that loss of E-cadherin expression (p = 0.023, odd ratio [OR] = 4.923) and stromal ZEB1 (p < 0.001, OR = 26.800) were significantly correlated with degree of dysplasia. Epithelial ZEB1 expression showed marginal significance with degree of dysplasia (p = 0.088, OR = 8.500) (Table 4).
Table 4: Logistic regression analysis of immunohistochemical markers associated with increased risk of IPMN associated with an invasive carcinoma
Odd ratio |
95% CI |
p-value |
|
|---|---|---|---|
E-cadherin |
4.923 |
1.244–19.482 |
0.023 |
Epithelial ZEB1 |
8.500 |
0.725–99.636 |
0.088 |
Stromal ZEB1 |
26.800 |
4.965–144.654 |
<0.001 |
CI, confidence interval
Survival analysis
Disease-specific survival was significantly associated with expression of IHC markers. Poor disease-specific survival was found in patients with loss of E-cadherin expression (97.4 months vs. 62.2 months, p = 0.004) and expression of epithelial ZEB1 (96.5 months vs. 42.0 months, p < 0.001). Differences in survival rates were also correlated with expression of stromal ZEB1 (96.5 months vs. 56.6 months, p = 0.020) (Figure 5).
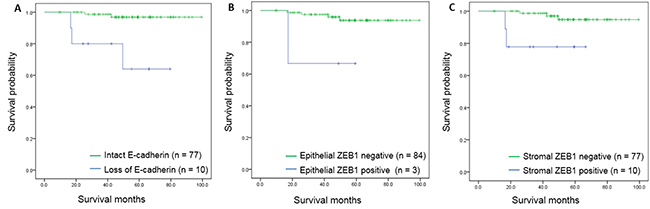
Figure 5: Kaplan-Meier survival curves for disease-specific survival according to immunohistochemical markers. (A) Survival curves according to E-cadherin expression (p < 0.001). (B) Survival curves according to epithelial ZEB1 expression (p = 0.025). (C) Survival curves according to stromal ZEB1 expression (p = 0.009).
Using the Cox proportional hazards model, the hazard of death was found to be significantly increased in patients with loss of E-cadherin expression (hazard ratio [HR] = 13.718, p = 0.004), expression of epithelial ZEB1 (HR = 19.117, p = 0.001), and stromal ZEB1 (HR = 6.373, p = 0.043) (Table 5).
Table 5: Cox proportional hazard model analysis for disease-specific survival according to immunohistochemical markers
Hazard ratio |
95% CI |
p-value |
|
|---|---|---|---|
E-cadherin |
13.718 |
2.280–82.519 |
0.004 |
Epithelial ZEB1 |
19.117 |
3.176–115.074 |
0.001 |
Stromal ZEB1 |
6.373 |
1.059–38.369 |
0.043 |
CI, confidence interval.
Prognostic relevance of immunohistochemical markers
In the receiver operating characteristics (ROC) curve analysis, the area under the curve (AUC) for E-cadherin and stromal ZEB1 was 0.603 (p = 0.182) and 0.680 (p = 0.019), respectively (Figure 6). Stromal ZEB1 demonstrated a sensitivity of 38.8% and a specificity of 97.1%. Positive prediction value (PPV) and negative prediction value (NPV) of stromal ZEB1 for prediction of poor survival was 77.8% and 85.9%, respectively.
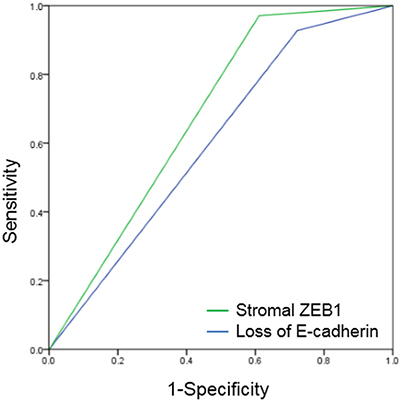
Figure 6: Receiver operating characteristic (ROC) curves of E-cadherin and stromal ZEB1. AUC for E-cadherin was 0.603 (p = 0.182), and stromal ZEB1 was 0.680 (p = 0.019).
DISCUSSION
Epithelial-to-mesenchymal transition (EMT) is a multi-stage trans-differentiation process that epithelial cells undergo to attain the mesenchymal phenotype, which contributes to inflammation, wound healing, and carcinogenesis [11–13]. During EMT progression, epithelial cells lose their epithelial markers (such as E-cadherin, claudin, and laminin 1) and gain mesenchymal markers (such as vimentin and fibronectin) [14]. EMT is widely investigated in various cancers due to its association with tumor progression, metastasis, poor prognosis, and drug resistance [14–18].
One transcription factor that orchestrates the EMT is ZEB1, which is encoded by the TCF8 gene, and is the vertebrate homologue of the ZFH gene family of zinc finger/homeodomain proteins. It is known to be a key mediator of EMT, and induces EMT by inhibiting expression of E-cadherin and miRNAs [19–23]. Previous studies have demonstrated that expression of ZEB1 is correlated with advanced tumor grade and poor outcomes in pancreatic cancer [24–29]. However, little is known about the role of EMT in IPMN. Gene expression changes associated with EMT during the progression of IPMN was first examined in a study by gene set enrichment analysis (GSEA) and Ariadne sub-network analysis in 28 IPMN samples [10]. Lahat et al. demonstrated that positive EMT status was associated with reduced disease-free survival in IPMN patients, suggesting that the EMT markers could be utilized as potential biomarker in IPMN [11]. Expression of Twist and Bmi1, which are involved in the initiation and execution of EMT, was also reported to be associated with aggressiveness and poor prognosis of IPMN [30]. In accordance with these data, loss of E-cadherin expression (OR = 4.923, p = 0.023) and expression of stromal ZEB1 (OR = 26.800, p < 0.001) was correlated with degree of dysplasia. Disease-specific survival differed significantly according to different according to the loss of E-cadherin expression (97.4 months vs. 62.2 months), expression of epithelial ZEB1 (96.5 months vs. 42.0 months), and stromal ZEB1 (96.3 months vs. 56.6 months). These results suggested that E-cadherin and ZEB1 may be used as prognosticators of IPMN.
The incidence of positively stained vimentin in the present study was lower than of 6.0% [29] and 58.0% [11] incidence observed in previous studies. EMT involves progressive loss of epithelial markers and gain of mesenchymal markers during the functional transition of polarized epithelial cells into mobile and ECM component-secreting mesenchymal cells [14]. According to previous study, mesenchymal markers such as vimentin was overexpressed in the poorly differentiated and not in the well-differentiated pancreatic carcinomas among the overall 11.8% of positive staining of vimentin [31]. Since IPMN with various degrees of dysplasia were included in this study, vimentin expression was scarce and did not qualify as a prognostic predictor for IPMN in the present study.
In this study, ZEB1 expression in the epithelial cell was observed only in 3 cases (3.4%), which is comparable with that reported in a previous study (2%) [29] and consistent with the notion that cancer stem cells occur rarely in the tumor cell population. In regards to stromal ZEB1, ZEB1 has been previously reported to be found in the stromal fibroblasts surrounding the epithelial tumor cells [32, 33]. The functional contributions of stromal cells have been actively investigated since tumor growth is thought to be dependent on the dynamic interaction with adjacent stromal cells that might in turn compromise the tumor microenvironment [34]. There is increasing evidence that stromal cells play a crucial role in the stimulation of epithelial cancer cell growth, paracrine induction of EMT, invasion, and metastasis by interacting with tumor cells [35–38]. In breast carcinomas, expression of ZEB1 has been reported to occur in the stromal compartment of supposing to represent two populations of cells: EMT-transformed neoplastic cells and stromal fibroblastic cells undergoing activation of ZEB1 [39]. Expression of transcription factor ZEB1 in the stromal cells has been proven to be associated with EMT and tumor progression in urothelial [40] and endometrial cancer [33]. Previously, there have been two studies that investigated the prognostic value of stromal ZEB1 in pancreatic cancer [29, 41]. In accordance with those reports, stromal ZEB1 showed correlation with epithelial ZEB1, and was associated with significantly increased risk of invasive IPMN and poor survival in the present study. Stromal ZEB1 had the greatest AUC value of 0.680, with PPV of 77.8% and NPV of 85.9% which implicated that stromal ZEB1 could be a strong prognostic factor of IPMN. To the best of our knowledge, this study is the first attempt to evaluate and validate the clinical relevance of stromal ZEB1 expression in IPMN, which was identified in gene expression profiling.
Several studies have suggested that different clinical characteristics and distinct pathways to malignant progression exist among the various IPMN subtypes. Genetic alteration such as mutational status of GNAS or KRAS [42–44], as well as expression pattern of mucin [42, 43, 45, 46] have been investigated. Recent meta-analysis suggested that subtype identification should be considered in future guidelines for management of IPMN, since subtypes have an impact on disease prognosis [47]. On the contrary, some investigators have shown that histological subtypes have limited prognostic value for pancreatic IPMN, although histological subtypes are associated with degree of dysplasia [48]. This is a controversial topic, and is the subject of much debate. Moreover, several pitfalls exist in the molecular study of IPMN; a single IPMN lesion sample may contain multiple subtypes with varying degrees of dysplasia, from low-grade to invasive carcinoma. Furthermore, the epithelium suitable in quantity and quality for diagnosis and further investigational studies may only reflect a small part of the lesion.
Therefore, several efforts were made in this study to overcome the present challenges. Since gene expression of housekeeping genes remained poorly normalized following RMA normalization, the RUV method was used in this study. The RUV normalization method was developed to reduce errors in gene expression profiling due to unknown structural errors [49]. To reduce unwanted variation, the RUV method decomposes expression patterns of known control genes (e.g. housekeeping genes) into several factors via factor analysis, and normalizes the expression of genes of interest using these factors as covariates. As a result, it yields more accurate estimates of expression fold-changes as compared with other normalization methods [50]. Among the various normalization methodologies, the RUV-4 method was used in this study, which is known to give more stable results [51]. Empirical variance adjustment was performed to calculate the p-values, and to identify DEGs. In addition, low-grade and invasive IPMN of the gastric subtype were compared for identification of DEGs. This was done to exclude biases resulting from possible subtype-associated heterogeneity; subgroup analysis of immunohistochemical results was also performed. However, owing to the limited number of samples and the inherently low epithelial ZEB1 expression levels, subgroup analysis failed to show statistical significance in intestinal and pancreatobiliary subgroups for several assessed factors.
This study has several limitations. The present study is the first to report the prognostic relevance of ZEB1 expression in IPMN, and supports the hypothesis that treatment strategies targeting ZEB1 may also target tumor cells, as well as stromal cells. However, no further information can be inferred regarding the mechanism from this study. Further investigations into the underlying mechanisms may contribute to better management of IPMN. Gene expression profiling was limited to the gastric subtype to reduce heterogeneity. However, this study does not provide information regarding the genetic changes associated with subtypes in the malignant progression of IPMN.
For clinical application of this marker, preoperative use may be limited due to the low sensitivity of current diagnostic modalities. A recent study demonstrated that the overall diagnostic accuracy of endoscopic ultrasound-guided fine needle aspiration ranges from 54% to 97%, and may be lower in smaller cysts [52]. Malignancy within a cystic neoplasm can be identified with 25% to 88% sensitivity [52]. Endoscopic retrograde cholangio-pancreatography tissue sampling also has a relatively low diagnostic yield; a pooled sensitivity of 35.1% [53]. However, molecular analysis in combination with imaging and clinical features was better able to characterize the malignant potential of pancreatic cysts compared to either test alone [54].
In conclusion, gene expression profiling was performed to determine DEGs associated with malignant progression of IPMN and the association of EMT with the prognosis of IPMN was evaluated. Particularly, the clinical relevance of stromal ZEB1 expression in IPMN was investigated inceptively. Loss of E-cadherin and expression of stromal ZEB1 were associated with increased risk of invasive IPMN. Stromal ZEB1, as well as epithelial ZEB1, and E-cadherin were strong predictors of survival in patients with IPMN. Our findings suggest that these EMT markers may be utilized as potential prognosticators and may be used to improve and personalize treatment of IPMN.
MATERIALS AND METHODS
Patient and tissue samples
This study was approved by the Institutional Review Board of the Seoul National University Hospital (H-1309-024-517), and written informed consents were obtained from all participants prior to study initiation. A total of 76 fresh-frozen IPMN tissues were collected from patients who underwent pancreatic resection at the Seoul National University Hospital between June 2009 and February 2013. Tissues were selected for the present study based on the quantities of neoplastic cells. For validation of DEGs, formalin-fixed, paraffin-embedded blocks from 87 patients diagnosed with IPMN following pancreatic resection at the Seoul National University Hospital between April 2002 and October 2009 were selected. The IPMNs were classified into 4 histopathological subtypes; gastric, intestinal, pancreatobiliary, and oncocytic [55]. Degree of dysplasia was classified according to the guidelines set by the World Health Organization classification of Tumors of the Digestive System [56], and were categorized as low-grade dysplasia, intermediate-grade dysplasia, high-grade dysplasia, and IPMN with an associated invasive carcinoma. Staging was examined according to the 7th edition of the American Joint Committee on Cancer staging manual [57]. Clinicopathological data including demographics, radiologic imaging, and histopathological data were prospectively collected in electronic medical record forms. Tissue slides were thoroughly reviewed by a specialized gastrointestinal pathologist (K.B.L.).
mRNA microarray
In the present study, global gene expression was analyzed using the Affymetrix GeneChip® Human Gene 1.0 ST oligonucleotide arrays (Affymetrix). Following the operation, a 1 mm3 sized tumor tissue was immediately collected and stored in a −70°C liquid nitrogen tank until RNA extraction. Total RNA was isolated using the RNeasy Mini Kit columns (Qiagen, Hilden, Germany) according to manufacturer’s instructions. Total RNA (300 ng) from each sample was converted to double-stranded cDNA using a random hexamer incorporating a T7 promoter, and amplified RNA (cRNA) was generated from the double-stranded cDNA template though an in vitro transcription reaction; RNA samples were purified with the Affymetrix sample cleanup module. cDNA was generated through random-primed reverse transcription using a deoxynucleotide-triphosphate (dNTP) mix containing deoxyuridine-triphosphate (dUTP). The cDNA was then fragmented by uracil-DNA glycosylase (UDG) and apurinic/apyrimidinic (AP) 1 restriction endonucleases, and end-labeled by terminal transferase reaction with biotinylated dideoxynucleotide. Fragmented end-labeled cDNA was hybridized to the GeneChip® Human Gene 1.0 ST arrays for 16 hours at 45°C and 60 rpm, as described in the Gene Chip Whole Transcript (WT) Sense Target Labeling Assay Manual (Affymetrix). After the final wash and staining step, Affymetrix GeneChip® Human Gene 1.0 ST oligonucleotide array was scanned using the Affymetrix Model 3000 G7 scanner. Image data was extracted using the Affymetrix Commnad Console software 1.1 (Affymetrix). Expression data were generated by the Affymetrix Expression Console software version1.1 (Affymetrix). RNA concentration was calculated via a spectrophotometer; the purity and integrity of isolated RNA were evaluated by OD260/280 for quality control. In total, 76 samples passed the quality control test, and were selected for further analysis.
Identification of differentially expressed genes
RUV-4 and empirical variance adjustments were performed to determine the DEGs. In order to carry out the RUV method, 2 components were determined. The first component was the selection of control genes in the RUV. Rubie et al. [58] experimentally demonstrated that expression patterns of genes known as housekeeping genes in pancreatic cancer tissues were often different from those in normal tissues. Therefore, 10 control genes were specifically selected based on results of Rubie et al. [58] (18S rRNA, QRRS, PMM1, POLR2L, GUS, TAF2, SDHA, PSMB6, ADA, and UBE2D2); these genes were shown to have comparable expression patterns between pancreatic cancer and normal tissues. The RLE plots of control genes with 1–8 factors were compared to determine the appropriate number of factors that was consistent with the gene expression patterns of the control genes. The differences in gene expression between low-grade dysplasia and invasive IPMN in the control genes were also assessed, and the minimal number of factors required to yield a p-value of > 0.2 for all control genes was determined. After selecting the number of factors that satisfied the above two conditions, RLE boxplots for all genes were obtained, and the variance of the statistic was calculated. All analyses were carried out using the R program ver. 3.3.1 and package “ruv”.
Immunohistochemistry
Immunohistochemical staining was performed at the SuperBioChips Laboratories, Seoul, Korea, to validate the differential expression of selected genes. In order to exclude bias due to possible tumor heterogeneity, 2 punches from the invasive tumor or highest grade dysplasia and 1-2 punches from lower grade dysplasia or non-neoplastic pancreas were obtained from each patient.
Tissue sections (4-μm thick) were cut from each formalin-fixed, paraffin-embedded block, and were deparaffinized and rehydrated. Heat-induced antigen retrieval was performed at 100°C for 24 minutes in cell conditioning 1 solution (Ventana Medical Systems, AZ, USA). Slides were incubated in 3% hydrogen peroxidase for 4 minutes. Immunohistochemical staining was performed using the Optiview DAB IHC Detection Kit (Ventana Medical Systems, AZ, USA). The primary antibodies used were as follows: E-cadherin (BD Biosciences, San Jose, CA, USA, mouse monoclonal, 1:800) and ZEB1 (Novus biologicals, Littleton, CO, USA, rabbit polyclonal, 1:100). Reactions were detected with a diaminobenzidinetetrahydrochloride solution (Biogenex, San Ramon, CA, USA), and hematoxylin counterstaining was performed for 8 minutes.
Scoring of immunohistochemistry
Since there is no generally accepted classification for immunohistochemical ZEB1 expression, authors defined the grades of immunohistochemical staining as follows: E-cadherin expression was evaluated according to the percentage of cells that were labeled, and was categorized as negative when expression was normal (grade 0), and positive when grade was 1–3. The intensity of ZEB1 expression in the epithelium was graded as follows; 0: completely negative; 1: rare dots observed under high magnification; 2: easily recognized dots under high magnification; 3: easily recognized dots under moderate magnification; 4: easily recognized dots under low magnification [41]. Scores of ZEB1 expression in the epithelium were determined by multiplying the grade of the dominant staining intensity by the grade of the area; values were categorized as negative when score was 0 or 1, and positive when score was greater or equal to 2. Representative figures are shown in Figure 7. ZEB1 expression in tumor stroma was classified as positive or negative. Vimentin expression was evaluated with respect to the percentage of cells labeled, and was categorized under grades 0–3 (Table 6).
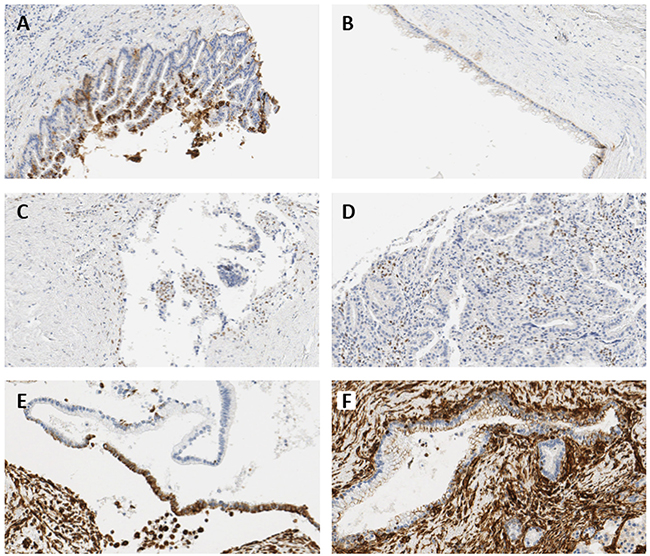
Figure 7: Representative immunohistochemical images showing expressions of E-cadherin and ZEB1. (A) 5–50% loss of E-cadherin in IPMN with high-grade dysplasia, 224× magnification (grade 1). (B) ≥50% loss of E-cadherin in IPMN with moderate-grade dysplasia, 232× magnification (grade 0). (C) Nuclear expression of ZEB1 in the epithelial cells of invasive IPMN, 264× magnification (intensity grade 2, area grade 3, score 6). (D) Positive stromal ZEB1 expression in invasive IPMN, 264× magnification. (E) 5–50% expression of vimentin in IPMN with moderate-grade dysplasia, 264× magnification (grade 2). (F) <5% expression of vimentin in non-neoplastic lesion of IPMN with moderate-grade dysplasia, 264× magnification (grade 1).
Table 6: Scoring criteria of E-cadherin, ZEB1, and vimentin
Grade |
E-cadherin |
ZEB1 |
Vimentin |
||
|---|---|---|---|---|---|
Intensity |
Area |
Stromal cell |
|||
0 |
normal |
Negative |
Negative |
Negative |
Negative |
1 |
<5% loss |
Equivocal |
<5% |
Positive |
<5% |
2 |
5–50% loss |
Weak |
5–50% |
5–50% |
|
3 |
≥50% loss |
Moderate |
≥50% |
≥ 50% |
|
4 |
Strong |
||||
Statistical analysis
Categorical variables were compared via the Chi-squared or the Fisher’s exact test to examine associations between immunohistochemical expression and clinicopathological factors. For comparison of continuous variables, Student’s t-test or the Mann-Whitney U test was used. Logistic regression analysis and Cox proportional hazards model were also performed. For evaluation of predictive parameter values, positive and negative predictive values were calculated from cross-tables and ROC curves; AUCs were calculated. Difference in survival time was calculated by the Kaplan-Meier method, and the log-rank test was applied. P-values of less than 0.05 were considered to be statistically significant. The IBM SPSS Statistics version 20 (SPSS Inc, Chicago, IL) software was used for analyses.
Abbreviations
AUC: area under the curve; DEG: differentially expressed gene; EMT: epithelial-to-mesenchymal transition; HR: hazard ratio; IPMN: intraductal papillary mucinous neoplasm; IPMN with and invasive carcinoma: invasive IPMN; IQR: inter quartile range; NPV: negative prediction value; OR: odds ratio; PPV: positive prediction value; RLE: Relative Log Expression; RMA: Robust Multi-Array Average; ROC: receiver operating characteristics; RUV: removing unwanted variation; ZEB1: zinc finger E-box binding homeobox 1.
Author contributions
Study concept and design: JY Jang and YR Chang; microarray and immunohistochemical experiments: SH Park; pathological review: KB Lee; statistical analysis and interpretation: YK Kim, T Park, and YR Chang; drafting of the manuscript: YR Chang and YK Kim; critical revision and study supervision: JY Jang, SW Kim
CONFLICTS OF INTEREST
The authors declare no conflicts of interest.
FUNDING
This study was supported by a grant of the Korea Health Technology R&D Project through the Korea Health Industry Development Institute, funded by the Ministry of Health & Welfare, Republic of Korea (grant number: HI14C2640, HI16C2037).
REFERENCES
1. Chang YR, Park JK, Jang JY, Kwon W, Yoon JH, Kim SW. Incidental pancreatic cystic neoplasms in an asymptomatic healthy population of 21,745 individuals: Large-scale, single-center cohort study. Medicine (Baltimore). 2016; 95:e5535. https://doi.org/10.1097/MD.0000000000005535.
2. Longnecker DS, Adsay NV, Fernandez-del Castillo C, Hruban RH, Kasugai T, Klimstra DS, Kloppel G, Luttges J, Memoli VA, Tosteson TD, Yanagisawa A, Wilentz R, Zamboni G. Histopathological diagnosis of pancreatic intraepithelial neoplasia and intraductal papillary-mucinous neoplasms: interobserver agreement. Pancreas. 2005; 31:344–9.
3. Tanaka M, Chari S, Adsay V, Fernandez-del Castillo C, Falconi M, Shimizu M, Yamaguchi K, Yamao K, Matsuno S, International Association of P. International consensus guidelines for management of intraductal papillary mucinous neoplasms and mucinous cystic neoplasms of the pancreas. Pancreatology. 2006; 6:17–32. https://doi.org/10.1159/000090023.
4. Sato N, Fukushima N, Maitra A, Iacobuzio-Donahue CA, van Heek NT, Cameron JL, Yeo CJ, Hruban RH, Goggins M. Gene Expression Profiling Identifies Genes Associated with Invasive Intraductal Papillary Mucinous Neoplasms of the Pancreas. The American Journal of Pathology. 2004; 164:903–14. https://doi.org/10.1016/s0002-9440(10)63178-1.
5. Kuboki Y, Shimizu K, Hatori T, Yamamoto M, Shibata N, Shiratori K, Furukawa T. Molecular biomarkers for progression of intraductal papillary mucinous neoplasm of the pancreas. Pancreas. 2015; 44:227–35. https://doi.org/10.1097/MPA.0000000000000253.
6. Yamaguchi H, Inoue T, Eguchi T, Miyasaka Y, Ohuchida K, Mizumoto K, Yamada T, Yamaguchi K, Tanaka M, Tsuneyoshi M. Fascin overexpression in intraductal papillary mucinous neoplasms (adenomas, borderline neoplasms, and carcinomas) of the pancreas, correlated with increased histological grade. Mod Pathol. 2007; 20:552–61. https://doi.org/10.1038/modpathol.3800763.
7. Durante S, Vecchiarelli S, Astolfi A, Grassi E, Casadei R, Santini D, Panzacchi R, Ricci C, Serravalle S, Tarantino G, Falconi M, Teti G, Indio V, et al. Copy number gain of chromosome 3q is a recurrent event in patients with intraductal papillary mucinous neoplasm (IPMN) associated with disease progression. Oncotarget. 2016; 7:74797–806. https://doi.org/10.18632/oncotarget.11501.
8. Garcia-Carracedo D, Turk AT, Fine SA, Akhavan N, Tweel BC, Parsons R, Chabot JA, Allendorf JD, Genkinger JM, Remotti HE, Su GH. Loss of PTEN expression is associated with poor prognosis in patients with intraductal papillary mucinous neoplasms of the pancreas. Clin Cancer Res. 2013; 19:6830–41. https://doi.org/10.1158/1078-0432.CCR-13-0624.
9. Moris M, Dawson DW, Jiang J, Lewis J, Nassar A, Takeuchi KK, Lay AR, Zhai Q, Donahue TR, Kelly KA, Crawford HC, Wallace M. Plectin-1 as a Biomarker of Malignant Progression in Intraductal Papillary Mucinous Neoplasms: A Multicenter Study. Pancreas. 2016; 45:1353–8. https://doi.org/10.1097/MPA.0000000000000652.
10. Jury RP, Thibodeau BJ, Fortier LE, Geddes TJ, Ahmed S, Pruetz BL, Farinola MA, Wilson GD. Gene expression changes associated with the progression of intraductal papillary mucinous neoplasms. Pancreas. 2012; 41:611–8. https://doi.org/10.1097/MPA.0b013e31823d7b36.
11. Lahat G, Lubezky N, Loewenstein S, Nizri E, Gan S, Pasmanik-Chor M, Hayman L, Barazowsky E, Ben-Haim M, Klausner JM. Epithelial-to-mesenchymal transition (EMT) in intraductal papillary mucinous neoplasm (IPMN) is associated with high tumor grade and adverse outcomes. Ann Surg Oncol. 2014; 21:S750–7. https://doi.org/10.1245/s10434-014-3946-5.
12. Polireddy K, Chen Q. Cancer of the Pancreas: Molecular Pathways and Current Advancement in Treatment. J Cancer. 2016; 7:1497–514. https://doi.org/10.7150/jca.14922.
13. Wellner U, Brabletz T, Keck T. ZEB1 in Pancreatic Cancer. Cancers (Basel). 2010; 2:1617–28. https://doi.org/10.3390/cancers2031617.
14. Kalluri R, Weinberg RA. The basics of epithelial-mesenchymal transition. J Clin Invest. 2009; 119:1420–8. https://doi.org/10.1172/JCI39104.
15. Zlobec I, Lugli A. Epithelial mesenchymal transition and tumor budding in aggressive colorectal cancer: tumor budding as oncotarget. Oncotarget. 2010; 1:651–661. https://doi.org/10.18632/oncotarget.199.
16. Montanari M, Rossetti S, Cavaliere C, D’Aniello C, Malzone MG, Vanacore D, Di Franco R, La Mantia E, Iovane G, Piscitelli R, Muscariello R, Berretta M, Perdona S, et al. Epithelial-mesenchymal transition in prostate cancer: an overview. Oncotarget. 2017; 8:35376–89. https://doi.org/10.18632/oncotarget.15686.
17. Deng J, Wang L, Chen H, Hao J, Ni J, Chang L, Duan W, Graham P, Li Y. Targeting epithelial-mesenchymal transition and cancer stem cells for chemoresistant ovarian cancer. Oncotarget. 2016; 7:55771–88. https://doi.org/10.18632/oncotarget.9908.
18. Chen Y, Lu L, Feng B, Han S, Cui S, Chu X, Chen L, Wang R. Non-coding RNAs as emerging regulators of epithelial to mesenchymal transition in non-small cell lung cancer. Oncotarget. 2017; 8:36787–99. https://doi.org/10.18632/oncotarget.16375.
19. Schmalhofer O, Brabletz S, Brabletz T. E-cadherin, beta-catenin, and ZEB1 in malignant progression of cancer. Cancer Metastasis Rev. 2009; 28:151–66. https://doi.org/10.1007/s10555-008-9179-y.
20. Burk U, Schubert J, Wellner U, Schmalhofer O, Vincan E, Spaderna S, Brabletz T. A reciprocal repression between ZEB1 and members of the miR-200 family promotes EMT and invasion in cancer cells. EMBO Rep. 2008; 9:582–9. https://doi.org/10.1038/embor.2008.74.
21. Wang F, Sloss C, Zhang X, Lee SW, Cusack JC. Membrane-bound heparin-binding epidermal growth factor like growth factor regulates E-cadherin expression in pancreatic carcinoma cells. Cancer Res. 2007; 67:8486–93. https://doi.org/10.1158/0008-5472.CAN-07-0498.
22. Park SM, Gaur AB, Lengyel E, Peter ME. The miR-200 family determines the epithelial phenotype of cancer cells by targeting the E-cadherin repressors ZEB1 and ZEB2. Genes Dev. 2008; 22:894–907. https://doi.org/10.1101/gad.1640608.
23. Ishikawa D, Shimada M, Utsunomiya T, Morine Y, Imura S, Ikemoto T, Arakawa Y, Kanamoto M, Iwahashi S, Saito Y, Yamada S, Miyake H. Effect of Twist and Bmi1 on intraductal papillary mucinous neoplasm of the pancreas. J Gastroenterol Hepatol. 2014; 29:2032–7. https://doi.org/10.1111/jgh.12652.
24. Buck E, Eyzaguirre A, Barr S, Thompson S, Sennello R, Young D, Iwata KK, Gibson NW, Cagnoni P, Haley JD. Loss of homotypic cell adhesion by epithelial-mesenchymal transition or mutation limits sensitivity to epidermal growth factor receptor inhibition. Mol Cancer Ther. 2007; 6:532–41. https://doi.org/10.1158/1535-7163.MCT-06-0462.
25. Arumugam T, Ramachandran V, Fournier KF, Wang H, Marquis L, Abbruzzese JL, Gallick GE, Logsdon CD, McConkey DJ, Choi W. Epithelial to mesenchymal transition contributes to drug resistance in pancreatic cancer. Cancer Res. 2009; 69:5820–8. https://doi.org/10.1158/0008-5472.CAN-08-2819.
26. Maier HJ, Schmidt-Strassburger U, Huber MA, Wiedemann EM, Beug H, Wirth T. NF-kappaB promotes epithelial-mesenchymal transition, migration and invasion of pancreatic carcinoma cells. Cancer Lett. 2010; 295:214–28. https://doi.org/10.1016/j.canlet.2010.03.003.
27. Hong SM, Li A, Olino K, Wolfgang CL, Herman JM, Schulick RD, Iacobuzio-Donahue C, Hruban RH, Goggins M. Loss of E-cadherin expression and outcome among patients with resectable pancreatic adenocarcinomas. Mod Pathol. 2011; 24:1237–47. https://doi.org/10.1038/modpathol.2011.74.
28. Kurahara H, Takao S, Maemura K, Mataki Y, Kuwahata T, Maeda K, Ding Q, Sakoda M, Iino S, Ishigami S, Ueno S, Shinchi H, Natsugoe S. Epithelial-mesenchymal transition and mesenchymal-epithelial transition via regulation of ZEB-1 and ZEB-2 expression in pancreatic cancer. J Surg Oncol. 2012; 105:655–61. https://doi.org/10.1002/jso.23020.
29. Bronsert P, Kohler I, Timme S, Kiefer S, Werner M, Schilling O, Vashist Y, Makowiec F, Brabletz T, Hopt UT, Bausch D, Kulemann B, Keck T, et al. Prognostic significance of Zinc finger E-box binding homeobox 1 (ZEB1) expression in cancer cells and cancer-associated fibroblasts in pancreatic head cancer. Surgery. 2014; 156:97–108. https://doi.org/10.1016/j.surg.2014.02.018.
30. Rhim AD, Mirek ET, Aiello NM, Maitra A, Bailey JM, McAllister F, Reichert M, Beatty GL, Rustgi AK, Vonderheide RH, Leach SD, Stanger BZ. EMT and dissemination precede pancreatic tumor formation. Cell. 2012; 148:349–61. https://doi.org/10.1016/j.cell.2011.11.025.
31. Javle MM, Gibbs JF, Iwata KK, Pak Y, Rutledge P, Yu J, Black JD, Tan D, Khoury T. Epithelial-mesenchymal transition (EMT) and activated extracellular signal-regulated kinase (p-Erk) in surgically resected pancreatic cancer. Ann Surg Oncol. 2007; 14:3527–33. https://doi.org/10.1245/s10434-007-9540-3.
32. Chaffer CL, Marjanovic ND, Lee T, Bell G, Kleer CG, Reinhardt F, D’Alessio AC, Young RA, Weinberg RA. Poised chromatin at the ZEB1 promoter enables breast cancer cell plasticity and enhances tumorigenicity. Cell. 2013; 154:61–74. https://doi.org/10.1016/j.cell.2013.06.005.
33. Singh M, Spoelstra NS, Jean A, Howe E, Torkko KC, Clark HR, Darling DS, Shroyer KR, Horwitz KB, Broaddus RR, Richer JK. ZEB1 expression in type I vs type II endometrial cancers: a marker of aggressive disease. Mod Pathol. 2008; 21:912–23. https://doi.org/10.1038/modpathol.2008.82.
34. Clarke MF, Dick JE, Dirks PB, Eaves CJ, Jamieson CH, Jones DL, Visvader J, Weissman IL, Wahl GM. Cancer stem cells--perspectives on current status and future directions: AACR Workshop on cancer stem cells. Cancer Res. 2006; 66:9339–44. https://doi.org/10.1158/0008-5472.CAN-06-3126.
35. Apte MV, Wilson JS, Lugea A, Pandol SJ. A starring role for stellate cells in the pancreatic cancer microenvironment. Gastroenterology. 2013; 144:1210–9. https://doi.org/10.1053/j.gastro.2012.11.037.
36. Kalluri R, Zeisberg M. Fibroblasts in cancer. Nat Rev Cancer. 2006; 6:392–401. https://doi.org/10.1038/nrc1877.
37. Cirri P, Chiarugi P. Cancer-associated-fibroblasts and tumour cells: a diabolic liaison driving cancer progression. Cancer Metastasis Rev. 2012; 31:195–208. https://doi.org/10.1007/s10555-011-9340-x.
38. Goruppi S, Dotto GP. Mesenchymal stroma: primary determinant and therapeutic target for epithelial cancer. Trends Cell Biol. 2013; 23:593–602. https://doi.org/10.1016/j.tcb.2013.08.006.
39. Soini Y, Tuhkanen H, Sironen R, Virtanen I, Kataja V, Auvinen P, Mannermaa A, Kosma VM. Transcription factors zeb1, twist and snai1 in breast carcinoma. BMC Cancer. 2011; 11:73. https://doi.org/10.1186/1471-2407-11-73.
40. Schulte J, Weidig M, Balzer P, Richter P, Franz M, Junker K, Gajda M, Friedrich K, Wunderlich H, Ostman A, Petersen I, Berndt A. Expression of the E-cadherin repressors Snail, Slug and Zeb1 in urothelial carcinoma of the urinary bladder: relation to stromal fibroblast activation and invasive behaviour of carcinoma cells. Histochem Cell Biol. 2012; 138:847–60. https://doi.org/10.1007/s00418-012-0998-0.
41. Galvan JA, Zlobec I, Wartenberg M, Lugli A, Gloor B, Perren A, Karamitopoulou E. Expression of E-cadherin repressors SNAIL, ZEB1 and ZEB2 by tumour and stromal cells influences tumour-budding phenotype and suggests heterogeneity of stromal cells in pancreatic cancer. Br J Cancer. 2015; 112:1944–50. https://doi.org/10.1038/bjc.2015.177.
42. Mohri D, Asaoka Y, Ijichi H, Miyabayashi K, Kudo Y, Seto M, Ohta M, Tada M, Tanaka Y, Ikenoue T, Tateishi K, Isayama H, Kanai F, et al. Different subtypes of intraductal papillary mucinous neoplasm in the pancreas have distinct pathways to pancreatic cancer progression. J Gastroenterol. 2012; 47:203–13. https://doi.org/10.1007/s00535-011-0482-y.
43. Ideno N, Ohtsuka T, Kono H, Fujiwara K, Oda Y, Aishima S, Ito T, Ishigami K, Tokunaga S, Ohuchida K, Takahata S, Nakamura M, Mizumoto K, et al. Intraductal papillary mucinous neoplasms of the pancreas with distinct pancreatic ductal adenocarcinomas are frequently of gastric subtype. Ann Surg. 2013; 258:141–51. https://doi.org/10.1097/SLA.0b013e31828cd008.
44. Tan MC, Basturk O, Brannon AR, Bhanot U, Scott SN, Bouvier N, LaFemina J, Jarnagin WR, Berger MF, Klimstra D, Allen PJ. GNAS and KRAS Mutations Define Separate Progression Pathways in Intraductal Papillary Mucinous Neoplasm-Associated Carcinoma. J Am Coll Surg. 2015; 220:845–54. https://doi.org/10.1016/j.jamcollsurg.2014.11.029.
45. Kitazono I, Higashi M, Kitamoto S, Yokoyama S, Horinouchi M, Osako M, Shimizu T, Tabata M, Batra SK, Goto M, Yonezawa S. Expression of MUC4 mucin is observed mainly in the intestinal type of intraductal papillary mucinous neoplasm of the pancreas. Pancreas. 2013; 42:1120–8. https://doi.org/10.1097/MPA.0b013e3182965915.
46. Tsutsumi K, Sato N, Cui L, Mizumoto K, Sadakari Y, Fujita H, Ohuchida K, Ohtsuka T, Takahata S, Tanaka M. Expression of claudin-4 (CLDN4) mRNA in intraductal papillary mucinous neoplasms of the pancreas. Mod Pathol. 2011; 24:533–41. https://doi.org/10.1038/modpathol.2010.218.
47. Koh YX, Zheng HL, Chok AY, Tan CS, Wyone W, Lim TK, Tan DM, Goh BK. Systematic review and meta-analysis of the spectrum and outcomes of different histologic subtypes of noninvasive and invasive intraductal papillary mucinous neoplasms. Surgery. 2015; 157:496–509. https://doi.org/10.1016/j.surg.2014.08.098.
48. Kang MJ, Lee KB, Jang JY, Han IW, Kim SW. Evaluation of clinical meaning of histological subtypes of intraductal papillary mucinous neoplasm of the pancreas. Pancreas. 2013; 42:959–66. https://doi.org/10.1097/MPA.0b013e31827cddbc.
49. Gagnon-Bartsch JA, Speed TP. Using control genes to correct for unwanted variation in microarray data. Biostatistics. 2012; 13:539–52. https://doi.org/10.1093/biostatistics/kxr034. Epub 2011 Nov 17.
50. Risso D, Ngai J, Speed TP, Dudoit S. Normalization of RNA-seq data using factor analysis of control genes or samples. Nat Biotechnol. 2014; 32:896–902. https://doi.org/10.1038/nbt.2931.
51. Gagnon-Bartsch JA, Laurent J, Terence P. Speed. Removing unwanted variation from high dimensional data with negative controls. Berkeley: Tech Reports from Dep Stat Univ California. 2013; 1–112.
52. Muthusamy VR, Chandrasekhara V, Acosta RD, Bruining DH, Chathadi KV, Eloubeidi MA, Faulx AL, Fonkalsrud L, Gurudu SR, Khashab MA, Kothari S, Lightdale JR, Pasha SF, et al; ASGE Standards of Practice Committee. The role of endoscopy in the diagnosis and treatment of cystic pancreatic neoplasms. Gastrointest Endosc. 2016; 84:1–9. https://doi.org/10.1016/j.gie.2016.04.014.
53. Suzuki R, Thosani N, Annangi S, Komarraju A, Irisawa A, Ohira H, Obara K, Fleming JB, Guha S, Bhutani MS. Diagnostic yield of endoscopic retrograde cholangiopancreatography-based cytology for distinguishing malignant and benign intraductal papillary mucinous neoplasm: systematic review and meta-analysis. Dig Endosc. 2014; 26:586–93. https://doi.org/10.1111/den.12230.
54. Al-Haddad MA, Kowalski T, Siddiqui A, Mertz HR, Mallat D, Haddad N, Malhotra N, Sadowski B, Lybik MJ, Patel SN, Okoh E, Rosenkranz L, Karasik M, et al. Integrated molecular pathology accurately determines the malignant potential of pancreatic cysts. Endoscopy. 2015; 47:136–42. https://doi.org/10.1055/s-0034-1390742.
55. Furukawa T, Kloppel G, Volkan Adsay N, Albores-Saavedra J, Fukushima N, Horii A, Hruban RH, Kato Y, Klimstra DS, Longnecker DS, Luttges J, Offerhaus GJ, Shimizu M, et al. Classification of types of intraductal papillary-mucinous neoplasm of the pancreas: a consensus study. Virchows Arch. 2005; 447:794–9. https://doi.org/10.1007/s00428-005-0039-7.
56. Adsay NV, Fukushima N, Furukawa T, Hruban RH, Klimstra DS, Klöppel G. Intraductal neoplasms of the pancreas. WHO classification of tumours of the digestive system. Lyon: IARC. 2010; 304–13.
57. Edge SB, and Carolyn C. Compton. The American Joint Committee on Cancer: the 7th edition of the AJCC cancer staging manual and the future of TNM. Annals of surgical oncology. 2010; 17:1471–4.
58. Rubie C, Kempf K, Hans J, Su T, Tilton B, Georg T, Brittner B, Ludwig B, Schilling M. Housekeeping gene variability in normal and cancerous colorectal, pancreatic, esophageal, gastric and hepatic tissues. Mol Cell Probes. 2005; 19:101–9. https://doi.org/10.1016/j.mcp.2004.10.001.