
INTRODUCTION
Lung cancer is the second leading cause of cancer and the leading cause of cancer deaths in both men and women in the United States [1, 2]. Although the mortality rate for lung cancer has declined over the last several decades, the overall 5-year survival rate has not substantially improved over the last 30 years [1, 2]. The majority of lung cancers are diagnosed at a distant stage (57%) [1]. Only 16% of lung cancers are diagnosed at a localized stage, for which the 5-year survival rate is 55% [1, 2]. The five year survival rate decreases for regional and distant cancers (28% and 4%, respectively) [1, 2]. For all stages combined, the five year survival rate is only 18% [1, 2]. Thus, there is a need for new ways to diagnose and treat this disease to improve clinical outcomes.
Early detection of lung cancer improves the patient’s chance of survival. Computed tomography (CT) is the most commonly used modality for lung cancer early detection, staging, treatment evaluation and follow-up [3–5]. Based on the results of the National Lung Screening Trial (NLST), screening by low-dose helical CT has been recommended for the early detection of lung cancer; however this only applies to high risk current and former smokers [2, 3, 6]. Currently, low-dose CT (LDCT) is the only approved method for lung cancer screening [7]. LDCT is useful for detecting small peripheral masses but other techniques are needed for tumors that arise in the central airways [8]. There is also a need for improved methods to discriminate malignant from benign lesions [3, 5]. Positron emission tomography (PET) with 18F-fluorodeoxyglucose (18F-FDG) can be used for metabolic imaging of lung cancer [3, 5, 9, 10]. It is useful for the detection of metastases and discrimination of malignant from benign lesions [5, 9, 10]. However, other abnormalities including inflammation and infection, can also be observed using 18F-FDG PET resulting in false positives [3–5, 9, 10]. Other PET tracers based on alternate pathways, such as proliferation and amino acid uptake, are currently being studied for use in lung cancer [3]. Magnetic resonance imaging (MRI) is used only for limited applications but investigations are being conducted to potentially expand the utility of MRI in the management of lung cancer [3–6]. Autofluorescence is used during bronchoscopy to identify precancerous and cancerous lesions and post-operatively to detect recurrence [3, 11, 12]. However, the current approaches lack specificity due to false positives resulting from other abnormalities such as inflammation [3, 11, 12].
While it is unlikely that molecular imaging agents are practical for use in lung cancer screening, development of novel lung cancer targeted molecular imaging agents has potential to address a number of clinical needs in the diagnosis and management of lung cancer and to augment the personalized care of patients. Since 18F-FDG PET imaging is not reliable in the context of inflammation, a lung-cancer specific PET imaging tracer is needed for use in this context, e.g., following surgery or radiation therapy [13]. A lung cancer specific PET tracer could also potentially be used to better distinguish malignant from benign nodules of the lung, which is an unmet clinical need that could improve early detection of lung cancer [14]. Additionally, imaging biomarkers that can non-invasively provide predictive or prognostic information are needed to improve the clinical management of lung cancer [15]. Development of fluorescently labeled lung cancer specific agents could improve early detection via fluorescence bronchoscopy. Such lung cancer targeted fluorescent agents could also be used intraoperatively for margin detection and identification of mediastinal lymph nodes that contain metastases [16].
In recent years, kinase targeted therapies have been developed that have shown improved efficacy in treatment of lung cancer compared to standard chemotherapy, e.g., epidermal growth factor receptor (EGFR) tyrosine kinase inhibitors [17] and anaplastic lymphoma kinase (ALK) inhibitors [18]. Immune checkpoint inhibitors, e.g. anti-PD1 and anti-CTLA-4, are another class of targeted therapies that have shown efficacy in treatment of lung cancer [19]. However, these new targeted treatments are only applicable to a fraction of patients, and development of resistance and recurrence has been a considerable problem in patients that do respond [20, 21]. Studies involving combination therapies have demonstrated increased efficacy and it has been proposed that combinations of therapies that target distinct pathways or mechanisms could increase the period of disease-free survival, or even be curative [22, 23]. However, current targeted therapies are associated with systemic toxicities, lowering the potential for effective combinations. Hence, novel targeted therapies that have low systemic toxicity are needed for use in combination with the existing toolbox of therapies. In addition, companion imaging agents are needed to identify patients that are likely to respond to the corresponding targeted therapy and to non-invasively follow treatment response.
To successfully implement the personalized treatment of lung cancer, molecular imaging agents and targeted therapeutics are needed that can detect the tumor with high specificity and selectivity. Since targeting moieties conjugated to imaging contrast or therapeutic agents cannot cross the plasma membrane, development of agents that target cell-surface markers that are differentially expressed on lung tumors relative to normal tissues or benign lesions is a rational approach toward achieving this objective. Thus, the identification and comparison of cell-surface markers is a crucial first step in the development of novel cancer-specific molecular imaging agents and targeted therapeutics. We have previously identified and validated novel bona fide cancer cell-surface markers by mRNA expression profiling and immunohistochemistry (IHC) of colon, melanoma, pancreatic and breast cancer patient tissue samples [24–30]. We have also developed imaging agents that target these identified tumor cell-surface markers [24, 25, 29, 31–34].
The goal of the current work was to identify a set of cell-surface markers that cover a broad range of lung cancers and analyze the expression of these markers in relation to survival of lung cancer patients. Once determined, such markers may be useful targets for the development of lung cancer targeted imaging and therapeutic agents.
RESULTS
Cell-surface marker identification
Our goal was to identify cell-surface markers that can be used for targeted agent development. However, different classes of targeted agent require different metrics for selection. For example, molecular imaging agents typically deliver tracer levels of radioactivity or non-toxic payloads for image contrast. In this case, the most important metric is target expression in tumor relative to surrounding normal lung tissue. Alternately, targeted therapeutic agents can deliver cytotoxic payloads or inhibit pathways that are important for normal cellular functions. Hence, marker discovery for targeted therapy requires evaluation of expression in tumor versus expression in a range of tissues that are of concern for systemic toxicity.
Gene expression profiling was performed using mRNA expression microarray data from patient samples of lung cancer and normal tissues. Available data sets were evaluated for quality, compiled, normalized and a MarkerScore determined for ranking differential expression in tumor relative to normal (see Methods). The probesets were intersected with a list of potential surface accessible gene products to annotate the target location and filter the data set, yielding a set of 11,838 potential surface accessible probesets for further analysis. Gene expression data for these probesets were sorted by MarkerScore using Excel 2010, and the list was analyzed for probesets exhibiting differentially high expression in lung tumors relative to normal lung tissue samples as determined using a combination of statistical tests described in the Methods. This resulted in a list of 360 probesets (282 genes) (Supplementary Table 1). Note that the number of probesets does not correspond to the number of genes, since several genes are detected by multiple probesets in the arrays. Our cell-surface list includes some genes that are membrane associated but do not have cell-surface domains, e.g. code for proteins that are secreted, are associated with the cytoplasmic side of the plasma membrane or with internal membranes only. We reviewed the literature for the list of 282 genes and 268 probesets (208 genes) were identified that likely have cell-surface domains (annotated as 1 in the Cell Membrane column in Supplementary Table 1). These 208 genes were evaluated for potential use as lung cancer specific cell-surface markers based on intensity and breadth of expression among the lung cancer samples relative to their differentially low expression in non-neoplastic lung tissue samples.
In addition to higher expression in tumor samples relative to normal lung samples, expression in other tissues associated with toxicity and clearance, e.g. liver, kidney, heart, etc., was also considered and markers that were expressed in these tissues were de-emphasized. From the ranked list, 10 markers were selected for further evaluation: CA9, CA12, CXorf61, DSG3, FAT2, GPR87, KISS1R, LYPD3, SLC7A11 and TMPRSS4. Five of these markers, CXorf61, DSG3, FAT2, GPR87, and LYPD3, were selected based primarily on their high and broad expression among the lung cancer samples relative to normal lung. Additional markers were selected based on their profile and that there are currently available molecular imaging probes targeting these markers (CA9, CA12, KISS1R and SLC7A11) [25, 35–70]. KISS1R and TMPRSS4 have known high affinity ligands and inhibitors, respectively, for potential use in targeting [71–80]. Despite its relatively low ranking based on marker score, CA9 was selected for further investigation due to an availability of high affinity inhibitors for imaging [49–51] and its general applicability among several cancer types, in addition to lung cancer, including cancers of the brain, breast, cervix, colon, head and neck, kidney, ovaries, and pancreas [25, 35, 81–83].
Figure 1 shows representative mRNA expression profiles of four of the selected markers in patient samples; the mRNA expression profiles for the remaining six selected markers are shown in Supplementary Figure 1. For each of these markers, the mRNA expression is significantly higher in the lung tumor samples in comparison to the normal lung samples (p < 0.0001) (Table 1 and Supplementary Tables 2–11). However, none of these markers are expressed at a high level in 100% of the lung tumor samples. Nevertheless, for each marker, there are a percentage of cancer cases with very high expression relative to normal lung. Therefore, a combination of markers may be required to cover all types of lung cancer.
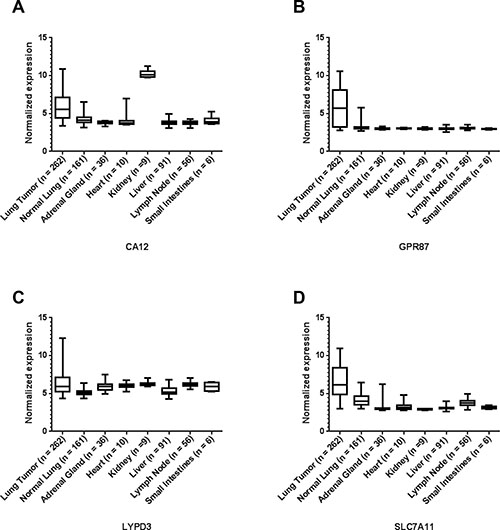
Figure 1: Representative microarray mRNA expression profiles for four of the selected lung cancer cell-surface markers in patient specimens of normal lung, lung tumors and other normal tissues: CA12 (A), GPR87 (B), LYPD3 (C), and SLC7A11 (D). Values are presented as whisker/box plots with whiskers representing the full range of values, the bottom and top of the boxes represent the 25th and 75th percentile, and middle lines represent the median.
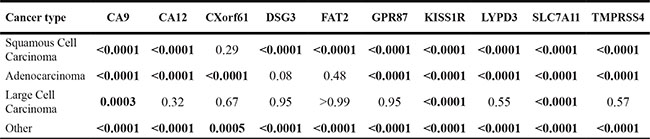
Table 1: Adjusted p values by Dunnett’s multiple comparisons for lung tumor (control) versus normal tissues.
Tissue type |
CA9 |
CA12 |
CXorf61 |
DSG3 |
FAT2 |
GPR87 |
KISS1R |
LYPD3 |
SLC7A11 |
TMPRSS4 |
|---|---|---|---|---|---|---|---|---|---|---|
Normal Lung |
<0.0001 |
<0.0001 |
<0.0001 |
<0.0001 |
<0.0001 |
<0.0001 |
<0.0001 |
<0.0001 |
<0.0001 |
<0.0001 |
Adrenal Gland |
<0.0001 |
<0.0001 |
<0.0001 |
<0.0001 |
0.017 |
<0.0001 |
<0.0001 |
0.15 |
<0.0001 |
<0.0001 |
Heart |
0.88 |
<0.0001 |
0.0118 |
0.0161 |
0.0239 |
<0.0001 |
<0.0001 |
0.92 |
<0.0001 |
<0.0001 |
Kidney |
0.53 |
<0.0001 |
0.0094 |
0.0136 |
0.13 |
<0.0001 |
<0.0001 |
>0.99 |
<0.0001 |
<0.0001 |
Liver |
0.008 |
<0.0001 |
<0.0001 |
<0.0001 |
<0.0001 |
<0.0001 |
<0.0001 |
<0.0001 |
<0.0001 |
<0.0001 |
Lymph Node |
<0.0001 |
<0.0001 |
<0.0001 |
<0.0001 |
<0.0001 |
<0.0001 |
<0.0001 |
0.96 |
<0.0001 |
<0.0001 |
Small Intestines |
0.0039 |
0.0007 |
0.13 |
0.13 |
0.18 |
0.0001 |
<0.0001 |
0.85 |
<0.0001 |
0.14 |
The mRNA expression of these markers in organs involved in toxicity and clearance was also evaluated. The expression of the markers GPR87, KISS1R and SLC7A11 are significantly higher in the lung tumors than all of the other normal organs examined (Table 1, Supplementary Tables 7, 8 and 10, and Figures 1B and 1D and Supplementary Figure 1E). The expression of the other markers are either significantly higher or show no statistical difference for the tumor in comparison to the other organs in all cases except two (Figure 1 and Supplementary Figure 1, and Table 1 and Supplementary Tables 2–11). In the case of CA12, the expression is significantly higher in the kidney than in the lung tumors (p < 0.0001) (Figure 1A and Supplementary Table 3). For CA9, the expression is significantly higher in the small intestines than in the lung tumors (p = 0.0039) (Supplementary Figure 1A and Supplementary Table 2).
In addition to the analysis of marker expression for all types of lung cancer, we also analyzed the expression of each of the markers for the three main histological classes of non-small cell lung cancer (NSCLC) (with a sample number n ≥ 3): adenocarcinoma, large cell carcinoma and squamous cell carcinoma (SCC). All remaining mRNA data were combined as “other”. See Figure 2 and Supplementary Figure 2. Statistical differences of the different histological classes relative to normal lung were reported as p-values in Table 2 and Supplementary Tables 12–21. Statistical differences among the different histological classes are reported in Supplementary Tables 22–31. Interestingly, some markers are significantly higher in all NSCLC sub-classes relative to normal lung, while other markers have differential expression among the sub-classes.
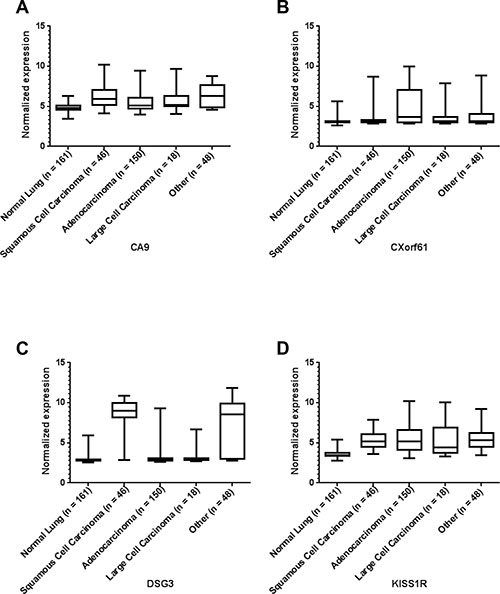
Figure 2: Representative microarray mRNA expression profiles for four of the selected markers in patient specimens of normal lung and lung tumors of various lung cancer histologies: CA9 (A), CXorf61 (B), DSG3 (C), and KISS1R (D). Values are presented as whisker/box plots with whiskers representing the full range of values, the bottom and top of the boxes represent the 25th and 75th percentile, and the middle lines represent the median.
Table 2: Adjusted p values by Dunnett’s multiple comparisons for normal lung (control) versus lung cancer histologies
Confirmation of marker protein expression
Since mRNA expression does not always translate to protein, we needed to confirm protein expression of the selected markers. To do this, we performed immunohistochemistry (IHC) of a tissue microarray (TMA) consisting of lung tumor samples and adjacent normal lung samples, as well as several other control tissues (liver, spleen, and lymph node). Figures 3 and 4 show representative images of IHC-stained sections from lung tumors and non-neoplastic “normal” lung specimens from the TMA. As can be seen from the images, the lung tumor specimens have greater cell density compared to the normal lung specimens. Supplementary Figures 3 and 4 show higher magnification images of the lung tumor samples from the TMA.
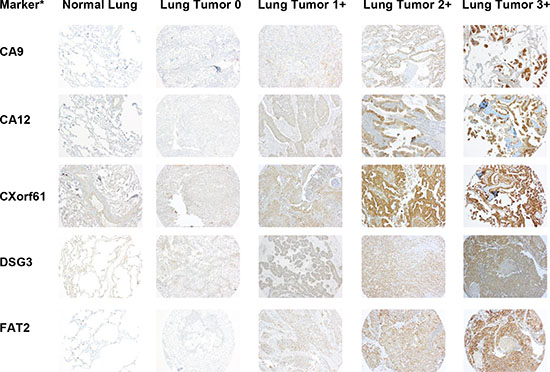
Figure 3: Representative images of IHC stained patient lung tumor and normal lung tissue specimens from the tissue microarray (TMA) for half of the selected markers. A representative normal lung sample and representative lung tumor samples with scores of 0, 1+, 2+, and 3+ are shown for each marker. The images are taken at 10x magnification. *Protein expression is stained but gene names are used to conserve space.
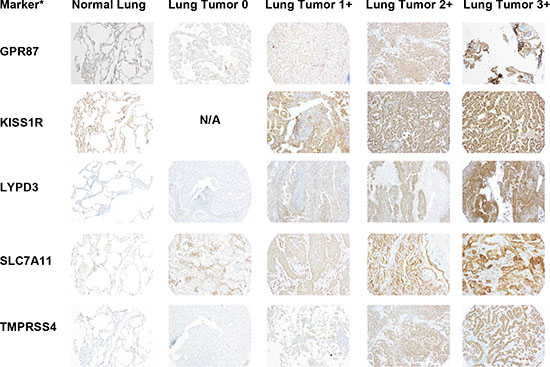
Figure 4: Representative images of IHC stained patient lung tumor and normal lung tissue specimens from the tissue microarray (TMA) for the remaining selected markers. A representative normal lung sample and representative lung tumor samples with scores of 0, 1+, 2+, and 3+ are shown for each marker. The images are taken at 10x magnification. *Protein expression is stained but gene names are used to conserve space.
The IHC staining was scored by a pathologist who specializes in thoracic oncology (F.K.K.) on a scale from 0 to 3+, with 3+ representing the strongest intensity. A summary of the scoring data for each marker in normal lung and lung tumor tissue is given in Tables 3 and 4. The IHC analysis of the other control tissues for each marker is given in Supplementary Table 32. Samples showing any percentage of cell staining were included in this analysis. For each of the markers, there were a percentage of tumor samples that had higher expression than the normal lung samples. The ten markers were divided into two groups based on expression in normal lung tissue (Tables 3 and 4). The first group consisted of six markers with limited (TMPRSS4) or no expression (CA12, FAT2, GPR87, LYPD3, and SLC7A11) in the normal lung samples (Table 3). For TMPRSS4, staining in normal lung was observed in only one of the eight specimens, and only 5% of the cells in that specimen had staining (Table 3). The remaining four markers (CA9, CXorf61, DSG3, and KISS1R) showed some expression in normal lung (Table 4). The only marker with high staining intensity (3+) in some (25%) of the normal lung specimens was CA9. For CXorf61, DSG3 and KISS1R, the expression was of low staining intensity (1+) for ≥50% of the normal lung specimens. The average percentage of cell staining is reported as a heterogeneity score (Tables 3 and 4 and Supplementary Table 32). When samples received a pathology score of 0, they also received a 100% heterogeneity score indicating that they were uniformly unstained. For samples that stained (pathology score of 1 or greater), the heterogeneity score indicates the percentage of cell staining regardless of intensity. Values close to 100% indicate more homogeneous staining. Some markers showed homogeneous staining, i.e. DSG3, KISS1R, and SLC7A11, whereas other markers were very heterogeneous, i.e. CA9 and LYPD3. For five of the markers, staining was observed in the lymphocytes in all tissues. The staining intensities of the lymphocytes were 3+ for GPR87, 2+ to 3+ for CXorf61, DSG3 and KISS1R, and 1+ to 2+ for FAT2. The TMA used in this study consists of a proportional representation of the histological subtypes of NSCLC as seen in the clinic. The markers were also analyzed for expression in the two predominant histological subtypes of NSCLC, adenocarcinoma and SCC (Tables 5 and 6). The remaining samples were of other histological classes (acinar cell carcinoma, adenosquamous carcinoma, large cell carcinoma, large cell neuroendocrine carcinoma, neuroendocrine carcinoma, mesothelioma or pleomorphic carcinoma), with a sample number ≤ 5 or were not otherwise specified, and these data were combined into a category termed as “other” due to the lower sample numbers.
Table 3: IHC scoring of marker expression in normal lung and lung cancer patient tissue samples: markers with limited or no expression in normal lung
Target* |
Tissue type |
Patient Tissue Samples (n) |
Pathology Score |
Heterogeneity Score# (Average ± SD) |
||||
|---|---|---|---|---|---|---|---|---|
0 |
1+ |
2+ |
3+ |
%≥1+ |
||||
CA12 |
Normal Lung |
8 |
8 |
0 |
0 |
0 |
0% |
100% ± 0% |
Lung Tumor |
97 |
16 |
26 |
44 |
11 |
83% |
84% ± 26% |
|
FAT2 |
Normal Lung |
8 |
8 |
0 |
0 |
0 |
0% |
100% ± 0% |
Lung Tumor |
98 |
5 |
35 |
39 |
19 |
95% |
92% ± 17% |
|
GPR87 |
Normal Lung |
8 |
8 |
0 |
0 |
0 |
0% |
100% ± 0% |
Lung Tumor |
100 |
14 |
52 |
26 |
8 |
86% |
90% ± 22% |
|
LYPD3 |
Normal Lung |
8 |
8 |
0 |
0 |
0 |
0% |
100% ± 0% |
Lung Tumor |
97 |
34 |
46 |
12 |
5 |
65% |
61% ± 36% |
|
SLC7A11 |
Normal Lung |
8 |
8 |
0 |
0 |
0 |
0% |
100% ± 0% |
Lung Tumor |
99 |
14 |
59 |
23 |
3 |
86% |
99% ± 5% |
|
TMPRSS4 |
Normal Lung |
8 |
7 |
0 |
1 |
0 |
12.5% |
5% |
Lung Tumor |
100 |
12 |
39 |
37 |
12 |
88% |
83% ± 29% |
|
*Protein expression is scored but gene names are used to conserve space.
#Heterogeneity score indicates the average percentage of cell staining in samples that stained regardless of pathology score. For samples with pathology scores of 0 only, 100% heterogeneity score indicates uniformly unstained.
Table 4: IHC scoring of marker expression in normal lung and lung cancer patient tissue samples: markers with some expression in normal lung
Target* |
Tissue type |
Patient Tissue Samples (n) |
Pathology Score |
Heterogeneity Score# (Average ± SD) |
||||
|---|---|---|---|---|---|---|---|---|
0 |
1+ |
2+ |
3+ |
%≥2+ |
||||
CA9 |
Normal Lung |
8 |
4 |
2 |
0 |
2 |
25% |
88% ± 13% |
Lung Tumor |
92 |
13 |
24 |
26 |
29 |
60% |
79% ± 32% |
|
CXorf61 |
Normal Lung |
8 |
4 |
4 |
0 |
0 |
0% |
100% ± 0% |
Lung Tumor |
97 |
12 |
35 |
45 |
5 |
52% |
95% ± 17% |
|
DSG3 |
Normal Lung |
8 |
1 |
7 |
0 |
0 |
0% |
100% ± 0% |
Lung Tumor |
95 |
6 |
45 |
38 |
6 |
46% |
99% ± 5% |
|
KISS1R |
Normal Lung |
8 |
2 |
6 |
0 |
0 |
0% |
100% ± 0% |
Lung Tumor |
96 |
0 |
24 |
63 |
9 |
75% |
100% ± 0% |
|
*Protein expression is scored but gene names are used to conserve space.
#Heterogeneity score indicates the average percentage of cell staining in samples that stained regardless of pathology score. For samples with pathology scores of 0 only, 100% heterogeneity score indicates uniformly unstained.
Table 5: IHC scoring of marker expression in lung cancer patient tissue samples analyzed by lung cancer histology sub-type: markers with limited or no expression in normal lung
Target* |
Tissue type |
Patient Tissue Samples (n) |
Pathology Score |
||||
|---|---|---|---|---|---|---|---|
0 |
1+ |
2+ |
3+ |
%≥1+ |
|||
CA12 |
Adenocarcinoma |
61 |
6 |
16 |
32 |
7 |
90% |
SCC |
10 |
3 |
2 |
5 |
0 |
70% |
|
Other |
26 |
7 |
8 |
7 |
4 |
73% |
|
FAT2 |
Adenocarcinoma |
60 |
2 |
17 |
27 |
14 |
97% |
SCC |
10 |
1 |
7 |
1 |
1 |
90% |
|
Other |
28 |
2 |
11 |
11 |
4 |
93% |
|
GPR87 |
Adenocarcinoma |
62 |
5 |
34 |
17 |
6 |
92% |
SCC |
11 |
1 |
5 |
4 |
1 |
91% |
|
Other |
27 |
8 |
13 |
5 |
1 |
70% |
|
LYPD3 |
Adenocarcinoma |
61 |
19 |
29 |
10 |
3 |
69% |
SCC |
10 |
2 |
7 |
0 |
1 |
80% |
|
Other |
26 |
13 |
10 |
2 |
1 |
50% |
|
SLC7A11 |
Adenocarcinoma |
61 |
8 |
36 |
15 |
2 |
87% |
SCC |
10 |
1 |
6 |
2 |
1 |
90% |
|
Other |
28 |
5 |
17 |
6 |
0 |
82% |
|
TMPRSS4 |
Adenocarcinoma |
62 |
5 |
25 |
25 |
7 |
92% |
SCC |
11 |
1 |
4 |
4 |
2 |
91% |
|
Other |
28 |
6 |
11 |
8 |
3 |
79% |
|
*Protein expression is scored but gene names are used to conserve space.
Table 6: IHC scoring of marker expression in lung cancer patient tissue samples analyzed by lung cancer histology sub-type: markers with some expression in normal lung
Target* |
Tissue type |
Patient tissue samples (n) |
Pathology score |
||||
|---|---|---|---|---|---|---|---|
0 |
1+ |
2+ |
3+ |
%≥2+ |
|||
CA9 |
Adenocarcinoma |
56 |
8 |
17 |
18 |
13 |
55% |
SCC |
10 |
1 |
3 |
2 |
4 |
60% |
|
Other |
26 |
4 |
4 |
6 |
12 |
69% |
|
CXorf61 |
Adenocarcinoma |
60 |
6 |
22 |
28 |
4 |
53% |
SCC |
10 |
2 |
5 |
3 |
0 |
30% |
|
Other |
27 |
4 |
8 |
14 |
1 |
56% |
|
DSG3 |
Adenocarcinoma |
60 |
4 |
25 |
27 |
4 |
52% |
SCC |
10 |
1 |
5 |
3 |
1 |
40% |
|
Other |
25 |
1 |
15 |
8 |
1 |
36% |
|
KISS1R |
Adenocarcinoma |
60 |
0 |
14 |
40 |
6 |
77% |
SCC |
10 |
0 |
5 |
4 |
1 |
50% |
|
Other |
26 |
0 |
5 |
19 |
2 |
81% |
|
*Protein expression is scored but gene names are used to conserve space.
Marker expression in cell lines
As further confirmation, marker expression was evaluated in established human lung cancer cell lines. We have previously demonstrated that mRNA levels obtained from Affymetrix microarray data derived from cell lines are representative of levels obtained by quantitative real-time reverse-transcriptase polymerase chain reaction (qRT-PCR) of the same cell lines [30]. Hence, for each of the markers, we analyzed mRNA expression microarray data for cell lines (Supplementary Figures 5–14). For each marker, NSCLC cell lines with high and low/no mRNA expression were selected (Figure 5). These cell lines could be useful when developing models to test imaging or therapeutic agents targeting the markers.
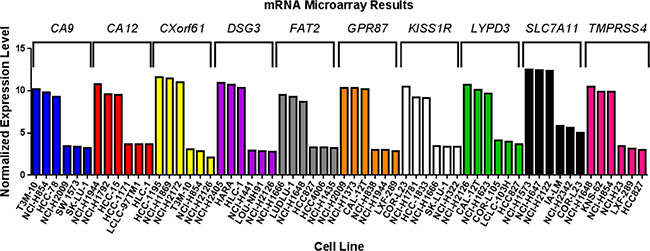
Figure 5: Marker expression in human lung cancer cell lines. mRNA microarray data was analyzed for non-small cell lung cancer cell lines with high and low/no endogenous expression of each of the markers. The graph shows three cell lines with high and three cell lines with low/no expression for each marker.
Survival analyses
As a further validation of each marker related to tumor biology and patient prognosis, both mRNA and protein expression data for the selected markers were evaluated in terms of patient survival. The mRNA expression was dichotomized at the median cut-point and the five-year survival was compared for the groups with high and low expression of the marker, and analyses were also conducted by tertile cutpoints (Table 7). High expression for five of the markers (CA9, CA12, CXorf61, LYPD3, and SLC7A11) significantly associated with worse survival (p < 0.05) when the data was dichotomized (Figure 6). For genes with multiple probesets (CA9 and CA12), the association was significant for all of the probesets (Table 7). When we analyzed the data using tertiles of expression, all of these markers were significantly associated with survival, except for CXorf61 (Table 7 and Figure 7). In addition, when analyzed by tertiles, GPR87 expression was significantly associated with survival (Table 7 and Figure 7C). The tertile analysis revealed that the third of specimens with highest LYPD3 expression was associated with worse survival relative to the two thirds of specimens with low expression values (Figure 7D), and for SLC7A11, two thirds of specimens with higher expression were associated with worse survival relative to the third with the lowest expression levels (Figure 7E).
Table 7: Significance of marker expression relative to survival by Affymetrix probe
Probe Name |
Gene |
Log Rank P-value for 2 groups (median split) |
Log Rank P-value for 3 groups (tertile split) |
|---|---|---|---|
merck_NM_001216_at_CA9 |
CA9 |
0.03* |
0.01* |
merck2_DQ892208_at_CA9 |
CA9 |
0.04* |
0.02* |
merck_NM_001218_s_at_CA12 |
CA12 |
<0.01* |
0.02* |
merck_AK096845_a_at_CA12 |
CA12 |
<0.0001* |
<0.01* |
merck2_BC087838_at_CA12 |
CA12 |
<0.01* |
<0.01* |
merck_NM_001017978_s_at_CXorf61 |
CXorf61 |
<0.01* |
0.08 |
merck_BX538327_at_DSG3 |
DSG3 |
0.53 |
0.10 |
merck_NM_001944_a_at_DSG3 |
DSG3 |
0.33 |
0.65 |
merck2_M76482_at_DSG3 |
DSG3 |
0.48 |
0.88 |
merck_NM_001447_at_FAT2 |
FAT2 |
0.78 |
0.49 |
merck_NM_023915_s_at_GPR87 |
GPR87 |
0.15 |
0.04* |
merck_NM_032551_s_at_KISS1R |
KISS1R |
0.94 |
0.88 |
merck_NM_014400_at_LYPD3 |
LYPD3 |
0.03* |
<0.01* |
merck_NM_014331_at_SLC7A11 |
SLC7A11 |
<0.01* |
0.02* |
merck_AI924527_a_at_TMPRSS4 |
TMPRSS4 |
0.75 |
0.46 |
merck2_NM_001083947_at_TMPRSS4 |
TMPRSS4 |
0.41 |
0.74 |
merck2_NM_183247_a_at_TMPRSS4 |
TMPRSS4 |
0.93 |
0.57 |
*p-values < 0.05 are considered significant and are emboldened.
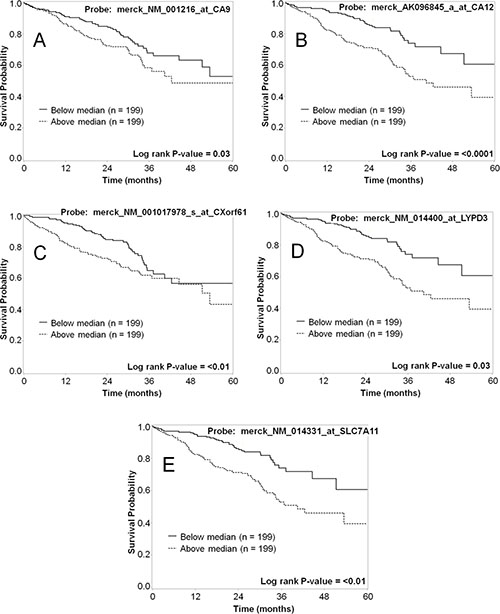
Figure 6: Representative Kaplan–Meier survival curves for lung cancer markers using mRNA expression data dichotomized based on the median-cut point. The five-year survival for patients with high mRNA expression (dashed line) vs. low mRNA expression (solid line) was plotted for each of the markers. Shown are data for CA9 (A), CA12 (B), CXorf61 (C), LYPD3 (D), and SLC7A11 (E). Each of these markers shows a statistically significant difference in survival for patients with high vs. low mRNA expression.
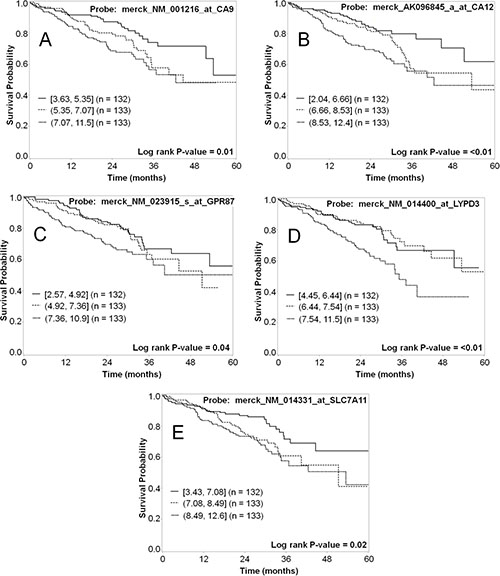
Figure 7: Representative Kaplan–Meier survival curves for lung cancer markers using mRNA expression data analyzed as tertiles. The five-year survival for the third of patients with the highest mRNA expression (short dashed line); the middle third (dashed line); and the third with lowest expression (solid line) was plotted for each of the markers. Shown are data for CA9 (A), CA12 (B), GPR87 (C), LYPD3 (D), and SLC7A11 (E). Each of these markers shows a statistically significant difference in survival for patients with high vs. low mRNA expression.
A metagene signature was generated using the first principal component analysis (PCA) of the 8 probes that were significantly (p < 0.05) associated with survival based on the median split (three probes in CA12, two in CA9, CXorf61, LYPD3, and SLC7A11). The first principal component was dichotomized by the median into low and high expression. High expression of the metagene was significantly associated with worse survival (P < 0.01) (Figure 8A). Using a hierarchical analytical classification and regression tree (CART) approach on the same variables we had used for the PCA analysis, we determined LYPD3 and CA12 to be the two most predictive markers and determined their respective cut points. Four subgroups were identified (low LYPD3/low CA12, low LYPD3/high CA12, high LYPD3/low CA12 and high LYPD3/high CA12) and high expression of both markers was correlated with decreased survival, whereas low expression of both markers correlated with increased survival (P < 0.0001) (Figure 8B).
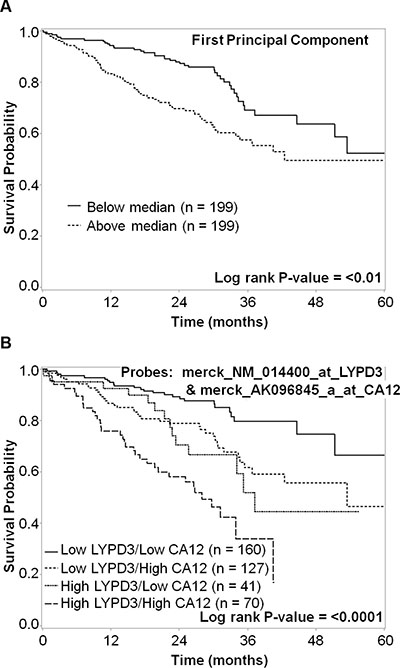
Figure 8: Kaplan–Meier survival curves for (A) metagene and (B) both LYPD3 and CA12 groupings. (A) For the metagene analysis, data were dichotomized based on the median cut-point. The five-year survival for patients with high metagene expression (dashed line) vs. low metagene expression (solid line) was plotted. There is a statistically significant difference in survival (P < 0.01). (B) For the LYPD3 and CA12 combined analysis, mRNA expression data were divided into four subgroups. The five-year survival for patients with low LYPD3/low CA12 (solid line), low LYPD3/high CA12 (dashed line), high LYPD3/low CA12 (short dashed line) and high LYPD3/high CA12 (long dashed line) was plotted. There is a statistically significant difference in survival (P < 0.0001).
To analyze protein expression, we used both normalized and non-normalized data (described in the Methods section). We dichotomized the expression of the markers into a group with staining intensity ≥2+ and <2+ and assessed the survival for groups with high vs. low expression of each of the markers. The only marker for which high expression was significantly correlated with poor survival by this analysis was LYPD3 (Figure 9A). In a second analysis, four groupings were used (<1+, ≥1+ and <2+, ≥2+ and <3+, and ≥3+) and in this analysis CA-IX expression ≥3+ had significantly increased survival compared to CA-IX expression <3+ (Figure 9B).
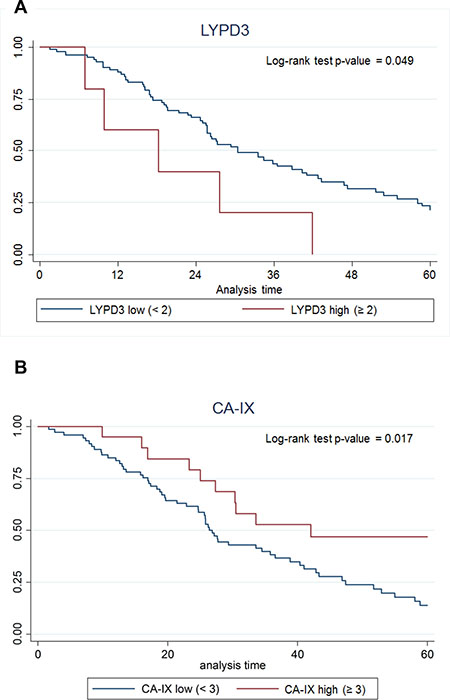
Figure 9: Kaplan–Meier survival curves for (A) LYPD3 and (B) CA-IX using IHC scoring data. The data were normalized by multiplying the staining intensity by the tumor cell staining percent. The five-year survival for patients with high protein expression (red line) vs. low protein expression (blue line) was plotted.
DISCUSSION
A major bottleneck in the development of targeted imaging and therapeutic agents for use in personalized medicine has been the availability of adequately vetted molecular targets. Individual targets are often reported in the literature for a given cancer type or clinical application, but it is rare that these target markers are compared with other potential targets simultaneously, using the same tissue specimens and analyses in order to estimate the potential utility of one marker relative to others. Potential targets are often reported based on mRNA expression alone, without confirmation of protein expression, which typically is the intended target. Additionally, elevated mRNA expression in cancer does not necessarily correspond to equivalent protein expression or subcellular localization. Tumor marker expression is often reported for only a small set of patient samples, only in tumor cell lines, or only reported for tumors without consideration of expression in surrounding normal tissues or normal tissues of concern for agent clearance or toxicity. Each of these concerns can lead to inadequately informed decisions about targets to pursue for development of targeted agents for a given application. To identify suitable targets for a given clinical application, studies are needed that can identify and compare marker expression among patient tumor sample sets that are representative of the intended target population and that include secondary levels of confirmation. Without adequate target discovery, costly decisions to undertake agent development may be made that are destined to fail.
Herein we report a systematic lung cancer cell-surface marker discovery effort. Our approach made use of the large amount of microarray data available for many clinical types of cancer. We specifically screened lung cancer array data for the high expression of genes in cancer samples that were poorly expressed in normal lung and several other key tissues. We then further narrowed the list to those genes we expected to be expressed at the cell surface. The goal of this work was to simultaneously identify and validate promising markers in lung cancer that can be used as targets for development of novel agents for use in personalized medicine. We focused on the identification of cell-surface markers because targeted agents that are designed for delivery of imaging contrast or cytotoxic payloads are typically conjugates with greater mass than small molecule drugs that can pass through the cell membrane via common transport mechanisms. By gene expression profiling of patient microarray data, we have identified greater than 200 putative cell-surface markers for lung cancer (Supplementary Table 1). From this list, we selected 10 promising markers (CA9, CA12, CXorf61, DSG3, FAT2, GPR87, KISS1R, LYPD3, SLC7A11, and TMPRSS4) for confirmation of protein expression in patient samples. By IHC, we determined differential protein expression of these markers in lung tumor specimens relative to normal lung and other normal tissues of concern for toxicity (Tables 3 and 4 and Supplementary Table 32). As secondary confirmations, we also demonstrated that lung cancer cell lines endogenously express these markers (Figure 5 and Supplementary Figures 5–14). These lung tumor cell lines can be useful for the development of agents targeted to these markers. We have also shown that survival correlates with expression for several of the described markers (Table 7 and Figures 6 and 7).
Many of the markers that were identified by this method had been previously reported for lung cancer or other cancer types (see below). This serves to validate our approach to discovery, but also highlights a key feature of our method; to identify and directly compare the relative utility of multiple markers simultaneously. Since the patient specimens used for identification and validation also have corresponding clinical data available, we were able to provide further evidence of the potential clinical relevance of each given marker, i.e. survival prognosis. Hence, we report a practical and systematic process that can be used to discover cell-surface markers that can be used for making decisions about targeted agent development for use in personalized medicine. This approach can also be applied to any class of cancer including rare cancer types that have not had the scrutiny of NSCLC.
Array data may miss many good targets as it is possible to have low mRNA expression with high corresponding protein levels. Other approaches such as proteomics and transcriptional sequencing may find other potential cancer markers. For example, proteomics approaches have been successfully applied toward the identification of membrane-associated proteins in lung tumor tissue relative to normal lung tissue [84, 85]. Nonetheless we have identified a suite of 10 potential cell-surface markers that identify the majority of lung tumor samples we analyzed.
Similar approaches have been used by other groups for lung cancer marker discovery. Nakamura et al. have several reports where a similar approach was used to identify lung cancer markers [86–90]. However, only one of these studies focused on cell-surface [86] and there are important differences, e.g. mRNA expression was determined by laser-capture microdissection of tumor cells, which decreases contamination from tumor infiltrating cells but also decreases the sample number that can be practically examined. RNA profiles are typically distorted by the processes required for laser capture microdissection limiting its usefulness in quantitative analyses. Nonetheless, useful markers can be identified in this way. Their cell-surface study identified SEZ6L2 as a cell-surface marker for lung cancer, which was also identified by our approach as having higher mRNA expression relative to normal tissues. However, it was not one of the candidates selected for further validation in our study due to its lower ranking based on marker score. Our initial screen identified 272 additional candidates that were not investigated further for this work, but still might prove useful. For example, SEZ6L2 was higher ranked than CA9 in our analysis but CA9 was selected due to the availability of molecular imaging probes targeting this marker and based on its potential applicability among several cancer types. Another similar study by Gugger et al. was limited to cell-surface G-protein-coupled receptor (GPCR) discovery and identified 5 GPCRs as being overexpressed [91]. Differential mRNA expression identified GPR87 as a lung SCC target, but protein expression was not confirmed [91]. Our current study effectively confirms the differential mRNA expression of GPR87 and goes on to demonstrate that protein expression was also higher in a large set of lung cancer samples. Recently, Botling et al., used prognostic impact to select NSCLC biomarkers for IHC confirmation [92]. The study was not limited to cell-surface markers and the majority of markers discovered were intracellular, but the CADM1 cell-surface gene was identified and protein expression confirmed. Unfortunately, this (CADM1) protein has lower expression in tumor samples compared to normal lung samples [92]. We made this same observation in our mRNA expression microarray data set and, consequently, this protein was not selected for further study. In contrast to these studies, all of the markers selected for validation in our study had high protein expression in tumor cells compared to normal cells in a large fraction of the samples (Tables 3 and 4). These results suggest that using large sample numbers of whole tumor tissue digests is sufficient for the initial identification of markers that have high and broad expression among tumor cells and that laser-capture microdissection may be unnecessary for the detection of promising targets.
As stated above, a number of the markers in this study had previously been reported as expressed as mRNA or protein in lung cancer: CAIX [83, 93–107], CAXII [83, 108], KK-LC-1 [109–113], desmoglein 3 [114–116], GPR87 [91, 117–119], Ly6/PLAUR domain-containing protein 3 [118, 120–125] and solute carrier family 7 member 11 protein [63, 118]. However, we also confirmed protein expression in patient specimens for two novel lung cancer targets, i.e. FAT2 and KiSS-1R. Our results for KiSS-1R conflicted with previous reports that mRNA and protein levels of KISS1R were lower for NSCLC tissue relative to normal lung tissue [126, 127]. KISS1R levels were assessed by reverse-transcriptase polymerase chain reaction (RT-PCR) and Western Blot (WB). In addition, KISS1R expression was reported to be associated with better survival in patients with NSCLC [126]. In our study, we found higher mRNA and protein expression of KISS1R in lung tumors relative to normal lung tissue. Also, we did not observe an association between KISS1R mRNA expression in adenocarcinoma and improved survival. There are at least two mRNA splice variants resulting in different protein products. The different methodologies may be detecting different forms of the KISS1R product leading to these conflicting results. See Table 8 for a review of the literature regarding expression of all of the selected markers and comparison of results presented herein. Differences observed herein relative to published results are likely due to differences in the study populations and the way expression was evaluated.
Table 8: Literature review of the selected markers and comparison to results herein
Gene name |
Protein name |
Normal expression & function |
Cancer expression & function |
Comparison to results |
References |
|---|---|---|---|---|---|
CA9 |
Carbonic anhydrase IX (CAIX) |
GI tract. Catalyzes the reversible hydration of CO2 to H2CO3. |
↑ breast, lung, renal-cell cancers. ↑ SCC relative to other NSCLC. Correlates with poor survival, with a few exceptions. |
General agreement. |
|
CA12 |
Carbonic anhydrase XII (CAXII) |
Brain, colon, rectum, esophagus, kidney, ovary, pancreas, prostate, testis and uterus. Catalyzes the reversible hydration of CO2 to H2CO3. |
↑ breast, lung, renal-cell cancers. ↑ protein correlates with ↑ survival. |
↓ survival with ↑ mRNA. |
|
CXorf61 |
Kita-kyushu lung cancer antigen 1 (KK-LC-1) |
Testis. Cancer testis antigen family. |
↑ mRNA in NSCLC. No correlation with survival. |
mRNA results were not significant for SCC. ↑ mRNA correlates with ↓ survival. First report of ↑ protein in lung adenocarcinoma. |
|
DSG3 |
Desmoglein 3 |
Normal stratified squamous epithelia, GI tract. Cadherin superfamily. |
↑ SCCs, ↓ adenocarcinoma. ↑ increased survival. ↓ higher tumor grade. |
↑ SCCs, ↑ adenocarcinoma. No correlation with survival. |
|
FAT2 |
Protocadherin Fat 2 |
Cerebellum, epidermis. Cadherin superfamily. |
↑ esophageal, gastric, head and neck, ovarian, pancreatic cancers, cutaneous SCC and NSCLC. ↑ poor NSCLC survival. |
No correlation with survival. |
|
GPR87 |
G-protein coupled receptor 87 |
Prostate, placenta, head and neck. P2Y purin receptor family. |
↑ bladder cancer and SCC of lung, cervix, head and neck, skin. Not elevated in adenocarcinoma. ↑ mRNA ↓ survival. |
General agreement except ↑ in both SCC and adenocarcinoma. |
|
KISS1R |
Kiss-1R |
Placenta, pancreas, pituitary gland, brain. Role in normal and pathologic physiology, reproduction and pubertal development, hypothalamic-pituitary-gonadal axis. |
↑ bladder, hepatocellular, ovarian, pancreatic, renal cell, thyroid cancers. ↓ endometrial, esophageal, NSCLC and prostate cancers. ↑ NSCLC survival. |
↑ NSCLC and no correlation with survival. |
|
LYPD3 |
Ly6/PLAUR domain-containing protein 3 |
Squamous epithelia, placenta and peripheral blood leukocytes. |
↑ breast, colorectal, gastric, lung, melanoma and urothelial cancers. Correlates with poor NSCLC survival. |
General agreement. |
|
SLC7A11 |
Cystine/glutamate transporter (xCT) |
Role in regulation of oxidative stress and maintenance of the cysteine-cystine redox cycle. Brain, spinal cord and pancreas. |
↑ NSCLC and many cancer types. Role in drug resistance. |
Confirmed previous results in NSCLC with a larger data set and determined association with ↓ survival. |
|
TMPRSS4 |
Transmembrane protease serine 4 protein |
GI tract, urogenital tract, eye and skin. |
↑ breast, cervical, colorectal, gallbladder, gastric, liver, lung, ovarian, pancreatic and thyroid cancers. Cell invasion, migration and adhesion. ↑ correlates with poor survival. |
No correlation with survival. |
Five of the selected markers have either known imaging agents (CA9, CA12, KISS1R and SLC7A11) or known high affinity ligands (KISS1R) or inhibitors (TMPRSS4) and structure activity relationships (SAR) for development of imaging agents. We have recently developed monoclonal antibody agents against both CA9 and CA12 [25], there are numerous reports of CA9 targeted imaging agents [35–58], and there is a commercially available near-infrared (NIR) fluorescent carbonic anhydrase inhibitor-based agent (Hypoxisense, PerkinElmer). Two 18F-glutamate derivative PET agents and an 18F-aminosuberic acid derivative PET agent have also been developed that target the xC- transporter (SLC7A11) [62–69]. Recently, a fluorescent cystine derivative has also been developed for imaging the xC- transporter (SLC7A11) [70]. High-affinity agonist (including metastin analogs and fluorobenzoyl pentapeptides) [71–75, 79] and antagonist (including 2-acylamino-4,6-diphenyl-pyridine derivatives) [76–78] ligands are known for the KiSS-1 receptor (KISS1R). Recently, fluorescently labeled ligands have been developed for studying KISS1R [59–61]. In addition, a series of 2-hydroxydiarylamide derivatives have been reported as potential TMPRSS4 serine protease inhibitors [80]. These targeting moieties could be used to develop novel targeted imaging agents against these markers. For the remaining markers which have no known ligands or SAR (CXorf61, DSG3, FAT2, GPR87, and LYPD3), targeting moieties can be developed using various approaches, such as humanized monoclonal antibodies or antibody fragments, or phage display and one-bead one-compound (OBOC) combinatorial library screens. High mRNA expression of six of the NSCLC markers (CA9, CA12, CXorf61, GPR87, LYPD3 and SLC7A11) correlated with decreased patient survival (Table 7, and Figures 6 and 7). Hence, these cell-surface markers have potential for development of non-invasive diagnostic imaging agents that could provide additional information on patient prognosis.
Six of the markers studied are potential targets for development of smart-bomb or Trojan horse therapies that deliver cytotoxic agents or therapeutic radionuclides specifically to cancer cells. CXorf61, DSG3, GPR87, KISS1R, LYPD3, and SLC7A11 genes had high mRNA expression in patient lung tumor specimens and low mRNA expression in tissues of concern for toxicity (Table 1, Supplementary Tables 4, 5 and 7–10, and Figure 1B–1D, and Supplementary Figure 1B, 1C and 1E). Although DSG3 and LYPD3 are expressed in epithelial layers, and KISS1R and SLC7A11 are expressed in normal brain, the basement membrane and blood-brain barrier would likely inhibit uptake in those normal tissues. A recent report describes an antibody-drug conjugate targeting LYPD3 which showed efficacy in preclinical mouse models of lung cancer and is currently being tested in clinical trials [125]. IHC staining revealed that GPR87, LYPD3, and SLC7A11 had high positivity in lung tumor tissues but did not stain normal lung tissue (Table 3). High mRNA expression of four of these markers, CXorf61, GPR87, LYPD3 and SLC7A11, significantly correlated with decreased survival (Table 7, Figures 6C–6E and 7C –7E) and high IHC staining also correlated with decreased survival for LYPD3 (Figure 9A), indicating the potential need for improved therapies for these patients.
When combining mRNA expression data for LYPD3 and CA12 we can identify four subgroups (low LYPD3/low CA12, low LYPD3/high CA12, high LYPD3/low CA12 and high LYPD3/high CA12). High expression of both markers was correlated with decreased survival, whereas low expression of both markers correlated with increased survival (Figure 8B). These results could help guide treatment plans for patients with expression of these markers. In addition, a bivalent targeting ligand with low affinity for each individual target, but high affinity for tumor cells expressing both markers, would focus treatment on tumors with the worst prognosis, but spare normal tissues that express only one of the targets and decrease unwanted systemic toxicities [128]. This bivalent targeting ligand could be used as both a therapeutic agent and companion diagnostic.
We report a systematic approach for the identification of novel lung cancer markers with cell-surface expression that may have potential utility in personalized medicine applications. Our approach supported existing literature describing a number of known markers overexpressed in lung cancers and further showed whether or not expression of these markers significantly correlates with prognosis. The large numbers of patient lung tumor and normal tissue specimens included in the analysis enabled the discrimination of tumor expression from normal lung tissue as well as the analysis of recognized sub-types of NSCLC. Evaluation of both mRNA and protein expression results allows for comparison of the two major molecular manifestations of gene expression and the confirmation of cell-surface markers targetable for molecular imaging and delivery of cytotoxic agents or radionuclides. Inclusion of clinical data with corresponding mRNA and protein expression allowed for the correlation of marker expression with prognosis. Evaluation of a set of promising markers using the same tissue and data sets allows for the simultaneous evaluation of the relative utility of each marker as a target for specific clinical applications. Determination of marker expression in established lung cancer cell lines provides laboratory tools for the development of novel agents that target these specific markers. We identified 208 potential cell-surface markers specifically overexpressed in some lung tumors, but not in normal lung. We further demonstrated that 10 of these targets were detectable by immunohistochemistry and therefore good candidates for the development of novel targeted therapeutics. Some of our candidates are already being targeted in this way. For example, the xCT transporter (SLC7A11) was confirmed to be a potentially robust lung tumor imaging marker and PET imaging agents are already being developed for this transporter but have yet to be applied toward use in lung tumor imaging, except in a small pilot clinical trial [62–70]. Additionally, the Ly6/PLAUR domain-containing protein 3 (LYPD3) emerged as a novel target for development of a lung cancer targeted therapy, which could be co-developed with a companion imaging agent for the personalized treatment of lung cancer.
MATERIALS AND METHODS
Expression (mRNA) profiling of microarray data
Tissue data and analyses
Compilation and quality control assessments of public mRNA expression microarray data sets were carried out in the Moffitt Biomedical Informatics and Molecular Genomics Laboratories. Many separate GEO [129] datasets were compiled that included Affymetrix mRNA expression array data from lung tumor (LT), lung normal (LN), and non-lung normal (NLN) patient tissue specimen cohorts, consisting of 262, 161, and 246 samples, respectively (Supplementary Tables 33 and 34). The datasets were combined and normalized together. IRON [130] was used to normalize all samples against the median sample (GSM475685). Affymetrix probesets that do not detect cataloged human genes were removed prior to further analysis. The list of genes evaluated were further filtered using a curated list of probesets (Supplementary Table 35) that correspond to only secreted or outer membrane proteins as derived from manual assessment and Gene Ontology terms [131].
For the remaining probesets, averages (avg) and standard deviations (sd) of log2 intensities were calculated within lung tumors and normals, separately. A cutoff of avgnormal +3 sdnormal was used for determining elevated expression in lung tumor samples for each probeset. Percentages of samples with elevated expression were calculated within lung tumors (% elevatedtumor) and normals (% elevatednormal), separately. Log2 ratios (avgtumor_elevated – avgnormal) of average elevated tumor (samples above the +3 sdnormal cutoff) vs. average normal, two-sided T-tests and Mann-Whitney U-tests, and Hellinger distances were calculated between the lung tumor and normal groups. Probesets were identified as elevated in lung tumors using the following criteria: avgtumor_elevated > 5, % elevatedtumor > 25%, log2 ratio elevated ≥ 2 (4-fold), both lung all-tumor vs. all-normal T-test and U-tests < 4.2237e-6 (Bonferroni correction for P/N = 0.05/11,838), and Hellinger distance > 1/3rd. Elevated genes were then ranked in decreasing order by a MarkerScore, calculated as (% elevatedtumor – % elevatednormal) * (log2 ratio elevated). These genes were then manually assessed for cell-surface/membrane location using UniProt and the Human Protein Atlas and the gene was kept in the analysis if either source listed the protein as cell-surface/membrane. The Marker Score was used to rank genes in priority for additional manual inspection (including identifying probesets with high intensity and broad expression in lung tumors relative to normal lung and minimal expression outside of lung) and experimental validation as described below.
Cell line data and analyses
Additional verification of lung tumor expression was assessed using non-small cell lung cancer (NSCLC) cell line gene expression data from the Cancer Cell Line Encyclopedia (CCLE) [132]. All 991 CEL files were normalized using IRON [130] against the median sample. Principal component analysis (PCA) was performed, and samples identified that did not cluster with other samples of the same conformed site of origin (SOO). For 51 of these samples, literature and other notations in the metadata were used to support reclassification of the originally reported SOO to a new conformed SOO that agreed with the gene expression metadata. Twenty outlier samples, for which no justification could be found for altering their reported SOO, were discarded due to large disagreement between gene expression and reported SOO. These remaining 971 samples were then de-batched using COMBAT [133], using the batch reported in the metadata, and conformed SOO as covariate. From this batch-corrected data set, 114 cell lines were identified as NSCLC.
Immunohistochemistry (IHC) of tissue microarray (TMA)
An existing lung cancer tissue microarray (TMA), constructed by the Moffitt Tissue Core from formalin-fixed and paraffin-embedded (FFPE) samples, was utilized. The patient demographics for this TMA are provided in Supplementary Table 36. The TMA contains cores from 106 lung tumor samples, 8 normal lung samples, 4 liver samples, 6 spleen samples, and 2 lymph node samples. The TMA consists of cylindrical punches of the FFPE blocks using a Manual Tissue Arrayer (Beecher Instruments). The tumor samples on the TMA are initial biopsy samples that correspond to pathologies of all stages. However the TMA was retrospectively constructed only using tissues from patients that eventually reached Stage IV disease. Primary antibody optimizations were carried out by titrating antibodies at various dilutions on control tissues recommended by the manufacturer (Supplementary Table 37). Slides were stained using a Ventana Discovery XT automated system (Ventana Medical Systems, Tucson) as per the manufacturer’s protocol using proprietary reagents. Slides were deparaffinized on the automated system with EZ Prep solution (Ventana). Heat-induced antigen retrieval methods were used in either RiboCC or Cell Conditioning 1 (Ventana) as listed in Supplementary Table 37. Primary antibodies were diluted using Dako diluent (Carpenteria, CA, USA) at the optimal ratios and incubation times listed in Supplementary Table 37. The appropriate anti-mouse or anti-rabbit secondary antibody (Ventana Omnimap or Ultramap) was used for 12 to 20 min incubation. The Ventana ChromoMap kit detection system was used first and then slides were counterstained with hematoxylin. Following staining, slides were dehydrated and coverslipped. Positive controls were used following the antibody manufacturer recommendations. Negative controls were established by omitting the antibodies during the primary antibody incubation step.
Slides were scored by a pulmonary pathologist (F.K.K.) and each sample given a numerical intensity score (0–3) where 0 = negative, 1 = weak, 2 = moderate and 3 = strong staining. The percentage of tumor cell staining was also scored. This percentage is independent of the staining intensity. A heterogeneity score was calculated by determining the average cell staining percent for cells that stained, regardless of pathology score. For samples with pathology scores of 0 only, a 100% heterogeneity score indicates uniformly unstained.
Lung cancer patients and patient data
The protocol for this study was approved by the University of South Florida Institutional Review Board. The study included 442 lung cancer patients that were diagnosed with adenocarcinoma and recruited from Moffitt Cancer Center’s Total Cancer Care (TCC™) program [134] between April 2006 and August 2010. Patients for this analysis provided informed consent to the TCC™ protocol either at Moffitt (No. = 186) or one of eighteen TCC™ consortium/affiliate institutions (No. = 282). The demographic information of the patient cohort and details of the study design have been published elsewhere [135].
Statistical analyses
GraphPad Prism (Version 5.04, La Jolla, CA, USA) was used to generate the box/whiskers plots. Box plot whiskers represent the minimum to maximum values in the group, the box represents the 50th percentile, and the center line represents the median value. SAS software (Version 9.4, Cary, NC, USA) was used for data analysis. Dunnett’s multiple comparison was used for testing lung tumor (control) versus normal tissues and for testing normal lung (control) to different lung cancer histologies. Tukey’s all pairwise comparisons were used for testing between different cancer histologies. For all tests, p ≤ 0.05 was considered significant.
Statistical analyses were performed using Stata/MP 12.1 (StataCorp LP, College Station, TX, USA). Survival analyses were performed using Kaplan–Meier survival curves and the log-rank test. Overall survival was the primary endpoint and was assessed from the date of surgery to the date of last follow-up or death. Among individuals without an event (i.e., death), censoring occurred at either 5 years or date of last follow-up if less than 5 years. Normalized IHC values were calculated by taking the product of the staining intensity and percent tumor cell staining for each marker. Principal component analysis (PCA) was utilized to generate a “metagene” score of mRNA gene probes. We utilized a classification and regression tree (CART) approach to explore potential novel biomarker combinations. CART is a nonparametric data-mining tool that can segment data into meaningful subgroups and has been adapted for failure time data [136] using the Martingale Residuals of a Cox model to approximate chi-square values for any number of biomarker combinations.
Abbreviations
ALK: anaplastic lymphoma kinase; avg: average; CART: classification and regression tree; CCLE: Cancer Cell Line Encyclopedia; CT: computed tomography; EGFR: epidermal growth factor receptor; 18F-FDG: 18F-fluorodeoxyglucose; FFPE: formalin-fixed and paraffin-embedded; GPCR: G-protein-coupled receptor; IHC: immunohistochemistry; LDCT: low-dose computed tomography; LN: lung normal; LT: lung tumor; MRI: magnetic resonance imaging; NIR: near: infrared; NLN: non-lung normal; NLST: National Lung Screening Trial; NSCLC: non-small cell lung cancer; OBOC: one-bead one-compound; PCA: principal component analysis; PCR: polymerase chain reaction; PET: positron emission tomography; qRT-PCR: quantitative real-time reverse-transcriptase polymerase chain reaction; RT-PCR: reverse-transcriptase polymerase chain reaction; SAR: structure activity relationships; SCC: squamous cell carcinoma; sd: standard deviation; SOO: site of origin; TCC: Total Cancer Care; TMA: tissue microarray; WB: Western blot
Author contributions
AC, EW, MS, EH and DM contributed to the conception and design of the study. AC, FK, EW, MS, SE, and DM contributed to the acquisition of data. AC, EW, MS, AD, JZ, JK, DB, and DM contributed to the analysis and interpretation of data. EH contributed to the preparation by providing a clinical perspective in terms of targeted lung cancer therapy. AC, EW, MS and DM contributed to drafting the manuscript. AC, FK, EW, MS, SE, AD, JZ, JK, DB, EH and DM contributed to preparation of the manuscript. AC, FK, EW, MS, SE, AD, JZ, JK, DB, EH and DM gave final approval of the version to be published.
ACKNOWLEDGMENTS
The authors wish to acknowledge the Lung Cancer Center of Excellence and Lung SPORE at Moffitt for use of the tissue microarray (TMA). We also acknowledge Noel Clark and the Tissue Core facility, and the Bioinformatics and Biostatistics Core facility at H. Lee Moffitt Cancer Center & Research Institute, for help with the IHC staining of the TMA, profiling of the expression array data and statistical analyses. This study was conducted with approval of the University of South Florida Institutional Review Board (IRB).
CONFLICTS OF INTEREST
AC and DM are listed as inventors on patent number US20160051704 A1 “Molecular Imaging Probes for Lung Cancer Intraoperative Guidance” that covers the described markers. The other authors declare that they have no conflicts of interest.
FUNDING
This work was supported by a National Institutes of Health (NIH) SPORE Grant (P50-CA11997, PI: E.H.) and NIH SPORE Grant Career Development Award to Dr. David Morse. This work has been supported in part by a Cancer Center Support Grant (CCSG grant P30-CA76292) at the H. Lee Moffitt Cancer Center and Research Institute, a National Cancer Institute-designated Comprehensive Cancer Center.
REFERENCES
1. Siegel R, Miller KD, Jemal A. Cancer Statistics, 2017. CA Cancer J Clin. 2017; 67:7–30. https://doi.org/10.3322/caac.21387.
2. American Cancer Society. Cancer Facts & Figures 2017. Atlanta: American Cancer Society; 2017.
3. Islam S, Walker RC. Advanced imaging (positron emission tomography and magnetic resonance imaging) and image-guided biopsy in initial staging and monitoring of therapy of lung cancer. Cancer J. 2013; 19:208–16. https://doi.org/10.1097/PPO.0b013e318295185f.
4. Lee WK, Lau EW, Chin K, Sedlaczek O, Steinke K. Modern diagnostic and therapeutic interventional radiology in lung cancer. J Thorac Dis. 2013; 5:S511–23.
5. Koyama H, Ohno Y, Seki S, Nishio M, Yoshikawa T, Matsumoto S, Sugimura K. Magnetic resonance imaging for lung cancer. J Thorac Imaging. 2013; 28:138–50. https://doi.org/10.1097/RTI.0b013e31828d4234.
6. Akin O, Brennan SB, Dershaw DD, Ginsberg MS, Gollub MJ, Schöder H, Panicek DM, Hricak H. Advances in oncologic imaging: update on 5 common cancers. CA Cancer J Clin. 2012; 62:364–93. https://doi.org/10.3322/caac.21156.
7. Ruchalski KL, Brown K. Lung Cancer Screening Update. J Thorac Imaging. 2016; 31:190–200. https://doi.org/10.1097/RTI.0000000000000221.
8. Nakajima T, Yasufuku K. Early lung cancer: methods for detection. Clin Chest Med. 2013; 34:373–83. https://doi.org/10.1016/j.ccm.2013.04.005.
9. Hirsch FR, Franklin WA, Gazdar AF, Bunn PA Jr. Early detection of lung cancer: clinical perspectives of recent advances in biology and radiology. Clin Cancer Res. 2001; 7:5–22.
10. Cuaron J, Dunphy M, Rimner A. Role of FDG-PET scans in staging, response assessment, and follow-up care for non-small cell lung cancer. Front Oncol. 2013; 2:208. https://doi.org/10.3389/fonc.2012.00208.
11. Stanzel F. Fluorescent bronchoscopy: contribution for lung cancer screening? Lung Cancer. 2004; 45:S29–37. https://doi.org/10.1016/j.lungcan.2004.07.995.
12. Sutedja TG, Venmans BJ, Smit EF, Postmus PE. Fluorescence bronchoscopy for early detection of lung cancer: a clinical perspective. Lung Cancer. 2001; 34:157–68. https://doi.org/10.1016/S0169-5002(01)00242-2.
13. Siva S, Callahan JW, Kron T, Chesson B, Barnett SA, Macmanus MP, Hicks RJ, Ball DL. Respiratory-gated (4D) FDG-PET detects tumour and normal lung response after stereotactic radiotherapy for pulmonary metastases. Acta Oncol. 2015; 54:1105–12. https://doi.org/10.3109/0284186X.2015.1027409.
14. Maffione AM, Grassetto G, Rampin L, Chondrogiannis S, Marzola MC, Ambrosini V, Rubello D. Molecular imaging of pulmonary nodules. AJR Am J Roentgenol. 2014; 202:W217-23. https://doi.org/10.2214/AJR.13.11733.
15. Yu EY, Mankoff DA. Positron emission tomography imaging as a cancer biomarker. Expert Rev Mol Diagn. 2007; 7:659–72. https://doi.org/10.1586/14737159.7.5.659.
16. Cohen AS, Patek R, Enkemann SA, Johnson JO, Chen T, Toloza E, Vagner J, Morse DL. Delta-Opioid Receptor (δOR) Targeted Near-Infrared Fluorescent Agent for Imaging of Lung Cancer: Synthesis and Evaluation In Vitro and In Vivo. Bioconjug Chem. 2016; 27:427–38. https://doi.org/10.1021/acs.bioconjchem.5b00516.
17. Hirsch FR, Suda K, Wiens J, Bunn PA Jr. New and emerging targeted treatments in advanced non-small-cell lung cancer. Lancet. 2016; 388:1012–24. https://doi.org/10.1016/S0140-6736(16)31473-8.
18. Roskoski R Jr. Anaplastic lymphoma kinase (ALK) inhibitors in the treatment of ALK-driven lung cancers. Pharmacol Res. 2017; 117:343–56. https://doi.org/10.1016/j.phrs.2017.01.007.
19. Tanvetyanon T, Gray JE, Antonia SJ. PD-1 checkpoint blockade alone or combined PD-1 and CTLA-4 blockade as immunotherapy for lung cancer? Expert Opin Biol Ther. 2017; 17:305–12. https://doi.org/10.1080/14712598.2017.1280454.
20. Crystal AS, Shaw AT, Sequist LV, Friboulet L, Niederst MJ, Lockerman EL, Frias RL, Gainor JF, Amzallag A, Greninger P, Lee D, Kalsy A, Gomez-Caraballo M, et al. Patient-derived models of acquired resistance can identify effective drug combinations for cancer. Science. 2014; 346:1480–86. https://doi.org/10.1126/science.1254721.
21. Bellone M, Elia AR. Constitutive and acquired mechanisms of resistance to immune checkpoint blockade in human cancer. Cytokine Growth Factor Rev. 2017; 36:17–24. https://doi.org/10.1016/j.cytogfr.2017.06.002.
22. Manchado E, Weissmueller S, Morris JP 4th, Chen CC, Wullenkord R, Lujambio A, de Stanchina E, Poirier JT, Gainor JF, Corcoran RB, Engelman JA, Rudin CM, Rosen N, et al. A combinatorial strategy for treating KRAS-mutant lung cancer. Nature. 2016; 534:647–51. https://doi.org/10.1038/nature18600.
23. Bozic I, Reiter JG, Allen B, Antal T, Chatterjee K, Shah P, Moon YS, Yaqubie A, Kelly N, Le DT, Lipson EJ, Chapman PB, Diaz LA Jr, et al. Evolutionary dynamics of cancer in response to targeted combination therapy. eLife. 2013; 2:e00747. https://doi.org/10.7554/eLife.00747.
24. Tafreshi NK, Enkemann SA, Bui MM, Lloyd MC, Abrahams D, Huynh AS, Kim J, Grobmyer SR, Carter WB, Vagner J, Gillies RJ, Morse DL. A mammaglobin-A targeting agent for noninvasive detection of breast cancer metastasis in lymph nodes. Cancer Res. 2011; 71:1050–59. https://doi.org/10.1158/0008-5472.CAN-10-3091.
25. Tafreshi NK, Bui MM, Bishop K, Lloyd MC, Enkemann SA, Lopez AS, Abrahams D, Carter BW, Vagner J, Grobmyer SR, Gillies RJ, Morse DL. Noninvasive detection of breast cancer lymph node metastasis using carbonic anhydrases IX and XII targeted imaging probes. Clin Cancer Res. 2012; 18:207–19. https://doi.org/10.1158/1078-0432.CCR-11-0238.
26. Balagurunathan Y, Morse DL, Hostetter G, Shanmugam V, Stafford P, Shack S, Pearson J, Trissal M, Demeure MJ, Von Hoff DD, Hruby VJ, Gillies RJ, Han H. Gene expression profiling-based identification of cell-surface targets for developing multimeric ligands in pancreatic cancer. Mol Cancer Ther. 2008; 7:3071–80. https://doi.org/10.1158/1535-7163.MCT-08-0402.
27. Morse DL, Balagurunathan Y, Hostetter G, Trissal M, Tafreshi NK, Burke N, Lloyd M, Enkemann S, Coppola D, Hruby VJ, Gillies RJ, Han H. Identification of novel pancreatic adenocarcinoma cell-surface targets by gene expression profiling and tissue microarray. Biochem Pharmacol. 2010; 80:748–54. https://doi.org/10.1016/j.bcp.2010.05.018.
28. Morse DL, Hostetter G, Balagurunathan Y, Gillies RJ, Han H. Identification of pancreatic cancer-specific cell-surface markers for development of targeting ligands. Methods Mol Biol. 2010; 624:195–210. https://doi.org/10.1007/978-1-60761-609-2_13.
29. Tafreshi NK, Silva A, Estrella VC, McCardle TW, Chen T, Jeune-Smith Y, Lloyd MC, Enkemann SA, Smalley KS, Sondak VK, Vagner J, Morse DL. In vivo and in silico pharmacokinetics and biodistribution of a melanocortin receptor 1 targeted agent in preclinical models of melanoma. Mol Pharm. 2013; 10:3175–85. https://doi.org/10.1021/mp400222j.
30. Sewda K, Coppola D, Enkemann S, Yue B, Kim J, Lopez AS, Wojtkowiak JW, Stark VE, Morse B, Shibata D, Vignesh S, Morse DL. Cell-surface markers for colon adenoma and adenocarcinoma. Oncotarget. 2016; 7:17773–89. https://doi.org/10.18632/oncotarget.7402.
31. Josan JS, Morse DL, Xu L, Trissal M, Baggett B, Davis P, Vagner J, Gillies RJ, Hruby VJ. Solid-phase synthetic strategy and bioevaluation of a labeled delta-opioid receptor ligand Dmt-Tic-Lys for in vivo imaging. Org Lett. 2009; 11:2479–82. https://doi.org/10.1021/ol900200k.
32. Huynh AS, Abrahams DF, Torres MS, Baldwin MK, Gillies RJ, Morse DL. Development of an orthotopic human pancreatic cancer xenograft model using ultrasound guided injection of cells. PLoS One. 2011; 6:e20330. https://doi.org/10.1371/journal.pone.0020330.
33. Huynh AS, Chung WJ, Cho HI, Moberg VE, Celis E, Morse DL, Vagner J. Novel toll-like receptor 2 ligands for targeted pancreatic cancer imaging and immunotherapy. J Med Chem. 2012; 55:9751–62. https://doi.org/10.1021/jm301002f.
34. Tafreshi NK, Huang X, Moberg VE, Barkey NM, Sondak VK, Tian H, Morse DL, Vagner J. Synthesis and characterization of a melanoma-targeted fluorescence imaging probe by conjugation of a melanocortin 1 receptor (MC1R) specific ligand. Bioconjug Chem. 2012; 23:2451–59. https://doi.org/10.1021/bc300549s.
35. Tafreshi NK, Lloyd MC, Bui MM, Gillies RJ, Morse DL. Carbonic Anhydrase IX as an Imaging and Therapeutic Target for Tumors and Metastases. In: Frost SC, McKenna R, eds. Carbonic Anhydrase: Mechanism, Regulation, Links to Disease, and Industrial Applications. 2014; 221–254. https://doi.org/10.1007/978-94-007-7359-2_12.
36. Groves K, Bao B, Zhang J, Handy E, Kennedy P, Cuneo G, Supuran CT, Yared W, Peterson JD, Rajopadhye M. Synthesis and evaluation of near-infrared fluorescent sulfonamide derivatives for imaging of hypoxia-induced carbonic anhydrase IX expression in tumors. Bioorg Med Chem Lett. 2012; 22:653–57. https://doi.org/10.1016/j.bmcl.2011.10.058.
37. Bao B, Groves K, Zhang J, Handy E, Kennedy P, Cuneo G, Supuran CT, Yared W, Rajopadhye M, Peterson JD. In vivo imaging and quantification of carbonic anhydrase IX expression as an endogenous biomarker of tumor hypoxia. PLoS One. 2012; 7:e50860. https://doi.org/10.1371/journal.pone.0050860.
38. van Brussel AS, Adams A, Vermeulen JF, Oliveira S, van der Wall E, Mali WP, van Diest PJ, van Bergen En Henegouwen PM. Molecular imaging with a fluorescent antibody targeting carbonic anhydrase IX can successfully detect hypoxic ductal carcinoma in situ of the breast. Breast Cancer Res Treat. 2013; 140:263–72. https://doi.org/10.1007/s10549-013-2635-6.
39. Rana S, Nissen F, Lindner T, Altmann A, Mier W, Debus J, Haberkorn U, Askoxylakis V. Screening of a novel peptide targeting the proteoglycan-like region of human carbonic anhydrase IX. Mol Imaging. 2013; 12:1–12.
40. Lu G, Hillier SM, Maresca KP, Zimmerman CN, Eckelman WC, Joyal JL, Babich JW. Synthesis and SAR of novel Re/99mTc-labeled benzenesulfonamide carbonic anhydrase IX inhibitors for molecular imaging of tumor hypoxia. J Med Chem. 2013; 56:510–20. https://doi.org/10.1021/jm3015348.
41. Muselaers CH, Stillebroer AB, Rijpkema M, Franssen GM, Oosterwijk E, Mulders PF, Oyen WJ, Boerman OC. Optical Imaging of Renal Cell Carcinoma with Anti-Carbonic Anhydrase IX Monoclonal Antibody Girentuximab. J Nucl Med. 2014; 55:1035–40. https://doi.org/10.2967/jnumed.114.137356.
42. Muselaers CH, Rijpkema M, Bos DL, Langenhuijsen JF, Oyen WJ, Mulders PF, Oosterwijk E, Boerman OC. Radionuclide and Fluorescence Imaging of Clear Cell Renal Cell Carcinoma Using Dual Labeled Anti-Carbonic Anhydrase IX Antibody G250. J Urol. 2015; 194:532–38. https://doi.org/10.1016/j.juro.2015.02.041.
43. Yang X, Minn I, Rowe SP, Banerjee SR, Gorin MA, Brummet M, Lee HS, Koo SM, Sysa-Shah P, Mease RC, Nimmagadda S, Allaf ME, Pomper MG. Imaging of carbonic anhydrase IX with an 111In-labeled dual-motif inhibitor. Oncotarget. 2015; 6:33733–42. https://doi.org/10.18632/oncotarget.5254.
44. Rijpkema M, Bos DL, Cornelissen AS, Franssen GM, Goldenberg DM, Oyen WJ, Boerman OC. Optimization of Dual-Labeled Antibodies for Targeted Intraoperative Imaging of Tumors. Mol Imaging. 2015; 14:348–55.
45. Honarvar H, Garousi J, Gunneriusson E, Höidén-Guthenberg I, Altai M, Widström C, Tolmachev V, Frejd FY. Imaging of CAIX-expressing xenografts in vivo using 99mTc-HEHEHE-ZCAIX:1 affibody molecule. Int J Oncol. 2015; 46:513–20. https://doi.org/10.3892/ijo.2014.2782.
46. Wichert M, Krall N, Decurtins W, Franzini RM, Pretto F, Schneider P, Neri D, Scheuermann J. Dual-display of small molecules enables the discovery of ligand pairs and facilitates affinity maturation. Nat Chem. 2015; 7:241–49. https://doi.org/10.1038/nchem.2158.
47. Lau J, Liu Z, Lin KS, Pan J, Zhang Z, Vullo D, Supuran CT, Perrin DM, Bénard F. Trimeric Radiofluorinated Sulfonamide Derivatives to Achieve In Vivo Selectivity for Carbonic Anhydrase IX-Targeted PET Imaging. J Nucl Med. 2015; 56:1434–40. https://doi.org/10.2967/jnumed.114.153288.
48. Lau J, Zhang Z, Jenni S, Kuo HT, Liu Z, Vullo D, Supuran CT, Lin KS, Bénard F. PET Imaging of Carbonic Anhydrase IX Expression of HT-29 Tumor Xenograft Mice with (68)Ga-Labeled Benzenesulfonamides. Mol Pharm. 2016; 13:1137–46. https://doi.org/10.1021/acs.molpharmaceut.5b00934.
49. Sneddon D, Niemans R, Bauwens M, Yaromina A, van Kuijk SJ, Lieuwes NG, Biemans R, Pooters I, Pellegrini PA, Lengkeek NA, Greguric I, Tonissen KF, Supuran CT, et al. Synthesis and in Vivo Biological Evaluation of (68)Ga-Labeled Carbonic Anhydrase IX Targeting Small Molecules for Positron Emission Tomography. J Med Chem. 2016; 59:6431–43. https://doi.org/10.1021/acs.jmedchem.6b00623.
50. Krall N, Pretto F, Mattarella M, Müller C, Neri D. A 99mTc-Labeled Ligand of Carbonic Anhydrase IX Selectively Targets Renal Cell Carcinoma In Vivo. J Nucl Med. 2016; 57:943–49. https://doi.org/10.2967/jnumed.115.170514.
51. Minn I, Koo SM, Lee HS, Brummet M, Rowe SP, Gorin MA, Sysa-Shah P, Lewis WD, Ahn HH, Wang Y, Banerjee SR, Mease RC, Nimmagadda S, et al. [64Cu]XYIMSR-06: A dual-motif CAIX ligand for PET imaging of clear cell renal cell carcinoma. Oncotarget. 2016; 7:56471–79. https://doi.org/10.18632/oncotarget.10602.
52. Luo Z, Zhu H, Lin X, Chu T, Luo R, Wang Y, Yang Z. Synthesis and radiolabeling of (64)Cu-labeled 2-nitroimidazole derivative (64)Cu-BMS2P2 for hypoxia imaging. Bioorg Med Chem Lett. 2016; 26:1397–400. https://doi.org/10.1016/j.bmcl.2016.01.077.
53. Garousi J, Honarvar H, Andersson KG, Mitran B, Orlova A, Buijs J, Löfblom J, Frejd FY, Tolmachev V. Comparative Evaluation of Affibody Molecules for Radionuclide Imaging of in Vivo Expression of Carbonic Anhydrase IX. Mol Pharm. 2016; 13:3676–87. https://doi.org/10.1021/acs.molpharmaceut.6b00502.
54. Li J, Bao B, Liu L, Wang X. Near-Infrared Fluorescence Imaging of Carbonic Anhydrase IX in Athymic Mice Bearing HT-29 Tumor Xenografts. Biomed Res Int. 2016; 2016:6825712.
55. Kijanka MM, van Brussel AS, van der Wall E, Mali WP, van Diest PJ, van Bergen En Henegouwen PM, Oliveira S. Optical imaging of pre-invasive breast cancer with a combination of VHHs targeting CAIX and HER2 increases contrast and facilitates tumour characterization. EJNMMI Res. 2016; 6:14. https://doi.org/10.1186/s13550-016-0166-y.
56. van Brussel AS, Adams A, Oliveira S, Dorresteijn B, El Khattabi M, Vermeulen JF, van der Wall E, Mali WP, Derksen PW, van Diest PJ, van Bergen En Henegouwen PM. Hypoxia-Targeting Fluorescent Nanobodies for Optical Molecular Imaging of Pre-Invasive Breast Cancer. Mol Imaging Biol. 2016; 18:535–44. https://doi.org/10.1007/s11307-015-0909-6.
57. Hekman MC, Boerman OC, de Weijert M, Bos DL, Oosterwijk E, Langenhuijsen JF, Mulders PF, Rijpkema M. Targeted Dual-Modality Imaging in Renal Cell Carcinoma: An Ex Vivo Kidney Perfusion Study. Clin Cancer Res. 2016; 22:4634–42. https://doi.org/10.1158/1078-0432.CCR-15-2937.
58. Lv PC, Roy J, Putt KS, Low PS. Evaluation of a Carbonic Anhydrase IX-Targeted Near-Infrared Dye for Fluorescence-Guided Surgery of Hypoxic Tumors. Mol Pharm. 2016; 13:1618–25. https://doi.org/10.1021/acs.molpharmaceut.6b00065.
59. Kaneda M, Misu R, Ohno H, Hirasawa A, Ieda N, Uenoyama Y, Tsukamura H, Maeda K, Oishi S, Fujii N. Design and synthesis of fluorescent probes for GPR54. Bioorg Med Chem. 2014; 22:3325–30. https://doi.org/10.1016/j.bmc.2014.04.052.
60. Camerino MA, Liu M, Moriya S, Kitahashi T, Mahgoub A, Mountford SJ, Chalmers DK, Soga T, Parhar IS, Thompson PE. Beta amino acid-modified and fluorescently labelled kisspeptin analogues with potent KISS1R activity. J Pept Sci. 2016; 22:406–14. https://doi.org/10.1002/psc.2883.
61. Dotterweich J, Tower RJ, Brandl A, Müller M, Hofbauer LC, Beilhack A, Ebert R, Glüer CC, Tiwari S, Schütze N, Jakob F. The KISS1 Receptor as an In Vivo Microenvironment Imaging Biomarker of Multiple Myeloma Bone Disease. PLoS One. 2016; 11:e0155087. https://doi.org/10.1371/journal.pone.0155087.
62. Koglin N, Mueller A, Berndt M, Schmitt-Willich H, Toschi L, Stephens AW, Gekeler V, Friebe M, Dinkelborg LM. Specific PET imaging of xC- transporter activity using a 18F-labeled glutamate derivative reveals a dominant pathway in tumor metabolism. Clin Cancer Res. 2011; 17:6000–11. https://doi.org/10.1158/1078-0432.CCR-11-0687.
63. Baek S, Choi CM, Ahn SH, Lee JW, Gong G, Ryu JS, Oh SJ, Bacher-Stier C, Fels L, Koglin N, Hultsch C, Schatz CA, Dinkelborg LM, et al. Exploratory clinical trial of (4S)-4-(3-[18F]fluoropropyl)-L-glutamate for imaging xC- transporter using positron emission tomography in patients with non-small cell lung or breast cancer. Clin Cancer Res. 2012; 18:5427–37. https://doi.org/10.1158/1078-0432.CCR-12-0214.
64. Ploessl K, Wang L, Lieberman BP, Qu W, Kung HF. Comparative evaluation of 18F-labeled glutamic acid and glutamine as tumor metabolic imaging agents. J Nucl Med. 2012; 53:1616–24. https://doi.org/10.2967/jnumed.111.101279.
65. Baek S, Mueller A, Lim YS, Lee HC, Lee YJ, Gong G, Kim JS, Ryu JS, Oh SJ, Lee SJ, Bacher-Stier C, Fels L, Koglin N, et al. (4S)-4-(3-18F-fluoropropyl)-L-glutamate for imaging of xC transporter activity in hepatocellular carcinoma using PET: preclinical and exploratory clinical studies. J Nucl Med. 2013; 54:117–23. https://doi.org/10.2967/jnumed.112.108704.
66. Webster JM, Morton CA, Johnson BF, Yang H, Rishel MJ, Lee BD, Miao Q, Pabba C, Yapp DT, Schaffer P. Functional imaging of oxidative stress with a novel PET imaging agent, 18F-5-fluoro-L-aminosuberic acid. J Nucl Med. 2014; 55:657–64. https://doi.org/10.2967/jnumed.113.126664.
67. Yang H, Jenni S, Colovic M, Merkens H, Poleschuk C, Rodrigo I, Miao Q, Johnson BF, Rishel MJ, Sossi V, Webster JM, Bénard F, Schaffer P. 18F-5-fluoro-aminosuberic acid (FASu) as a potential tracer to gauge oxidative stress in breast cancer models. J Nucl Med. 2017; 58:367–373.
68. Mittra ES, Koglin N, Mosci C, Kumar M, Hoehne A, Keu KV, Iagaru AH, Mueller A, Berndt M, Bullich S, Friebe M, Schmitt-Willich H, Gekeler V, et al. Pilot Preclinical and Clinical Evaluation of (4S)-4-(3-[18F]Fluoropropyl)-L-Glutamate (18F-FSPG) for PET/CT Imaging of Intracranial Malignancies. PLoS One. 2016; 11:e0148628. https://doi.org/10.1371/journal.pone.0148628.
69. Kavanaugh G, Williams J, Morris AS, Nickels ML, Walker R, Koglin N, Stephens AW, Washington MK, Geevarghese SK, Liu Q, Ayers D, Shyr Y, Manning HC. Utility of [18F]FSPG PET to Image Hepatocellular Carcinoma: First Clinical Evaluation in a US Population. Mol Imaging Biol. 2016; 18:924–34. https://doi.org/10.1007/s11307-016-1007-0.
70. Siska PJ, Kim B, Ji X, Hoeksema MD, Massion PP, Beckermann KE, Wu J, Chi JT, Hong J, Rathmell JC. Fluorescence-based measurement of cystine uptake through xCT shows requirement for ROS detoxification in activated lymphocytes. J Immunol Methods. 2016; 438:51–58. https://doi.org/10.1016/j.jim.2016.08.013.
71. Masui T, Doi R, Mori T, Toyoda E, Koizumi M, Kami K, Ito D, Peiper SC, Broach JR, Oishi S, Niida A, Fujii N, Imamura M. Metastin and its variant forms suppress migration of pancreatic cancer cells. Biochem Biophys Res Commun. 2004; 315:85–92. https://doi.org/10.1016/j.bbrc.2004.01.021.
72. Niida A, Wang Z, Tomita K, Oishi S, Tamamura H, Otaka A, Navenot JM, Broach JR, Peiper SC, Fujii N. Design and synthesis of downsized metastin (45-54) analogs with maintenance of high GPR54 agonistic activity. Bioorg Med Chem Lett. 2006; 16:134–37. https://doi.org/10.1016/j.bmcl.2005.09.054.
73. Tomita K, Niida A, Oishi S, Ohno H, Cluzeau J, Navenot JM, Wang ZX, Peiper SC, Fujii N. Structure-activity relationship study on small peptidic GPR54 agonists. Bioorg Med Chem. 2006; 14:7595–603. https://doi.org/10.1016/j.bmc.2006.07.009.
74. Tomita K, Oishi S, Cluzeau J, Ohno H, Navenot JM, Wang ZX, Peiper SC, Akamatsu M, Fujii N. SAR and QSAR studies on the N-terminally acylated pentapeptide agonists for GPR54. J Med Chem. 2007; 50:3222–28. https://doi.org/10.1021/jm070064l.
75. Tomita K, Oishi S, Ohno H, Fujii N. Structure-activity relationship study and NMR analysis of fluorobenzoyl pentapeptide GPR54 agonists. Biopolymers. 2008; 90:503–11. https://doi.org/10.1002/bip.20968.
76. Kuohung W, Burnett M, Mukhtyar D, Schuman E, Ni J, Crowley WF, Glicksman MA, Kaiser UB. A high-throughput small-molecule ligand screen targeted to agonists and antagonists of the G-protein-coupled receptor GPR54. J Biomol Screen. 2010; 15:508–17. https://doi.org/10.1177/1087057110369701.
77. Kobayashi T, Sasaki S, Tomita N, Fukui S, Nakayama M, Kiba A, Kusaka M, Matsumoto S, Yamaguchi M, Itoh F, Baba A. 2-acylamino-4,6-diphenylpyridine derivatives as novel GPR54 antagonists with good brain exposure and in vivo efficacy for plasma LH level in male rats. Bioorg Med Chem. 2010; 18:5157–71. https://doi.org/10.1016/j.bmc.2010.05.061.
78. Kobayashi T, Sasaki S, Tomita N, Fukui S, Kuroda N, Nakayama M, Kiba A, Takatsu Y, Ohtaki T, Itoh F, Baba A. Synthesis and structure-activity relationships of 2-acylamino-4,6-diphenylpyridine derivatives as novel antagonists of GPR54. Bioorg Med Chem. 2010; 18:3841–59. https://doi.org/10.1016/j.bmc.2010.04.036.
79. Asami T, Nishizawa N, Matsui H, Nishibori K, Ishibashi Y, Horikoshi Y, Nakayama M, Matsumoto S, Tarui N, Yamaguchi M, Matsumoto H, Ohtaki T, Kitada C. Design, synthesis, and biological evaluation of novel investigational nonapeptide KISS1R agonists with testosterone-suppressive activity. J Med Chem. 2013; 56:8298–307. https://doi.org/10.1021/jm401056w.
80. Kang S, Min HJ, Kang MS, Jung MG, Kim S. Discovery of novel 2-hydroxydiarylamide derivatives as TMPRSS4 inhibitors. Bioorg Med Chem Lett. 2013; 23:1748–51. https://doi.org/10.1016/j.bmcl.2013.01.055.
81. McKiernan JM, Buttyan R, Bander NH, Stifelman MD, Katz AE, Chen MW, Olsson CA, Sawczuk IS. Expression of the tumor-associated gene MN: a potential biomarker for human renal cell carcinoma. Cancer Res. 1997; 57:2362–65.
82. Ivanov SV, Kuzmin I, Wei MH, Pack S, Geil L, Johnson BE, Stanbridge EJ, Lerman MI. Down-regulation of transmembrane carbonic anhydrases in renal cell carcinoma cell lines by wild-type von Hippel-Lindau transgenes. Proc Natl Acad Sci USA. 1998; 95:12596–601. https://doi.org/10.1073/pnas.95.21.12596.
83. Ivanov S, Liao SY, Ivanova A, Danilkovitch-Miagkova A, Tarasova N, Weirich G, Merrill MJ, Proescholdt MA, Oldfield EH, Lee J, Zavada J, Waheed A, Sly W, et al. Expression of hypoxia-inducible cell-surface transmembrane carbonic anhydrases in human cancer. Am J Pathol. 2001; 158:905–19. https://doi.org/10.1016/S0002-9440(10)64038-2.
84. Li B, Chang J, Chu Y, Kang H, Yang J, Jiang J, Ma H. Membrane proteomic analysis comparing squamous cell lung cancer tissue and tumour-adjacent normal tissue. Cancer Lett. 2012; 319:118–24. https://doi.org/10.1016/j.canlet.2011.12.037.
85. Zhang X, Li W, Hou Y, Niu Z, Zhong Y, Zhang Y, Yang S. Comparative membrane proteomic analysis between lung adenocarcinoma and normal tissue by iTRAQ labeling mass spectrometry. Am J Transl Res. 2014; 6:267–80.
86. Ishikawa N, Daigo Y, Takano A, Taniwaki M, Kato T, Tanaka S, Yasui W, Takeshima Y, Inai K, Nishimura H, Tsuchiya E, Kohno N, Nakamura Y. Characterization of SEZ6L2 cell-surface protein as a novel prognostic marker for lung cancer. Cancer Sci. 2006; 97:737–45. https://doi.org/10.1111/j.1349-7006.2006.00258.x.
87. Takano A, Ishikawa N, Nishino R, Masuda K, Yasui W, Inai K, Nishimura H, Ito H, Nakayama H, Miyagi Y, Tsuchiya E, Kohno N, Nakamura Y, et al. Identification of nectin-4 oncoprotein as a diagnostic and therapeutic target for lung cancer. Cancer Res. 2009; 69:6694–703. https://doi.org/10.1158/0008-5472.CAN-09-0016.
88. Ishikawa N, Daigo Y, Yasui W, Inai K, Nishimura H, Tsuchiya E, Kohno N, Nakamura Y. ADAM8 as a novel serological and histochemical marker for lung cancer. Clin Cancer Res. 2004; 10:8363–70. https://doi.org/10.1158/1078-0432.CCR-04-1436.
89. Furukawa C, Daigo Y, Ishikawa N, Kato T, Ito T, Tsuchiya E, Sone S, Nakamura Y. Plakophilin 3 oncogene as prognostic marker and therapeutic target for lung cancer. Cancer Res. 2005; 65:7102–10. https://doi.org/10.1158/0008-5472.CAN-04-1877.
90. Takahashi K, Furukawa C, Takano A, Ishikawa N, Kato T, Hayama S, Suzuki C, Yasui W, Inai K, Sone S, Ito T, Nishimura H, Tsuchiya E, et al. The neuromedin U-growth hormone secretagogue receptor 1b/neurotensin receptor 1 oncogenic signaling pathway as a therapeutic target for lung cancer. Cancer Res. 2006; 66:9408–19. https://doi.org/10.1158/0008-5472.CAN-06-1349.
91. Gugger M, White R, Song S, Waser B, Cescato R, Rivière P, Reubi JC. GPR87 is an overexpressed G-protein coupled receptor in squamous cell carcinoma of the lung. Dis Markers. 2008; 24:41–50. https://doi.org/10.1155/2008/857474.
92. Botling J, Edlund K, Lohr M, Hellwig B, Holmberg L, Lambe M, Berglund A, Ekman S, Bergqvist M, Pontén F, König A, Fernandes O, Karlsson M, et al. Biomarker discovery in non-small cell lung cancer: integrating gene expression profiling, meta-analysis, and tissue microarray validation. Clin Cancer Res. 2013; 19:194–204. https://doi.org/10.1158/1078-0432.CCR-12-1139.
93. Swinson DE, Jones JL, Richardson D, Wykoff C, Turley H, Pastorek J, Taub N, Harris AL, O’Byrne KJ. Carbonic anhydrase IX expression, a novel surrogate marker of tumor hypoxia, is associated with a poor prognosis in non-small-cell lung cancer. J Clin Oncol. 2003; 21:473–82. https://doi.org/10.1200/JCO.2003.11.132.
94. Vermylen P, Roufosse C, Burny A, Verhest A, Bosschaerts T, Pastorekova S, Ninane V, Sculier JP. Carbonic anhydrase IX antigen differentiates between preneoplastic malignant lesions in non-small cell lung carcinoma. Eur Respir J. 1999; 14:806–11. https://doi.org/10.1034/j.1399-3003.1999.14d14.x.
95. Kim SJ, Rabbani ZN, Vollmer RT, Schreiber EG, Oosterwijk E, Dewhirst MW, Vujaskovic Z, Kelley MJ. Carbonic anhydrase IX in early-stage non-small cell lung cancer. Clin Cancer Res. 2004; 10:7925–33. https://doi.org/10.1158/1078-0432.CCR-04-0636.
96. Andersen S, Eilertsen M, Donnem T, Al-Shibli K, Al-Saad S, Busund LT, Bremnes RM. Diverging prognostic impacts of hypoxic markers according to NSCLC histology. Lung Cancer. 2011; 72:294–302. https://doi.org/10.1016/j.lungcan.2010.10.006.
97. Giatromanolaki A, Koukourakis MI, Sivridis E, Pastorek J, Wykoff CC, Gatter KC, Harris AL. Expression of hypoxia-inducible carbonic anhydrase-9 relates to angiogenic pathways and independently to poor outcome in non-small cell lung cancer. Cancer Res. 2001; 61:7992–98.
98. Kim SJ, Rabbani ZN, Dewhirst MW, Vujaskovic Z, Vollmer RT, Schreiber EG, Oosterwijk E, Kelley MJ. Expression of HIF-1alpha, CA IX, VEGF, and MMP-9 in surgically resected non-small cell lung cancer. Lung Cancer. 2005; 49:325–35. https://doi.org/10.1016/j.lungcan.2005.03.036.
99. Ilie M, Mazure NM, Hofman V, Ammadi RE, Ortholan C, Bonnetaud C, Havet K, Venissac N, Mograbi B, Mouroux J, Pouysségur J, Hofman P. High levels of carbonic anhydrase IX in tumour tissue and plasma are biomarkers of poor prognostic in patients with non-small cell lung cancer. Br J Cancer. 2010; 102:1627–35. https://doi.org/10.1038/sj.bjc.6605690.
100. Kon-no H, Ishii G, Nagai K, Yoshida J, Nishimura M, Nara M, Fujii T, Murata Y, Miyamoto H, Ochiai A. Carbonic anhydrase IX expression is associated with tumor progression and a poor prognosis of lung adenocarcinoma. Lung Cancer. 2006; 54:409–18. https://doi.org/10.1016/j.lungcan.2006.08.017.
101. Le QT, Chen E, Salim A, Cao H, Kong CS, Whyte R, Donington J, Cannon W, Wakelee H, Tibshirani R, Mitchell JD, Richardson D, O’Byrne KJ, et al. An evaluation of tumor oxygenation and gene expression in patients with early stage non-small cell lung cancers. Clin Cancer Res. 2006; 12:1507–14. https://doi.org/10.1158/1078-0432.CCR-05-2049.
102. Simi L, Venturini G, Malentacchi F, Gelmini S, Andreani M, Janni A, Pastorekova S, Supuran CT, Pazzagli M, Orlando C. Quantitative analysis of carbonic anhydrase IX mRNA in human non-small cell lung cancer. Lung Cancer. 2006; 52:59–66. https://doi.org/10.1016/j.lungcan.2005.11.017.
103. Skrzypski M, Dziadziuszko R, Jassem E, Szymanowska-Narloch A, Gulida G, Rzepko R, Biernat W, Taron M, Jelitto-Górska M, Marjański T, Rzyman W, Rosell R, Jassem J. Main histologic types of non-small-cell lung cancer differ in expression of prognosis-related genes. Clin Lung Cancer. 2013; 14:666–673.e2. https://doi.org/10.1016/j.cllc.2013.04.010.
104. Skrzypski M, Jassem E, Taron M, Sanchez JJ, Mendez P, Rzyman W, Gulida G, Raz D, Jablons D, Provencio M, Massuti B, Chaib I, Perez-Roca L, et al. Three-gene expression signature predicts survival in early-stage squamous cell carcinoma of the lung. Clin Cancer Res. 2008; 14:4794–99. https://doi.org/10.1158/1078-0432.CCR-08-0576.
105. Suwinski R, Klusek A, Tyszkiewicz T, Kowalska M, Szczesniak-Klusek B, Gawkowska-Suwinska M, Tukiendorf A, Kozielski J, Jarzab M. Gene expression from bronchoscopy obtained tumour samples as a predictor of outcome in advanced inoperable lung cancer. PLoS One. 2012; 7:e41379. https://doi.org/10.1371/journal.pone.0041379.
106. Stewart DJ, Nunez MI, Behrens C, Liu D, Lin YH, Lee JJ, Roth J, Heymach J, Swisher SG, Hong WK, Wistuba II. Membrane carbonic anhydrase IX expression and relapse risk in resected stage I-II non-small-cell lung cancer. J Thorac Oncol. 2014; 9:675–84. https://doi.org/10.1097/JTO.0000000000000148.
107. Schuurbiers OC, Meijer TW, Kaanders JH, Looijen-Salamon MG, de Geus-Oei LF, van der Drift MA, van der Heijden EH, Oyen WJ, Visser EP, Span PN, Bussink J. Glucose metabolism in NSCLC is histology-specific and diverges the prognostic potential of 18FDG-PET for adenocarcinoma and squamous cell carcinoma. J Thorac Oncol. 2014; 9:1485–93. https://doi.org/10.1097/JTO.0000000000000286.
108. Ilie MI, Hofman V, Ortholan C, Ammadi RE, Bonnetaud C, Havet K, Venissac N, Mouroux J, Mazure NM, Pouysségur J, Hofman P. Overexpression of carbonic anhydrase XII in tissues from resectable non-small cell lung cancers is a biomarker of good prognosis. Int J Cancer. 2011; 128:1614–23. https://doi.org/10.1002/ijc.25491.
109. Fukuyama T, Hanagiri T, Takenoyama M, Ichiki Y, Mizukami M, So T, Sugaya M, So T, Sugio K, Yasumoto K. Identification of a new cancer/germline gene, KK-LC-1, encoding an antigen recognized by autologous CTL induced on human lung adenocarcinoma. Cancer Res. 2006; 66:4922–28. https://doi.org/10.1158/0008-5472.CAN-05-3840.
110. Baba T, Shiota H, Kuroda K, Shigematsu Y, Ichiki Y, Uramoto H, Hanagiri T, Tanaka F. Cancer/testis antigen expression as a predictor for epidermal growth factor receptor mutation and prognosis in lung adenocarcinoma. Eur J Cardiothorac Surg. 2013; 43:759–64. https://doi.org/10.1093/ejcts/ezs426.
111. Shigematsu Y, Hanagiri T, Shiota H, Kuroda K, Baba T, Mizukami M, So T, Ichiki Y, Yasuda M, So T, Takenoyama M, Yasumoto K. Clinical significance of cancer/testis antigens expression in patients with non-small cell lung cancer. Lung Cancer. 2010; 68:105–10. https://doi.org/10.1016/j.lungcan.2009.05.010.
112. Yao J, Caballero OL, Yung WK, Weinstein JN, Riggins GJ, Strausberg RL, Zhao Q. Tumor subtype-specific cancer-testis antigens as potential biomarkers and immunotherapeutic targets for cancers. Cancer Immunol Res. 2014; 2:371–79. https://doi.org/10.1158/2326-6066.CIR-13-0088.
113. Hanagiri T, Shigematsu Y, Shinohara S, Takenaka M, Oka S, Chikaishi Y, Nagata Y, Baba T, Uramoto H, So T, Yamada S. Clinical significance of expression of cancer/testis antigen and down-regulation of HLA class-I in patients with stage I non-small cell lung cancer. Anticancer Res. 2013; 33:2123–28.
114. Savci-Heijink CD, Kosari F, Aubry MC, Caron BL, Sun Z, Yang P, Vasmatzis G. The role of desmoglein-3 in the diagnosis of squamous cell carcinoma of the lung. Am J Pathol. 2009; 174:1629–37. https://doi.org/10.2353/ajpath.2009.080778.
115. Fukuoka J, Dracheva T, Shih JH, Hewitt SM, Fujii T, Kishor A, Mann F, Shilo K, Franks TJ, Travis WD, Jen J. Desmoglein 3 as a prognostic factor in lung cancer. Hum Pathol. 2007; 38:276–83. https://doi.org/10.1016/j.humpath.2006.08.006.
116. Sanchez-Palencia A, Gomez-Morales M, Gomez-Capilla JA, Pedraza V, Boyero L, Rosell R, Fárez-Vidal ME. Gene expression profiling reveals novel biomarkers in nonsmall cell lung cancer. Int J Cancer. 2011; 129:355–64. https://doi.org/10.1002/ijc.25704.
117. Glatt S, Halbauer D, Heindl S, Wernitznig A, Kozina D, Su KC, Puri C, Garin-Chesa P, Sommergruber W. hGPR87 contributes to viability of human tumor cells. Int J Cancer. 2008; 122:2008–16. https://doi.org/10.1002/ijc.23349.
118. Heighway J, Knapp T, Boyce L, Brennand S, Field JK, Betticher DC, Ratschiller D, Gugger M, Donovan M, Lasek A, Rickert P. Expression profiling of primary non-small cell lung cancer for target identification. Oncogene. 2002; 21:7749–63. https://doi.org/10.1038/sj.onc.1205979.
119. Nii K, Tokunaga Y, Liu D, Zhang X, Nakano J, Ishikawa S, Kakehi Y, Haba R, Yokomise H. Overexpression of G protein-coupled receptor 87 correlates with poorer tumor differentiation and higher tumor proliferation in non-small-cell lung cancer. Mol Clin Oncol. 2014; 2:539–44.
120. Würfel J, Seiter S, Stassar M, Claas A, Kläs R, Rösel M, Marhaba R, Savelyeva L, Schwab M, Matzku S, Zöller M. Cloning of the human homologue of the metastasis-associated rat C4.4A. Gene. 2001; 262:35–41. https://doi.org/10.1016/S0378-1119(00)00515-1.
121. Jacobsen B, Ploug M. The urokinase receptor and its structural homologue C4.4A in human cancer: expression, prognosis and pharmacological inhibition. Curr Med Chem. 2008; 15:2559–73. https://doi.org/10.2174/092986708785909012.
122. Hansen LV, Skov BG, Ploug M, Pappot H. Tumour cell expression of C4.4A, a structural homologue of the urokinase receptor, correlates with poor prognosis in non-small cell lung cancer. Lung Cancer. 2007; 58:260–66. https://doi.org/10.1016/j.lungcan.2007.06.025.
123. Jacobsen B, Santoni-Rugiu E, Illemann M, Kriegbaum MC, Laerum OD, Ploug M. Expression of C4.4A in precursor lesions of pulmonary adenocarcinoma and squamous cell carcinoma. Int J Cancer. 2012; 130:2734–39. https://doi.org/10.1002/ijc.26305.
124. Jacobsen B, Muley T, Meister M, Dienemann H, Christensen IJ, Santoni-Rugiu E, Lærum OD, Ploug M. Ly6/uPAR-related protein C4.4A as a marker of solid growth pattern and poor prognosis in lung adenocarcinoma. J Thorac Oncol. 2013; 8:152–60. https://doi.org/10.1097/JTO.0b013e318279d503.
125. Willuda J, Linden L, Lerchen HG, Kopitz C, Stelte-Ludwig B, Pena C, Lange C, Golfier S, Kneip C, Carrigan PE, Mclean K, Schuhmacher J, von Ahsen O, et al. Preclinical Antitumor Efficacy of BAY 1129980-a Novel Auristatin-Based Anti-C4.4A (LYPD3) Antibody-Drug Conjugate for the Treatment of Non-Small Cell Lung Cancer. Mol Cancer Ther. 2017; 16:893–904. https://doi.org/10.1158/1535-7163.MCT-16-0474.
126. Sun YB, Xu S. Expression of KISS1 and KISS1R (GPR54) may be used as favorable prognostic markers for patients with non-small cell lung cancer. Int J Oncol. 2013; 43:521–30. https://doi.org/10.3892/ijo.2013.1967.
127. Wang X, Zhang Y, Nilsson CL, Berven FS, Andrén PE, Carlsohn E, Horvatovich P, Malm J, Fuentes M, Végvári Á, Welinder C, Fehniger TE, Rezeli M, et al. Association of chromosome 19 to lung cancer genotypes and phenotypes. Cancer Metastasis Rev. 2015; 34:217–26. https://doi.org/10.1007/s10555-015-9556-2.
128. Xu L, Josan JS, Vagner J, Caplan MR, Hruby VJ, Mash EA, Lynch RM, Morse DL, Gillies RJ. Heterobivalent ligands target cell-surface receptor combinations in vivo. Proc Natl Acad Sci USA. 2012; 109:21295–300. https://doi.org/10.1073/pnas.1211762109.
129. Edgar R, Domrachev M, Lash AE. Gene Expression Omnibus: NCBI gene expression and hybridization array data repository. Nucleic Acids Res. 2002; 30:207–10. https://doi.org/10.1093/nar/30.1.207.
130. Welsh EA, Eschrich SA, Berglund AE, Fenstermacher DA. Iterative rank-order normalization of gene expression microarray data. BMC Bioinformatics. 2013; 14:153. https://doi.org/10.1186/1471-2105-14-153.
131. Consortium TG, and Gene Ontology Consortium. Gene Ontology Consortium: going forward. Nucleic Acids Res. 2015; 43:D1049–56. https://doi.org/10.1093/nar/gku1179.
132. Barretina J, Caponigro G, Stransky N, Venkatesan K, Margolin AA, Kim S, Wilson CJ, Lehár J, Kryukov GV, Sonkin D, Reddy A, Liu M, Murray L, et al. The Cancer Cell Line Encyclopedia enables predictive modelling of anticancer drug sensitivity. Nature. 2012; 483:603–07. https://doi.org/10.1038/nature11003.
133. Johnson WE, Li C, Rabinovic A. Adjusting batch effects in microarray expression data using empirical Bayes methods. Biostatistics. 2007; 8:118–27. https://doi.org/10.1093/biostatistics/kxj037.
134. Fenstermacher DA, Wenham RM, Rollison DE, Dalton WS. Implementing personalized medicine in a cancer center. Cancer J. 2011; 17:528–36. https://doi.org/10.1097/PPO.0b013e318238216e.
135. Schabath MB, Welsh EA, Fulp WJ, Chen L, Teer JK, Thompson ZJ, Engel BE, Xie M, Berglund AE, Creelan BC, Antonia SJ, Gray JE, Eschrich SA, et al. Differential association of STK11 and TP53 with KRAS mutation-associated gene expression, proliferation and immune surveillance in lung adenocarcinoma. Oncogene. 2016; 35:3209–16. https://doi.org/10.1038/onc.2015.375.
136. van Putten W. CART: Stata module to perform Classification And Regression Tree analysis. Boston College Department of Economics; 2006.
137. Pastoreková S, Parkkila S, Parkkila AK, Opavský R, Zelník V, Saarnio J, Pastorek J. Carbonic anhydrase IX, MN/CA IX: analysis of stomach complementary DNA sequence and expression in human and rat alimentary tracts. Gastroenterology. 1997; 112:398–408. https://doi.org/10.1053/gast.1997.v112.pm9024293.
138. Saarnio J, Parkkila S, Parkkila AK, Waheed A, Casey MC, Zhou XY, Pastoreková S, Pastorek J, Karttunen T, Haukipuro K, Kairaluoma MI, Sly WS. Immunohistochemistry of carbonic anhydrase isozyme IX (MN/CA IX) in human gut reveals polarized expression in the epithelial cells with the highest proliferative capacity. J Histochem Cytochem. 1998; 46:497–504. https://doi.org/10.1177/002215549804600409.
139. Ramsey ML, Yuh BJ, Johnson MT, Yeldandi AV, Zynger DL. Carbonic anhydrase IX is expressed in mesothelioma and metastatic clear cell renal cell carcinoma of the lung. Virchows Arch. 2012; 460:89–93. https://doi.org/10.1007/s00428-011-1178-7.
140. Türeci O, Sahin U, Vollmar E, Siemer S, Göttert E, Seitz G, Parkkila AK, Shah GN, Grubb JH, Pfreundschuh M, Sly WS. Human carbonic anhydrase XII: cDNA cloning, expression, and chromosomal localization of a carbonic anhydrase gene that is overexpressed in some renal cell cancers. Proc Natl Acad Sci USA. 1998; 95:7608–13. https://doi.org/10.1073/pnas.95.13.7608.
141. Parkkila S, Parkkila AK, Saarnio J, Kivelä J, Karttunen TJ, Kaunisto K, Waheed A, Sly WS, Türeci O, Virtanen I, Rajaniemi H. Expression of the membrane-associated carbonic anhydrase isozyme XII in the human kidney and renal tumors. J Histochem Cytochem. 2000; 48:1601–08. https://doi.org/10.1177/002215540004801203.
142. Karhumaa P, Parkkila S, Türeci O, Waheed A, Grubb JH, Shah G, Parkkila A, Kaunisto K, Tapanainen J, Sly WS, Rajaniemi H. Identification of carbonic anhydrase XII as the membrane isozyme expressed in the normal human endometrial epithelium. Mol Hum Reprod. 2000; 6:68–74. https://doi.org/10.1093/molehr/6.1.68.
143. Kivelä A, Parkkila S, Saarnio J, Karttunen TJ, Kivelä J, Parkkila AK, Waheed A, Sly WS, Grubb JH, Shah G, Türeci O, Rajaniemi H. Expression of a novel transmembrane carbonic anhydrase isozyme XII in normal human gut and colorectal tumors. Am J Pathol. 2000; 156:577–84. https://doi.org/10.1016/S0002-9440(10)64762-1.
144. Amagai M, Klaus-Kovtun V, Stanley JR. Autoantibodies against a novel epithelial cadherin in pemphigus vulgaris, a disease of cell adhesion. Cell. 1991; 67:869–77. https://doi.org/10.1016/0092-8674(91)90360-B.
145. Gómez-Morales M, Cámara-Pulido M, Miranda-León MT, Sánchez-Palencia A, Boyero L, Gómez-Capilla JA, Fárez-Vidal ME. Differential immunohistochemical localization of desmosomal plaque-related proteins in non-small-cell lung cancer. Histopathology. 2013; 63:103–13. https://doi.org/10.1111/his.12126.
146. Saaber F, Chen Y, Cui T, Yang L, Mireskandari M, Peterson I. Expression of desmogleins 1-3 and their clinical impacts on human lung cancer. Pathol Res Pract. 2015; 211:208-13.
147. Zhan C, Yan L, Wang L, Sun Y, Wang X, Lin Z, Zhang Y, Shi Y, Jiang W, Wang Q. Identification of immunohistochemical markers for distinguishing lung adenocarcinoma from squamous cell carcinoma. J Thorac Dis. 2015; 7:1398–405.
148. Katoh Y, Katoh M. Comparative integromics on FAT1, FAT2, FAT3 and FAT4. Int J Mol Med. 2006; 18:523–28.
149. Nakayama M, Nakajima D, Yoshimura R, Endo Y, Ohara O. MEGF1/fat2 proteins containing extraordinarily large extracellular domains are localized to thin parallel fibers of cerebellar granule cells. Mol Cell Neurosci. 2002; 20:563–78. https://doi.org/10.1006/mcne.2002.1146.
150. Sadeqzadeh E, de Bock CE, Thorne RF. Sleeping Giants: Emerging Roles for the Fat Cadherins in Health and Disease. Med Res Rev. 2014; 34:190-221.
151. Matsui S, Utani A, Takahashi K, Mukoyama Y, Miyachi Y, Matsuyoshi N. Human Fat2 is localized at immature adherens junctions in epidermal keratinocytes. J Dermatol Sci. 2007; 48:233–36. https://doi.org/10.1016/j.jdermsci.2007.07.010.
152. Dang TT, Westcott JM, Maine EA, Kanchwala M, Xing C, Pearson GW. ΔNp63α induces the expression of FAT2 and Slug to promote tumor invasion. Oncotarget. 2016; 7:28592–611. https://doi.org/10.18632/oncotarget.8696.
153. Zhang Y, Scoumanne A, Chen X. G Protein-Coupled Receptor 87: a Promising Opportunity for Cancer Drug Discovery. Mol Cell Pharmacol. 2010; 2:111–16.
154. Park SM, Choi EY, Bae M, Kim S, Park JB, Yoo H, Choi JK, Kim YJ, Lee SH, Kim IH. Histone variant H3F3A promotes lung cancer cell migration through intronic regulation. Nat Commun. 2016; 7:12914. https://doi.org/10.1038/ncomms12914.
155. Muir AI, Chamberlain L, Elshourbagy NA, Michalovich D, Moore DJ, Calamari A, Szekeres PG, Sarau HM, Chambers JK, Murdock P, Steplewski K, Shabon U, Miller JE, et al. AXOR12, a novel human G protein-coupled receptor, activated by the peptide KiSS-1. J Biol Chem. 2001; 276:28969–75. https://doi.org/10.1074/jbc.M102743200.
156. Ji K, Ye L, Mason MD, Jiang WG. The Kiss-1/Kiss-1R complex as a negative regulator of cell motility and cancer metastasis (Review). Int J Mol Med. 2013; 32:747–54. https://doi.org/10.3892/ijmm.2013.1472.
157. Ohtaki T, Shintani Y, Honda S, Matsumoto H, Hori A, Kanehashi K, Terao Y, Kumano S, Takatsu Y, Masuda Y, Ishibashi Y, Watanabe T, Asada M, et al. Metastasis suppressor gene KiSS-1 encodes peptide ligand of a G-protein-coupled receptor. Nature. 2001; 411:613–17. https://doi.org/10.1038/35079135.
158. Kotani M, Detheux M, Vandenbogaerde A, Communi D, Vanderwinden JM, Le Poul E, Brézillon S, Tyldesley R, Suarez-Huerta N, Vandeput F, Blanpain C, Schiffmann SN, Vassart G, et al. The metastasis suppressor gene KiSS-1 encodes kisspeptins, the natural ligands of the orphan G protein-coupled receptor GPR54. J Biol Chem. 2001; 276:34631–36. https://doi.org/10.1074/jbc.M104847200.
159. Cho SG, Li D, Tan K, Siwko SK, Liu M. KiSS1 and its G-protein-coupled receptor GPR54 in cancer development and metastasis. Cancer Metastasis Rev. 2012; 31:585–91. https://doi.org/10.1007/s10555-012-9367-7.
160. Makri A, Pissimissis N, Lembessis P, Polychronakos C, Koutsilieris M. The kisspeptin (KiSS-1)/GPR54 system in cancer biology. Cancer Treat Rev. 2008; 34:682–92. https://doi.org/10.1016/j.ctrv.2008.05.007.
161. Mead EJ, Maguire JJ, Kuc RE, Davenport AP. Kisspeptins: a multifunctional peptide system with a role in reproduction, cancer and the cardiovascular system. Br J Pharmacol. 2007; 151:1143–53. https://doi.org/10.1038/sj.bjp.0707295.
162. Nicolle G, Comperat E, Nicolaïew N, Cancel-Tassin G, Cussenot O. Metastin (KISS-1) and metastin-coupled receptor (GPR54) expression in transitional cell carcinoma of the bladder. Ann Oncol. 2007; 18:605–07. https://doi.org/10.1093/annonc/mdl421.
163. Ikeguchi M, Hirooka Y, Kaibara N. Quantitative reverse transcriptase polymerase chain reaction analysis for KiSS-1 and orphan G-protein-coupled receptor (hOT7T175) gene expression in hepatocellular carcinoma. J Cancer Res Clin Oncol. 2003; 129:531–35. https://doi.org/10.1007/s00432-003-0469-z.
164. Schmid K, Wang X, Haitel A, Sieghart W, Peck-Radosavljevic M, Bodingbauer M, Rasoul-Rockenschaub S, Wrba F. KiSS-1 overexpression as an independent prognostic marker in hepatocellular carcinoma: an immunohistochemical study. Virchows Arch. 2007; 450:143–49. https://doi.org/10.1007/s00428-006-0352-9.
165. Lenburg ME, Liou LS, Gerry NP, Frampton GM, Cohen HT, Christman MF. Previously unidentified changes in renal cell carcinoma gene expression identified by parametric analysis of microarray data. BMC Cancer. 2003; 3:31. https://doi.org/10.1186/1471-2407-3-31.
166. Shoji S, Tang XY, Umemura S, Itoh J, Takekoshi S, Shima M, Usui Y, Nagata Y, Uchida T, Osamura RY, Terachi T. Metastin inhibits migration and invasion of renal cell carcinoma with overexpression of metastin receptor. Eur Urol. 2009; 55:441–49. https://doi.org/10.1016/j.eururo.2008.02.048.
167. Chen Y, Yusenko MV, Kovacs G. Lack of KISS1R expression is associated with rapid progression of conventional renal cell carcinomas. J Pathol. 2011; 223:46–53. https://doi.org/10.1002/path.2764.
168. Ringel MD, Hardy E, Bernet VJ, Burch HB, Schuppert F, Burman KD, Saji M. Metastin receptor is overexpressed in papillary thyroid cancer and activates MAP kinase in thyroid cancer cells. J Clin Endocrinol Metab. 2002; 87:2399–402. https://doi.org/10.1210/jcem.87.5.8626.
169. Ikeguchi M, Yamaguchi K, Kaibara N. Clinical significance of the loss of KiSS-1 and orphan G-protein-coupled receptor (hOT7T175) gene expression in esophageal squamous cell carcinoma. Clin Cancer Res. 2004; 10:1379–83. https://doi.org/10.1158/1078-0432.CCR-1519-02.
170. Wang H, Jones J, Turner T, He QP, Hardy S, Grizzle WE, Welch DR, Yates C. Clinical and biological significance of KISS1 expression in prostate cancer. Am J Pathol. 2012; 180:1170–78. https://doi.org/10.1016/j.ajpath.2011.11.020.
171. Hansen LV, Gårdsvoll H, Nielsen BS, Lund LR, Danø K, Jensen ON, Ploug M. Structural analysis and tissue localization of human C4.4A: a protein homologue of the urokinase receptor. Biochem J. 2004; 380:845–57. https://doi.org/10.1042/bj20031478.
172. Jacobsen B, Kriegbaum MC, Santoni-Rugiu E, Ploug M. C4.4A as a biomarker in pulmonary adenocarcinoma and squamous cell carcinoma. World J Clin Oncol. 2014; 5:621–32. https://doi.org/10.5306/wjco.v5.i4.621.
173. Fletcher GC, Patel S, Tyson K, Adam PJ, Schenker M, Loader JA, Daviet L, Legrain P, Parekh R, Harris AL, Terrett JA. hAG-2 and hAG-3, human homologues of genes involved in differentiation, are associated with oestrogen receptor-positive breast tumours and interact with metastasis gene C4.4a and dystroglycan. Br J Cancer. 2003; 88:579–85. https://doi.org/10.1038/sj.bjc.6600740.
174. Miyake T, Ito T, Yanai A, Inoue N, Miyagawa Y, Murase K, Imamura M, Ichii S, Takatsuka Y, Nishizaki T, Hirota S, Ohtsuka M, Yamamoto H, et al. C4.4A highly expressed in HER2-positive human breast cancers may indicate a good prognosis. Breast Cancer. 2015; 22:366–73. https://doi.org/10.1007/s12282-013-0487-x.
175. Paret C, Hildebrand D, Weitz J, Kopp-Schneider A, Kuhn A, Beer A, Hautmann R, Zöller M. C4.4A as a candidate marker in the diagnosis of colorectal cancer. Br J Cancer. 2007; 97:1146–56. https://doi.org/10.1038/sj.bjc.6604012.
176. Konishi K, Yamamoto H, Mimori K, Takemasa I, Mizushima T, Ikeda M, Sekimoto M, Matsuura N, Takao T, Doki Y, Mori M. Expression of C4.4A at the invasive front is a novel prognostic marker for disease recurrence of colorectal cancer. Cancer Sci. 2010; 101:2269–77. https://doi.org/10.1111/j.1349-7006.2010.01674.x.
177. Oshiro R, Yamamoto H, Takahashi H, Ohtsuka M, Wu X, Nishimura J, Takemasa I, Mizushima T, Ikeda M, Sekimoto M, Matsuura N, Doki Y, Mori M. C4.4A is associated with tumor budding and epithelial-mesenchymal transition of colorectal cancer. Cancer Sci. 2012; 103:1155–64. https://doi.org/10.1111/j.1349-7006.2012.02263.x.
178. Cheng DQ, Gu XD, Li ZY, Xiang JB, Chen ZY. Expression of C4.4A is a potential independent prognostic factor for patients with gastric cancer. Asian Pac J Cancer Prev. 2014; 15:3895–99. https://doi.org/10.7314/APJCP.2014.15.9.3895.
179. Seiter S, Stassar M, Rappl G, Reinhold U, Tilgen W, Zöller M. Upregulation of C4.4A expression during progression of melanoma. J Invest Dermatol. 2001; 116:344–47. https://doi.org/10.1046/j.1523-1747.2001.01230.x.
180. Smith BA, Kennedy WJ, Harnden P, Selby PJ, Trejdosiewicz LK, Southgate J. Identification of genes involved in human urothelial cell-matrix interactions: implications for the progression pathways of malignant urothelium. Cancer Res. 2001; 61:1678–85.
181. Sato H, Tamba M, Ishii T, Bannai S. Cloning and expression of a plasma membrane cystine/glutamate exchange transporter composed of two distinct proteins. J Biol Chem. 1999; 274:11455–58. https://doi.org/10.1074/jbc.274.17.11455.
182. Bassi MT, Gasol E, Manzoni M, Pineda M, Riboni M, Martín R, Zorzano A, Borsani G, Palacín M. Identification and characterisation of human xCT that co-expresses, with 4F2 heavy chain, the amino acid transport activity system xc-. Pflugers Arch. 2001; 442:286–96. https://doi.org/10.1007/s004240100537.
183. Lewerenz J, Hewett SJ, Huang Y, Lambros M, Gout PW, Kalivas PW, Massie A, Smolders I, Methner A, Pergande M, Smith SB, Ganapathy V, Maher P. The cystine/glutamate antiporter system x(c)(-) in health and disease: from molecular mechanisms to novel therapeutic opportunities. Antioxid Redox Signal. 2013; 18:522–55. https://doi.org/10.1089/ars.2011.4391.
184. Lo M, Wang YZ, Gout PW. The x(c)- cystine/glutamate antiporter: a potential target for therapy of cancer and other diseases. J Cell Physiol. 2008; 215:593–602. https://doi.org/10.1002/jcp.21366.
185. Burdo J, Dargusch R, Schubert D. Distribution of the cystine/glutamate antiporter system xc- in the brain, kidney, and duodenum. J Histochem Cytochem. 2006; 54:549–57. https://doi.org/10.1369/jhc.5A6840.2006.
186. Kim JY, Kanai Y, Chairoungdua A, Cha SH, Matsuo H, Kim DK, Inatomi J, Sawa H, Ida Y, Endou H. Human cystine/glutamate transporter: cDNA cloning and upregulation by oxidative stress in glioma cells. Biochim Biophys Acta. 2001; 1512:335–44. https://doi.org/10.1016/S0005-2736(01)00338-8.
187. Kinoshita H, Okabe H, Beppu T, Chikamoto A, Hayashi H, Imai K, Mima K, Nakagawa S, Ishimoto T, Miyake K, Yokoyama N, Ishiko T, Baba H. Cystine/glutamic acid transporter is a novel marker for predicting poor survival in patients with hepatocellular carcinoma. Oncol Rep. 2013; 29:685–89. https://doi.org/10.3892/or.2012.2162.
188. Choi SY, Bertram S, Glowacka I, Park YW, Pöhlmann S. Type II transmembrane serine proteases in cancer and viral infections. Trends Mol Med. 2009; 15:303–12. https://doi.org/10.1016/j.molmed.2009.05.003.
189. Szabo R, Bugge TH. Type II transmembrane serine proteases in development and disease. Int J Biochem Cell Biol. 2008; 40:1297–316. https://doi.org/10.1016/j.biocel.2007.11.013.
190. Ohler A, Becker-Pauly C. TMPRSS4 is a type II transmembrane serine protease involved in cancer and viral infections. Biol Chem. 2012; 393:907–14. https://doi.org/10.1515/hsz-2012-0155.
191. Wallrapp C, Hähnel S, Müller-Pillasch F, Burghardt B, Iwamura T, Ruthenbürger M, Lerch MM, Adler G, Gress TM. A novel transmembrane serine protease (TMPRSS3) overexpressed in pancreatic cancer. Cancer Res. 2000; 60:2602–06.
192. Jung H, Lee KP, Park SJ, Park JH, Jang YS, Choi SY, Jung JG, Jo K, Park DY, Yoon JH, Park JH, Lim DS, Hong GR, et al. TMPRSS4 promotes invasion, migration and metastasis of human tumor cells by facilitating an epithelial-mesenchymal transition. Oncogene. 2008; 27:2635–47. https://doi.org/10.1038/sj.onc.1210914.
193. Nguyen TH, Weber W, Havari E, Connors T, Bagley RG, McLaren R, Nambiar PR, Madden SL, Teicher BA, Roberts B, Kaplan J, Shankara S. Expression of TMPRSS4 in non-small cell lung cancer and its modulation by hypoxia. Int J Oncol. 2012; 41:829–38. https://doi.org/10.3892/ijo.2012.1513.
194. Kebebew E, Peng M, Reiff E, Duh QY, Clark OH, McMillan A. ECM1 and TMPRSS4 are diagnostic markers of malignant thyroid neoplasms and improve the accuracy of fine needle aspiration biopsy. Ann Surg. 2005; 242:353–61.
195. Kim S, Kang HY, Nam EH, Choi MS, Zhao XF, Hong CS, Lee JW, Lee JH, Park YK. TMPRSS4 induces invasion and epithelial-mesenchymal transition through upregulation of integrin alpha5 and its signaling pathways. Carcinogenesis. 2010; 31:597–606. https://doi.org/10.1093/carcin/bgq024.
196. Larzabal L, Nguewa PA, Pio R, Blanco D, Sanchez B, Rodríguez MJ, Pajares MJ, Catena R, Montuenga LM, Calvo A. Overexpression of TMPRSS4 in non-small cell lung cancer is associated with poor prognosis in patients with squamous histology. Br J Cancer. 2011; 105:1608–14. https://doi.org/10.1038/bjc.2011.432.
197. Liang B, Wu M, Bu Y, Zhao A, Xie F. Prognostic value of TMPRSS4 expression in patients with breast cancer. Med Oncol. 2013; 30:497. https://doi.org/10.1007/s12032-013-0497-8.
198. Cheng D, Liang B, Li Y. High TMPRSS4 expression is a predictor of poor prognosis in cervical squamous cell carcinoma. Cancer Epidemiol. 2013; 37:993–97. https://doi.org/10.1016/j.canep.2013.08.009.
199. Wu XY, Zhang L, Zhang KM, Zhang MH, Ruan TY, Liu CY, Xu JY. Clinical implication of TMPRSS4 expression in human gallbladder cancer. Tumour Biol. 2014; 35:5481–86. https://doi.org/10.1007/s13277-014-1716-4.
200. Sheng H, Shen W, Zeng J, Xi L, Deng L. Prognostic significance of TMPRSS4 in gastric cancer. Neoplasma. 2014; 61:213–17. https://doi.org/10.4149/neo_2014_027.
201. de Aberasturi AL, Calvo A. TMPRSS4: an emerging potential therapeutic target in cancer. Br J Cancer. 2015; 112:4–8. https://doi.org/10.1038/bjc.2014.403.
202. Wang CH, Guo ZY, Chen ZT, Zhi XT, Li DK, Dong ZR, Chen ZQ, Hu SY, Li T. TMPRSS4 facilitates epithelial-mesenchymal transition of hepatocellular carcinoma and is a predictive marker for poor prognosis of patients after curative resection. Sci Rep. 2015; 5:12366. https://doi.org/10.1038/srep12366.
203. Hamamoto J, Soejima K, Naoki K, Yasuda H, Hayashi Y, Yoda S, Nakayama S, Satomi R, Terai H, Ikemura S, Sato T, Arai D, Ishioka K, et al. Methylation-induced downregulation of TFPI-2 causes TMPRSS4 overexpression and contributes to oncogenesis in a subset of non-small-cell lung carcinoma. Cancer Sci. 2015; 106:34–42.
204. de Aberasturi AL, Redrado M, Villalba M, Larzabal L, Pajares MJ, Garcia J, Evans SR, Garcia-Ros D, Bodegas ME, Lopez L, Montuenga L, Calvo A. TMPRSS4 induces cancer stem cell-like properties in lung cancer cells and correlates with ALDH expression in NSCLC patients. Cancer Lett. 2016; 370:165–76. https://doi.org/10.1016/j.canlet.2015.10.012.
205. Villalba M, Diaz-Lagares A, Redrado M, de Aberasturi AL, Segura V, Bodegas ME, Pajares MJ, Pio R, Freire J, Gomez-Roman J, Montuenga LM, Esteller M, Sandoval J, et al. Epigenetic alterations leading to TMPRSS4 promoter hypomethylation and protein overexpression predict poor prognosis in squamous lung cancer patients. Oncotarget. 2016; 7:22752–69. https://doi.org/10.18632/oncotarget.8045.
206. Villalba M, Lopez L, Redrado M, Ruiz T, de Aberasturi AL, de la Roja N, Garcia D, Exposito F, de Andrea C, Alvarez-Fernandez E, Montuenga L, Rueda P, Rodriguez MJ, et al. Development of biological tools to assess the role of TMPRSS4 and identification of novel tumor types with high expression of this prometastatic protein. Histol Histopathol. 2017; 32:929–940.
207. Chikaishi Y, Uramoto H, Koyanagi Y, Yamada S, Yano S, Tanaka F. TMPRSS4 Expression as a Marker of Recurrence in Patients with Lung Cancer. Anticancer Res. 2016; 36:121–27.