
INTRODUCTION
Ovarian cancer is the leading cause of death among gynecological cancers with an average 5-year survival rate of only 46% [1]. The standard of care (SOC) for ovarian cancer is surgery followed by chemotherapy with a combination of a platinum agent (carboplatin or cisplatin) and a taxane (paclitaxel or docetaxel). Even though the majority (about 80%) of ovarian cancer patients respond to the initial chemotherapy, around 20% patients fail to respond. In addition, more than half of initial responders relapse within 3 to 5 years [2, 3]. Therefore, the identification and development of effective drugs against chemoresistant ovarian tumors is of great importance.
Several compounds have been examined to overcome chemoresistance in ovarian cancer based on known biology [4-8]. In addition, high throughput drug screening has been conducted in large variety of cancer cell lines [9-11]. However, efforts to adapt the high throughput drug screening results in order to overcome ovarian chemoresistance have not been reported. To this end, our lab has previously developed pRRophetic, a transcriptome based drug sensitivity prediction tool, which relates cell line drug sensitivity screening datasets with the corresponding cell line transcriptome data to predict in vivo drug IC50s with great accuracy [12, 13].
In this study, to leverage the predictive power of pRRophetic, we applied it to impute drug sensitivity in the Cancer Genome Atlas (TCGA) ovarian cancer dataset. The rich molecular profiles available in over 500 high-grade serous ovarian cancer (HGSOC) made TCGA ovarian cancer dataset an optimal dataset to comprehensively examine the molecular landscape of ovarian cancer. However, one drawback of the TCGA data is the lack of clearly reported drug sensitivity data. Our work therefore filled this gap by applying drug prediction methods to TCGA in order to generate predicted drug IC50 for every ovarian tumor sample.
More importantly, given that both the SOC and drugs that have never been used in treating ovarian cancer have been screened in vitro, this allowed us to generate predicted in vivo drug sensitivity to a wide range of drugs. By stratifying patients based on their likelihood of responding to SOC chemotherapy, we revealed several drugs that can be more efficacious in tumors that are resistant to SOC. Additionally, in vitro and in independent clinical sample validations were carried out to confirm the role of these agents.
RESULTS
Predicting drug sensitivities in ovarian tumors based on their transcriptome profiles
Using pRRophetic, we generated 1,773 predicted drug IC50s for all tumors in TCGA ovarian cancer datasets (see Methods; 138 drugs × 598 unique tumor samples). Separate predictions were generated using each of the 4 different transcriptome profiling platforms, including 520 samples for Affymetrix microarray, 574 samples for Agilent microarray, 413 for RNA-Seq, and 266 for RNA-Seq V2 (samples were overlapped among 4 platforms). A high predicted drug IC50 represented less sensitive/potential resistance, and conversely a low predicted drug IC50 suggested sensitivity.
As a proof-of-concept, we compared our predicted drug IC50s to the patient outcome data (survival) available through TCGA. Here, because of the lack of drug treatment response reported in TCGA, the survival data was used as a surrogate for the measured drug response phenotype. When evaluating predicted vs. actual drug sensitivity (quantified as alive or dead after a given treatment), we observed that in the ovarian cancer patients who were treated with paclitaxel, the predicted drug IC50s for paclitaxel were correlated with the patients’ survival outcomes (Figure 1, Student’s t-test P=0.032, Wilcoxon rank-sum test P<0.0001). When a tumor is predicted to be more sensitive to the drug (i.e., a lower predicted IC50 values), the patient is more likely to be alive. These correlation trends between predicted and observed drug sensitivity were also observed for docetaxel and cisplatin, although not statistically significant. Note that only a subset of TCGA ovarian cancer samples contain treatment information with the highest numbers of patients treated with paclitaxel (n=469). Given ovarian cancer survival is highly correlated with disease stages, we also fitted a regression model between survival and predicted paclitaxel sensitivity controlling for disease stage. Once again, we observed a significant correlation between the predicted paclitaxel IC50 and the survival outcomes of those patients underwent paclitaxel treatment (P=0.0385). Only 112 and 154 patients were known to be treated with docetaxel and cisplatin, respectively, suggesting that we may be underpowered to observe such an association for these other drugs.

Figure 1: Predicted paclitaxel IC50s are correlated with the patients’ survival outcomes (Student’s t-test P=0.032). Predicted drug IC50 is lower (more sensitive to paclitaxel) in alive group.
Identify drug candidates that may work in the SOC resistant ovarian tumors
For every tumor sample, we averaged the predicted drug IC50 of cisplatin and docetaxel, the current SOC, as an indicator of individual tumor sensitivity to SOC (See blue line in Figure 2). Given 80% SOC response rate was well documented by literature [2, 3], we stratified the 20% tumor with higher predicted SOC IC50 as SOC non-responders (Figure 2). We then performed a Student’s t-test for predicted drug IC50 for all other drugs between SOC responders and non-responders. Only those drugs that showed lower predicted IC50 in SOC non-responders groups than SOC responders (P<0.05) were further evaluated.
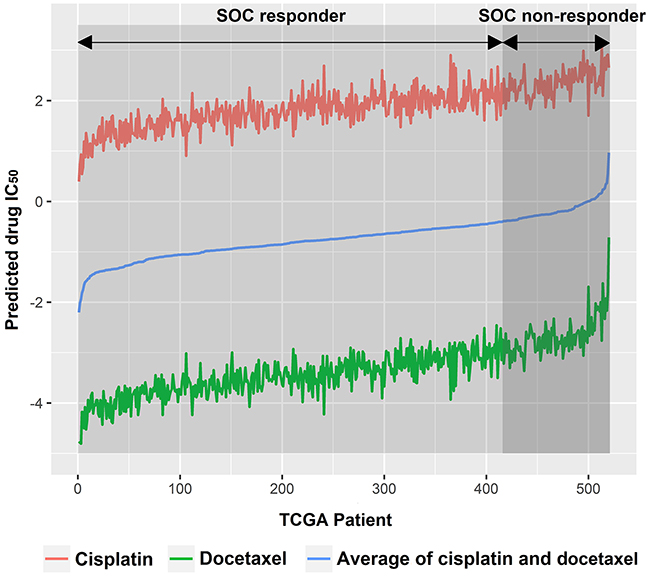
Figure 2: TCGA ovarian cancer patients were subgrouped into SOC responders and SOC non-responders. SOC, standard of care.
Each of the 4 transcriptome profiles for these samples were analyzed separately to generate predicted drug IC50s. Therefore, four sets of candidate drugs were identified using each transcriptome profiling dataset. Specifically, we identified 13, 17, 18 and 12 drugs with the Affymetrix arrays, Agilent arrays, RNA-Seq, and RNA-Seq V2 datasets, respectively. (Details about these drug candidates identified from each platform can be found in Supplementary Table 1). Among them, 5 drugs were identified in all four datasets. They were ABT-888, BIBW2992, gefitinib, AZD6244, and lenalidomide (Table 1). For each candidate drug, the average predicted drug IC50 in SOC sensitive and resistant group were reported in Table 1. All 5 candidate drugs had significantly lower predicted drug IC50 (suggesting more sensitive) in the SOC resistant group than those in SOC sensitive group (P<0.05, two-tailed Student’s t-test). Significant negative Pearson correlations were shown in Figure 3 between ABT-888 (R= -0.164, P= 0.0002), or BIBW2992 (R= -0.148, P= 0.0007), and SOC when rank order patients based on their predicted sensitivity to these drugs. To ensure the robustness of the results, we also performed Pearson test using the actual predicted drug IC50. Again, significant negative correlations were shown between SOC and ABT-888 (R= -0.222, P<0.0001), or BIBW2992 (R= -0.412, P<0.0001). These inverse correlations for drug response indicated that our candidate drugs were predicted to be more efficacious in SOC resistant patients. Notably, the average predicted drug IC50 of each given drug in the SOC resistant or sensitive groups were very close between different datasets. This suggests that our prediction was highly reproducible even though different technologies were applied to obtain gene expression profiles.
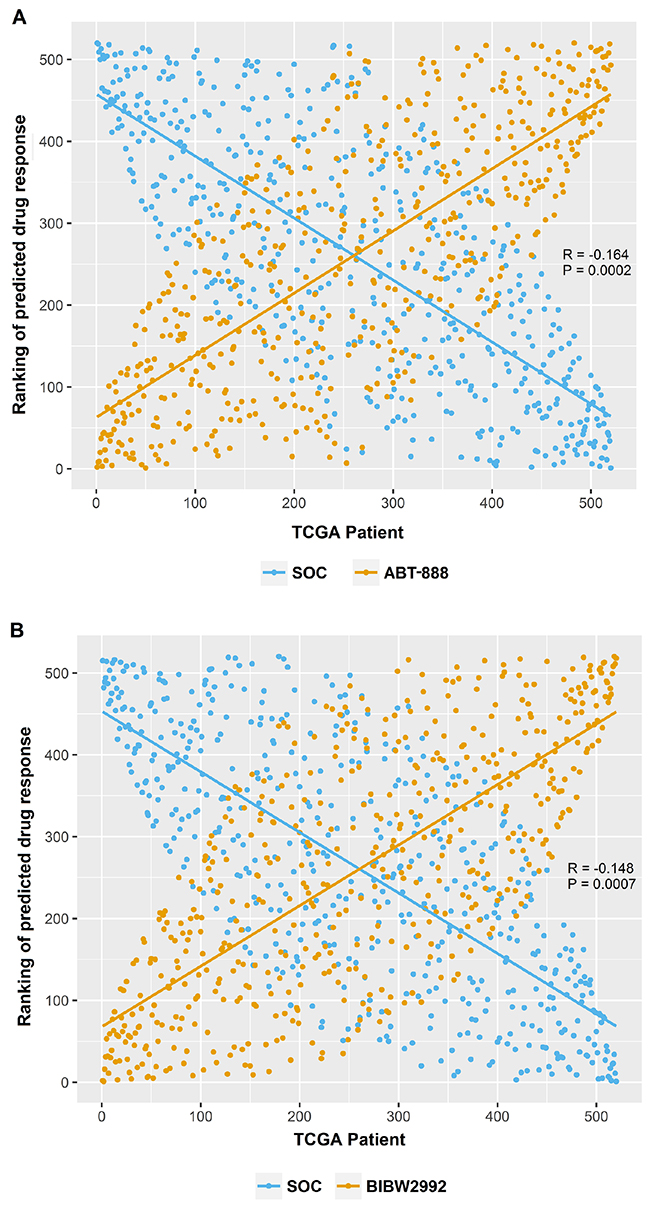
Figure 3: The opposite effect patterns between candidate drugs and SOC. (A) Significant negative Pearson correlation between the ranking of SOC and ABT-888 (Rp= -0.164, Pp= 0.0002). (B) Significant negative Pearson correlation between the ranking of SOC and BIBW2992 (Rp= -0.148, Pp= 0.0007).
Table 1: Summary of the predicted drug IC50 for candidate drugs in SOC responders and non-responders analyzed using different expression profiling platforms
TCGA discovery datasets |
Validation dataset |
||||||||||||||
|---|---|---|---|---|---|---|---|---|---|---|---|---|---|---|---|
Affymetrix |
Agilent |
RNA-Seq |
RNA-Seq V2 |
CTRP v2 |
|||||||||||
Predicted drug IC50 |
Student’s t-test P value |
Predicted drug IC50 |
Student’s t-test P value |
Predicted drug IC50 |
Student’s t-test P value |
Predicted drug IC50 |
Student’s t-test P value |
P value a |
Correlation analysis b |
||||||
SOC Res-ponders |
SOC Non-responders |
SOC Res-ponders |
SOC Non-responders |
SOC Res-ponders |
SOC Non-responders |
SOC Res-ponders |
SOC Non-responders |
Spearman |
Pearson |
||||||
ABT-888 |
5.35 |
5.27 |
3.17x10⁻⁵ |
5.34 |
5.30 |
7.69x10⁻³ |
5.35 |
5.26 |
1.26x10⁻⁴ |
5.35 |
5.25 |
1.17x10⁻³ |
0.011 |
R= -0.119, P= 0.023 |
R= -0.112, P= 0.029 |
BIBW2992 |
2.27 |
2.14 |
7.95x10⁻⁴ |
2.28 |
2.18 |
2.63x10⁻¹¹ |
2.28 |
2.19 |
1.82x10⁻⁷ |
2.28 |
2.19 |
3.57x10⁻⁵ |
0.031 |
R= -0.318, P< 0.0001 |
R= -0.276, P< 0.0001 |
Gefitinib |
2.05 |
1.79 |
8.92x10⁻⁸ |
2.04 |
1.84 |
1.00x10⁻⁶ |
2.03 |
1.90 |
6.62x10⁻³ |
2.05 |
1.85 |
1.02x10⁻³ |
0.383 |
R= -0.302, P< 0.0001 |
R= -0.273, P< 0.0001 |
AZD6244 |
3.05 |
2.73 |
2.73x10⁻⁶ |
3.04 |
2.80 |
3.74x10⁻⁴ |
3.06 |
2.72 |
7.44x10⁻⁶ |
3.07 |
2.68 |
7.77x10⁻⁵ |
0.338 |
R= -0.272, P< 0.0001 |
R= -0.259, P< 0.0001 |
Lenalidomide |
5.40 |
5.30 |
2.71x10⁻⁸ |
5.39 |
5.35 |
1.57x10⁻³ |
5.39 |
5.32 |
1.04x10⁻⁴ |
5.39 |
5.33 |
8.82x10⁻³ |
NA |
R= -0.142, P=0.008 |
R= -0.139, P=0.009 |
a P value was calculated from Student’s t-test by comparing Predicted drug IC50 between SOC responders and non-responders.
b Correlation analysis was performed between predicted SOC IC50 and candidate drug IC50.
Validation
For validation, we applied the same methods to an independent ovarian cancer dataset: the Australian Ovarian Cancer Study (AOCS, n=285). Significant higher predicted sensitivity (lower predicted IC50) in SOC resistant ovarian tumors were confirmed for BIBW2992 (P=0.003) using 80/20 (responder vs. non-responder) cutoff. To test if the results were robust to the choice of cutoff, we stratified SOC sensitivity using the 50/50 predicted SOC IC50 as threshold (50% sensitive and 50% resistant) as well. As a result, all candidate drugs— AZD6244, gefitinib, BIBW2992, lenalidomide and ABT-888, were significantly more sensitive in the SOC resistant tumors (P<0.05). In addition, we performed correlation analysis between predicted SOC and candidate drug IC50. Significant correlations were found for all drugs as ABT-888 (Rs= -0.119, Ps= 0.023, Rp= -0.112, Pp= 0.029), BIBW2992 (Rs= -0.318, Ps< 0.0001, Rp= -0.276, Pp< 0.0001), gefitinib (Rs= -0.302, Ps< 0.0001, Rp= -0.273, Pp< 0.0001), AZD6244 (Rs= -0.272, Ps< 0.0001, Rp= -0.259, Pp< 0.0001), and lenalidomide (Rs= -0.142, Ps=0.008, Rp= -0.139, Pp=0.009).
For in vitro validation, we employed a large scale independent cell line drug sensitivity screening data set – CTRP v2 [14]. In CTRP v2, 4 of the 5 candidate drugs were screened (ABT-888, BIBW2992, gefitinib and AZD6244). The AUCs (area under the dose response curve) were used to define cellular sensitivity to these drugs. Given the small sample size (41 ovarian cancer cell lines in total) in CTRP v2, we stratified 22 cell lines as sensitive to SOC and 19 as resistant based on mean predicted SOC IC50. Then, for the four drugs, differences of AUCs between SOC resistant and sensitive group were analyzed using one-tailed t-test. P-values were presented in Table 1. ABT-888 and BIBW2992 showed significant lower AUC (suggesting higher sensitivity) in SOC resistant group (Figure 4A, P=0.011 for ABT-888; Figure 4B, P=0.031 for BIBW2992). There was no significant difference between the SOC resistant and sensitive groups (P>0.05) for gefitinib and AZD6244.
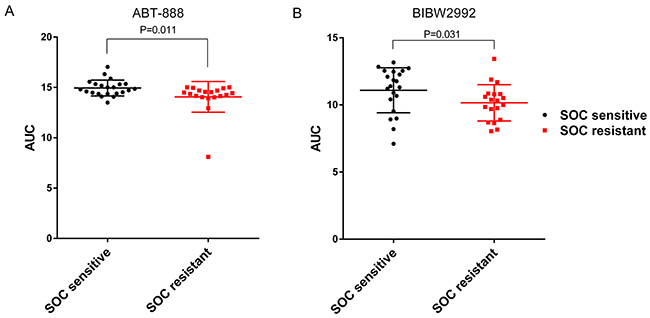
Figure 4: ABT-888 and BIBW2992 are more sensitive in SOC resistant ovarian cancer cell lines tested in CTRP v2. In vitro measured drug sensitivities (AUC) in CTRP v2 are compared between SOC sensitive and resistant cell lines. The higher the AUC, the more resistance the cell line has for a given drug. (A) ABT-888 showed significant lower AUC in SOC resistant group (Student’s t-test P=0.011). (B) BIBW2992 showed significant lower AUC in SOC resistant group (Student’s t-test P=0.031).
Identification of pathways associated with the SOC resistance and candidate drugs sensitivity
To further explore the underlying biology that leads to the effectiveness of the 5 candidate drugs in SOC resistant ovarian tumors, we performed Gene Set Enrichment Analysis (GSEA) using the KEGG pathway gene sets. The pathways listed in the left column of Table 2, were statistically significant positive correlation to SOC sensitivity and negative correlation to sensitivities of the candidate drugs (FDR q-value <0.25). In other words, the enrichment of KEGG pathways we selected could make the tumors more resistant to SOC, at the same time more sensitive to candidate drugs.
Table 2: Summary of enriched KEGG pathways that were significantly correlated with resistance of SOC and sensitiveness of candidate drugs
Positively correlated (desensitize tumor to drug) |
Negatively correlated (sensitize tumor to drug) |
||||||
|---|---|---|---|---|---|---|---|
SOC |
ABT-888 |
BIBW2992 |
Gefitinib |
AZD6244 |
Lenalidomide |
||
Allograft rejection |
0.45 |
-0.861 |
-0.808 |
-0.797 |
-0.755 |
-0.602 |
|
Graft versus host disease |
0.4 |
-0.847 |
-0.827 |
-0.808 |
-0.761 |
-0.542 |
|
Type I diabetes mellitus |
0.389 |
-0.803 |
-0.736 |
-0.774 |
-0.708 |
-0.515 |
|
Antigen processing and presentation |
0.372 |
-0.736 |
-0.68 |
-0.683 |
-0.63 |
-0.453 |
|
RIG I like receptor signaling pathway |
0.364 |
-0.597 |
-0.543 |
-0.453 |
-0.521 |
-0.235 |
|
Autoimmune thyroid disease |
0.354 |
-0.819 |
-0.689 |
-0.742 |
-0.695 |
-0.517 |
|
Apoptosis |
0.311 |
-0.517 |
-0.519 |
-0.488 |
-0.503 |
-0.185 |
|
Asthma |
0.302 |
-0.79 |
-0.72 |
-0.767 |
-0.715 |
-0.414 |
|
Intestinal immune network for IGA production |
0.291 |
-0.795 |
-0.633 |
-0.742 |
-0.66 |
-0.575 |
|
TOLL like receptor signaling pathway |
0.27 |
-0.626 |
-0.539 |
-0.549 |
-0.585 |
-0.22 |
|
Leishmania infection |
0.26 |
-0.712 |
-0.614 |
-0.7 |
-0.661 |
-0.223 |
|
NOD like receptor signaling pathway |
0.232 |
-0.677 |
-0.565 |
-0.586 |
-0.631 |
-0.29 |
|
Cytosolic DNA sensing pathway |
0.216 |
-0.686 |
-0.576 |
-0.538 |
-0.588 |
-0.31 |
|
Natural killer cell mediated cytotoxicity |
0.159 |
-0.668 |
-0.515 |
-0.622 |
-0.611 |
-0.404 |
|
The numbers in this table indicated the Enrichment Score (ESs).
Interestingly, among the pathways that were enriched for SOC resistance and candidate drug sensitivity (Table 2), were the apoptosis and cytosolic DNA sensing pathway. Both apoptosis and cytosolic DNA sensing pathways desensitized tumors to SOC, which was supported by literature [15]. ABT-888, a PARP1/2 inhibitor, plays a role in inhibition of DNA repair and introduction of cell death. Gefitinib and BIBW2992 are both EGFR inhibitors, which could induce apoptosis by inhibition of Ras signaling [16].
DISCUSSION
Taxane and platinum based chemotherapy was introduced 20 years ago to treat ovarian cancer as standard first line regimen. There has been little progress in the last decade to improve the overall survival for chemoresistant ovarian cancer patients. In this study, we applied a novel transcriptome-based drug sensitivity prediction method to a collection of large in vivo and in vitro ovarian cancer datasets. Importantly, we identified five agents—ABT-888, BIBW2992, gefitinib, AZD6244, and lenalidomide that exhibit higher sensitivity in SOC resistant ovarian cancers in multi-platform TCGA datasets. We provided further validation of these drugs’ sensitivity in additional clinical samples derived from ovarian cancer patients (through AOCS) and in vitro (through CTRP v2).
Although survival information has been collected for almost all TCGA samples, the treatment information for each patient is lot sparse, ranging from 40-97% coverage for each disease type to date. Our work bypassed this issue by generating our own in vivo drug sensitivity prediction. This method has been tested previously in silico analysis of 3 independent clinical trials and has demonstrated superior power [12]. Furthermore, in our proof-of-concept analysis, we observed a significant different predicted drug IC50s between dead and alive patients who were treated with paclitaxel. It is ideal to use response to treatment as a phenotype when comparing to our predicted drug IC50; however, since such data is not present, we opted to examine relationship between predicted drug sensitivity and survival outcome as a surrogate for treatment response.
BIBW2992 (afatinib) is an irreversible tyrosine kinase inhibitor (TKI) that inhibits ErbB family members including EGFR, HER2, and HER4. Thereby BIBW2992 can target downstream oncogenic signaling pathways. The mechanism of its anti-cancer activity has been investigated mainly in non-small cell lung cancers (NSCLC) cells. BIBW2992 induces apoptosis by activating pro-apoptotic autophagy or through Elk-1/CIP2A/PP2A/AKT pathway in NSCLC cells [17]. It was approved by the FDA as first-line treatment of EGFR-mutated NSCLC in 2013. A number of clinical trials for various solid tumors including breast, prostate and head and neck cancer also have reported promising outcomes [18-20]. We are unaware of trials of BIBW2992 conducted in ovarian cancer; however, some pre-clinical results indicated encouraging prospects. For example, Wang SQ et al. demonstrated that BIBW2992 reverses multidrug resistance in ovarian cancer cells by dually inhibiting ATP binding cassette subfamily B member 1 [17]. They found BIBW2992 enhanced the paclitaxel-induced apoptosis in vitro and in mouse model, which strongly supports our findings and suggests BIBW2992 may be an effective treatment option for chemoresistant ovarian cancers. Moreover, another group compared multiple HER inhibitors in terms of growth inhibition of ovarian cancer cell lines. Irreversible pan-HER family TKIs including BIBW2992 were more effective than EGFR specific TKIs gefitinib and erlotinib, the dual EGFR/HER-2 TKI lapatinib or the reversible pan EGFR/HER-2/HER-3 TKI sapitinib [21]. Therefore, we propose that BIBW2992 may provide a more effective way to overcome chemoresistance in ovarian tumors.
Impressively, of the 5 drugs we discovered that may be useful in overcoming SOC resistance in ovarian cancer, 4 have had ongoing clinical studies and the preliminary findings suggest the promise/validity of our predictions from pRRophetic. The first in vitro validated candidate drug is ABT-888 (veliparib), a potent inhibitor of PARP1 and PARP2. Poly (ADP-ribose) polymerase (PARP) is essential enzyme involved in damaged DNA detection and repair through the base excision repair pathways. The inhibition of PARP can sensitize tumors to cytotoxic agents by blocking DNA repair, followed by cell cycle arrest and apoptosis, and possibly make tumors more susceptible to DNA-damaging agents including carboplatin [22]. PARP inhibitors have shown preclinical activity in cancers that are deficient in DNA repair due to defects in homologous recombination (HR), eg. BRCA-mutated tumors [23, 24]. PARP inhibitors were initially tested in trials as treatment for BRCA mutation-associated ovarian and breast cancers. The TCGA discovery on the defects in the HR pathway commonly existed in more than 50% of high-grade serous ovarian cancers [25], had led to further investigation of PARP inhibitors in a wider population of ovarian cancers. Olaparib, as the first FDA-approved PARP inhibitor, is used to treat recurrent BRCA mutant ovarian cancer patients. ABT-888 is undergoing a number of clinical trials in combination with SOC, and also as maintenance in the first-line treatment of ovarian cancer. In a single-agent Phase I trial [26] designed for platinum-refractory ovarian or basal-like breast cancers, ABT-888 showed higher response rate and clinical benefit rate in BRCA-mutated tumors than BRCA wild-type tumors. Another single-agent Phase II study [27] in BRCA-mutated ovarian cancer patients has also been reported. ABT-888 was well tolerated with a response rate of 26%. It remains unclear whether PARP inhibitors should be utilized as newly-diagnosed or relapsed patients, single agent or in combination with SOC or as maintenance treatment. Further investigations will help to answer the questions and unveil its full potential as a treatment option.
Gefitinib, a selective epidermal growth factor receptor (EGFR) tyrosine kinase inhibitor, can competitively inhibit ATP binding on EGFR. Gefitinib was approved by the FDA as monotherapy treatment for patients with locally advanced or metastatic non-small cell lung cancer (NSCLC) after failure of both platinum and taxane based chemotherapies [28]. EGFR is commonly present in 33% to 75% of ovarian cancers and increased EGFR is associated with poor survival in ovarian cancer patients [29]. A Phase II trial with gefitinib in combination with paclitaxel and carboplatin as a second-line treatment for advanced ovarian adenocarcinoma, showed a high rate of 63% overall response [30]. Our study provides additional supporting evidence in further pursuing the evaluation of gefitinib in SOC resistant ovarian cancer treatment.
Another example is AZD6244 (selumetinib), a potent, highly selective MEK1/2 inhibitor which also inhibits ERK1/2 phosphorylation. It has reported single agent activity in several trials on solid tumor including recurrent low-grade serous ovarian cancer (LGSOC). A recent phase II AZD6244 trial in LGSOC showed better efficacy than SOC in terms of response rate and disease stabilization [31]. One of the reasons to platinum resistance has been proposed as through the activation of JNK and ERK cascades by cisplatin-induced DNA damage, where JNK and ERK are required for cell proliferation and differentiation. The inhibition of JNK or ERK cascades can sensitize ovarian cancer cells to cisplatin [32]. Therefore, it is not surprising that AZD6244, as an ERK1/2 inhibitor, may promote sensitivity to cisplatin. The findings along with our work warrants further investigation of this drug in ovarian cancer.
Lenalidomide is an antiangiogenic agent, with capability as an immunomodulator, which can inhibit hypoxia-inducible factor (HIF)-1α, an essential regulator of metastasis. Lenalidomide was approved by the FDA in 2006 to treat patients with multiple myeloma in combination with dexamethasone. Its clinical efficacy has also been reported as a single agent and combined with chemotherapy in solid tumors, including ovarian, prostate, renal cell and hepatocellular cancers [33, 34]. Most of the Phase I trials on ovarian cancer showed an acceptable safety profile, while one of them was terminated because of toxicity. Further studies of lenalidomide may be warranted in this disease setting.
Several compounds have been proposed for overcoming ovarian cancer chemoresistance, including bortezomib [4], antiprogestin compounds [5], combined treatment with death ligand TRAIL and antidiabetic acting PPARγ ligands [6], P-glycoprotein (P-gp) inhibitors [7, 8], cancer stem cell targeting agents and autophagy based modulation [7]. Most of them, except for bortezomib, were not screened in the anti-cancer drug sensitivity database pRRophetic was built on. Adam et al. observed that bortezomib combined with paclitaxel act in a synergistic manner. There was more than 2-fold decrease in IC50 when treating the cells (SKOV3 and A2780) with the combination as compared to paclitaxel alone [4]. Our screen did not reveal the role of bortezomib in SOC resistant ovarian cancer possibly because our work focused on single agent efficacy rather than drug combination.
Our GSEA results indicated that pathways related to apoptosis and cytosolic DNA sensing were important in SOC resistance. These have been supported by various literature [35-37]. For example, enhanced DNA repair [35], induction of anti-apoptotic protein [37] and activation of the AKT [37] have been demonstrated to be the major contributing factors for chemoresistance in ovarian cancer. At the same time, these pathways were found to be enriched in increasing sensitivity to our candidate drugs. ABT-888, as a PARP inhibitor, could block the repair of single-strand DNA breaks and result in accumulation of single-strand breaks and subsequently double-strand breaks. The inability of DNA repair will cause chromosomal instability, cell cycle arrest and ultimately cell death. It is therefore not a surprise that up-regulated DNA repair and apoptosis pathway could decrease the vulnerability of chemotherapy, however, increase the vulnerability of DNA repair targeted ABT-888.
Although the effectiveness of all 5 candidate drugs was reproduced in AOCS, an independent clinical ovarian cancer study, only 2 of the 5 drugs were validated in vitro using CTRP v2. The reasons may be 1) lenalidomide was not screened in CTRP v2; and 2) much smaller sample size in the in vitro validation dataset when compared to the in vivo validation dataset (41 vs 285).
In conclusion, by applying a novel drug sensitivity prediction approach to a set of large in vivo and in vitro datasets, we discovered and validated several candidate drugs that could be more effective in SOC resistant ovarian cancer patients. GSEA analysis unveiled the pathways that may account for the improved efficacy of our candidate drugs comparing with SOC. Clinical trials evaluating the effectiveness of some of these candidate drugs either alone or in combination with chemotherapy are ongoing in ovarian cancer. They should also be carefully examined in the SOC resistant setting.
MATERIALS AND METHODS
Overview
pRRophetic method simultaneously constructs prediction models using transcriptome and drug sensitivity data derived from the Cancer Genome Project (CGP) and apply it to the datasets that contain transcriptome information (i.e., the TCGA) to generate predicted drug IC50s.
Given that there are 138 drugs screened in CGP [9], we were able to generate predicted drug IC50s of all 138 drugs in each tumor sample. In this study, we generated predicted drug IC50s in vivo for two independent large ovarian cancer datasets: the TCGA and Australian Ovarian Cancer Study (AOCS) [38]. Furthermore, to validate our prediction, we generated predicted drug IC50s in another large in vitro cancer cell line drug screening dataset, the Cancer Therapeutics Response Portal v2 (CTRP v2) [14] ; and compared the predicted drug IC50 to the experimentally measured cellular sensitivity (eg. AUC) to drugs.
Specifically, TCGA ovarian cancer gene expression profiles were downloaded from TCGA data portal (https://tcga-data.nci.nih.gov/tcga/). There are four sets of transcriptome profiles for ovarian cancer: two generated using microarrays— Affymetrix HT Human Genome U133 and Agilent 244K Custom Gene Expression G4502A-07; and the other two with RNA-seq. The Affymetrix platform contained expression profiles of 520 patients, and Agilent platform contained expression profiles of 574 patients. Illumina HiSeq 2000 RNA Sequencing platform contained 413 patients’ tumor expression profile, and Illumina HiSeq 2000 RNA Sequencing Version 2 has expression profiles for 266 patients. Although the samples from these four expression datasets were highly overlapped, because the different transcriptome profiling technologies have different specificity, sensitivity and dynamic range, we examined each dataset separately as technical replications. Findings from each analysis were compared and only those drugs that predicted to be more sensitive in SOC resistant tumors by all 4 analyses were further evaluated.
Transcriptome data for AOCS was generated using Affymetrix U133_plus2 microarray and obtained through GEO (GSE9891, http://www.ncbi.nlm.nih.gov/geo/query/acc.cgi?acc=GSE9891). This includes gene expression data for 285 ovarian tumor samples.
For prediction validation, we employed CTRP v2 [38], in which area under the dose response curve (AUCs) for 481 compounds were available in 860 cancer cell lines. The drug sensitivity data was downloaded from CTD2 DATA PORTAL (https://ctd2.nci.nih.gov/dataPortal/). The mRNA expression (Affymetrix U133+2 array) data of the cell lines was obtained from Cancer Cell Line Encyclopedia (CCLE) data portal (http://www.broadinstitute.org/ccle).
In vivo identification of drugs that may work in SOC resistant ovarian cancer patients
We chose to analyze TCGA ovarian tumors as our discovery dataset because it is one of the largest ovarian cancer datasets where algorithms such as pRRophetic could be employed, while AOCS dataset was used as independent in vivo validation dataset. For each tumor sample in TCGA and AOCS, we generated 138 predicted drug IC50s. Specific for TCGA, predicted drug IC50 was generated independently using each set of the four transcriptome profiling datasets separately. Note that lower predicted drug IC50 indicated higher sensitivity to such a drug.
We calculated ovarian cancer patients’ SOC IC50 by averaging the predicted drug IC50 to cisplatin and docetaxel for every patient. Furthermore, with the commonly observed 80% response rate to SOC in ovarian cancer [3, 4], we classified TCGA ovarian cancer samples as either resistant to SOC (as the top 20% ranked SOC response) or sensitive to SOC (the bottom 80% ranked SOC response).
We then evaluated the predicted drug IC50s of other 136 drugs to discover drugs showing opposite predicted efficacy profile to that of SOC using Student’s t-test. In another word, we aimed at identifying drugs with lower predicted drug IC50 (meaning higher sensitivity) in SOC resistant patients. The same selection method was applied to all 4 TCGA gene expression datasets. The candidate drug lists were overlapped to generate the final candidate drug list. To avoid findings dependent on the arbitrary cutoff used in defining SOC response, in addition to the 80/20 (responder vs. non-responder) cutoff, we also evaluated the 50/50 (responder vs. non-responder) cutoff as well as employing correlation analysis between SOC and candidate drugs. P values less than 0.05 were considered significant.
In vivo and in vitro validation of candidate drugs
The findings from TCGA were first validated through the AOCS dataset. Given CTRP v2 has measured hundreds of drugs’ sensitivities in ovarian cancer cell lines (including some of the candidate drugs we predicted to be more sensitive in TCGA and AOCS), we performed separate predictions using CTRP v2 ovarian cancer cell lines. Specifically, gene expression profiles was available in 41 of the 43 ovarian cancer cell lines in CTRP v2. Once again, cell lines sensitivity to SOC were generated by averaging the predicted drug IC50 of cisplatin and docetaxel. CTRP v2 measured and reported AUC as drug sensitivity with the higher the AUC, the more resistant the cells to any given drug. Then we performed Student’s t-test on candidate drug AUCs between SOC sensitive cell lines and SOC resistant cell lines.
Gene set enrichment analysis (GSEA)
To further explore the potential mechanism underlying the observed opposite therapeutic effect of our candidate drugs and the SOC, we performed GSEA analysis (GSEA software v2.2.2, www.broadinstitute.org/gsea) using the KEGG pathway gene sets. We input TCGA-Agilent expression dataset and predicted SOC IC50s and those of the candidate drugs as phenotypes. The association between drug sensitivities and gene expression was run separately for each phenotype following the developer’s protocol (http://www.broad.mit.edu/gsea/). FDR q-value <0.25 was used to define significantly regulated pathways. The positively SOC-correlated pathways were overlapped with pathways that were significantly and negatively correlated with all candidate drugs.
Abbreviations
TCGA: The Cancer Genome Atlas.
SOC: standard of care.
CGP: Cancer Genome Project.
CTRP v2: Cancer Therapeutics Response Portal v2.
AOCS: Australian Ovarian Cancer Study.
AUC: area under the dose response curve.
CCLE: Cancer Cell Line Encyclopedia.
GSEA: Gene Set Enrichment Analysis.
Author contributions
FW and RSH conceived the study. FW collected data and performed the analysis and wrote the paper with the help of JTC and RSH. ZZ, GM, AN and SB assisted with analysis. RSH supervised the study.
ACKNOWLEDGMENTS
The authors thank TCGA, AOCS, CTRP v2, CCLE as well as numerous other groups who have made their data available for public analysis.
CONFLICTS OF INTEREST
The authors have declared that no conflicts of interest exists.
FUNDING
This study was supported by an Avon Foundation Research Grant.
REFERENCES
1. Ribeiro JR, Schorl C, Yano N, Romano N, Kim KK, Singh RK, Moore RG. HE4 promotes collateral resistance to cisplatin and paclitaxel in ovarian cancer cells. J Ovarian Res. 2016; 9: 28. https://doi.org/10.1186/s13048-016-0240-0.
2. Jemal A, Siegel R, Xu J, Ward E. Cancer statistics, 2010. CA Cancer J Clin. 2010; 60: 277-300. https://doi.org/10.3322/caac.20073.
3. du Bois A, Reuss A, Pujade-Lauraine E, Harter P, Ray-Coquard I, Pfisterer J. Role of surgical outcome as prognostic factor in advanced epithelial ovarian cancer: a combined exploratory analysis of 3 prospectively randomized phase 3 multicenter trials: by the Arbeitsgemeinschaft Gynaekologische Onkologie Studiengruppe Ovarialkarzinom (AGO-OVAR) and the Groupe d’Investigateurs Nationaux Pour les Etudes des Cancers de l’Ovaire (GINECO). Cancer. 2009; 115: 1234-44. https://doi.org/10.1002/cncr.24149.
4. Steg AD, Burke MR, Amm HM, Katre AA, Dobbin ZC, Jeong DH, Landen CN. Proteasome inhibition reverses hedgehog inhibitor and taxane resistance in ovarian cancer. Oncotarget. 2014; 5: 7065-80. https://doi.org/10.18632/oncotarget.2295.
5. Gamarra-Luques CD, Hapon MB, Goyeneche AA, Telleria CM. Resistance to cisplatin and paclitaxel does not affect the sensitivity of human ovarian cancer cells to antiprogestin-induced cytotoxicity. J Ovarian Res. 2014; 7: 45. https://doi.org/10.1186/1757-2215-7-45.
6. Brautigam K, Biernath-Wupping J, Bauerschlag DO, von Kaisenberg CS, Jonat W, Maass N, Arnold N, Meinhold-Heerlein I. Combined treatment with TRAIL and PPARgamma ligands overcomes chemoresistance of ovarian cancer cell lines. J Cancer Res Clin Oncol. 2011; 137: 875-86. https://doi.org/10.1007/s00432-010-0952-2.
7. Ren F, Shen J, Shi H, Hornicek FJ, Kan Q, Duan Z. Novel mechanisms and approaches to overcome multidrug resistance in the treatment of ovarian cancer. Biochim Biophys Acta. 2016; 1866: 266-75. https://doi.org/10.1016/j.bbcan.2016.10.001.
8. Di Nicolantonio F, Knight LA, Glaysher S, Whitehouse PA, Mercer SJ, Sharma S, Mills L, Prin A, Johnson P, Charlton PA, Norris D, Cree IA. Ex vivo reversal of chemoresistance by tariquidar (XR9576). Anticancer Drugs. 2004; 15: 861-9.
9. Yang W, Soares J, Greninger P, Edelman EJ, Lightfoot H, Forbes S, Bindal N, Beare D, Smith JA, Thompson IR, Ramaswamy S, Futreal PA, Haber DA, et al. Genomics of Drug Sensitivity in Cancer (GDSC): a resource for therapeutic biomarker discovery in cancer cells. Nucleic Acids Res. 2013; 41: D955-61. https://doi.org/10.1093/nar/gks1111.
10. Barretina J, Caponigro G, Stransky N, Venkatesan K, Margolin AA, Kim S, Wilson CJ, Lehar J, Kryukov GV, Sonkin D, Reddy A, Liu M, Murray L, et al. The Cancer Cell Line Encyclopedia enables predictive modelling of anticancer drug sensitivity. Nature. 2012; 483: 603-7. https://doi.org/10.1038/nature11003.
11. Beaufort CM, Helmijr JC, Piskorz AM, Hoogstraat M, Ruigrok-Ritstier K, Besselink N, Murtaza M, van IW, Heine AA, Smid M, Koudijs MJ, Brenton JD, Berns EM, et al. Ovarian cancer cell line panel (OCCP): clinical importance of in vitro morphological subtypes. PLoS One. 2014; 9: e103988. https://doi.org/10.1371/journal.pone.0103988.
12. Geeleher P, Cox NJ, Huang RS. Clinical drug response can be predicted using baseline gene expression levels and in vitro drug sensitivity in cell lines. Genome Biol. 2014; 15: R47. https://doi.org/10.1186/gb-2014-15-3-r47.
13. Geeleher P, Cox N, Huang RS. pRRophetic: an R package for prediction of clinical chemotherapeutic response from tumor gene expression levels. PLoS One. 2014; 9: e107468. https://doi.org/10.1371/journal.pone.0107468.
14. Rees MG, Seashore-Ludlow B, Cheah JH, Adams DJ, Price EV, Gill S, Javaid S, Coletti ME, Jones VL, Bodycombe NE, Soule CK, Alexander B, Li A, et al. Correlating chemical sensitivity and basal gene expression reveals mechanism of action. Nat Chem Biol. 2016; 12: 109-16. https://doi.org/10.1038/nchembio.1986.
15. Villedieu M, Louis MH, Dutoit S, Brotin E, Lincet H, Duigou F, Staedel C, Gauduchon P, Poulain L. Absence of Bcl-xL down-regulation in response to cisplatin is associated with chemoresistance in ovarian carcinoma cells. Gynecol Oncol. 2007; 105: 31-44. https://doi.org/10.1016/j.ygyno.2006.12.011.
16. Hognason T, Chatterjee S, Vartanian T, Ratan RR, Ernewein KM, Habib AA. Epidermal growth factor receptor induced apoptosis: potentiation by inhibition of Ras signaling. FEBS Lett. 2001; 491: 9-15.
17. Wang SQ, Liu ST, Zhao BX, Yang FH, Wang YT, Liang QY, Sun YB, Liu Y, Song ZH, Cai Y, Li GF. Afatinib reverses multidrug resistance in ovarian cancer via dually inhibiting ATP binding cassette subfamily B member 1. Oncotarget. 2015; 6: 26142-60. https://doi.org/10.18632/oncotarget.4536.
18. Hurvitz SA, Shatsky R, Harbeck N. Afatinib in the treatment of breast cancer. Expert Opin Investig Drugs. 2014; 23: 1039-47. https://doi.org/10.1517/13543784.2014.924505.
19. Molife LR, Omlin A, Jones RJ, Karavasilis V, Bloomfield D, Lumsden G, Fong PC, Olmos D, O’Sullivan JM, Pedley I, Hickish T, Jenkins P, Thompson E, et al. Randomized Phase II trial of nintedanib, afatinib and sequential combination in castration-resistant prostate cancer. Future Oncol. 2014; 10: 219-31. https://doi.org/10.2217/fon.13.250.
20. Seiwert TY, Fayette J, Cupissol D, Del Campo JM, Clement PM, Hitt R, Degardin M, Zhang W, Blackman A, Ehrnrooth E, Cohen EE. A randomized, phase II study of afatinib versus cetuximab in metastatic or recurrent squamous cell carcinoma of the head and neck. Ann Oncol. 2014; 25: 1813-20. https://doi.org/10.1093/annonc/mdu216.
21. Puvanenthiran S, Essapen S, Seddon AM, Modjtahedi H. Impact of the putative cancer stem cell markers and growth factor receptor expression on the sensitivity of ovarian cancer cells to treatment with various forms of small molecule tyrosine kinase inhibitors and cytotoxic drugs. Int J Oncol. 2016; 49: 1825-38. https://doi.org/10.3892/ijo.2016.3678.
22. Donawho CK, Luo Y, Luo Y, Penning TD, Bauch JL, Bouska JJ, Bontcheva-Diaz VD, Cox BF, DeWeese TL, Dillehay LE, Ferguson DC, Ghoreishi-Haack NS, Grimm DR, et al. ABT-888, an orally active poly(ADP-ribose) polymerase inhibitor that potentiates DNA-damaging agents in preclinical tumor models. Clin Cancer Res. 2007; 13: 2728-37. https://doi.org/10.1158/1078-0432.ccr-06-3039.
23. Bryant HE, Schultz N, Thomas HD, Parker KM, Flower D, Lopez E, Kyle S, Meuth M, Curtin NJ, Helleday T. Specific killing of BRCA2-deficient tumours with inhibitors of poly(ADP-ribose) polymerase. Nature. 2005; 434: 913-7. https://doi.org/10.1038/nature03443.
24. Farmer H, McCabe N, Lord CJ, Tutt AN, Johnson DA, Richardson TB, Santarosa M, Dillon KJ, Hickson I, Knights C, Martin NM, Jackson SP, Smith GC, et al. Targeting the DNA repair defect in BRCA mutant cells as a therapeutic strategy. Nature. 2005; 434: 917-21. https://doi.org/10.1038/nature03445.
25. Cancer Genome Atlas Research Network. Integrated genomic analyses of ovarian carcinoma. Nature. 2011; 474: 609-15. https://doi.org/10.1038/nature10166.
26. Puhalla S, Beumer JH, Pahuja S, Appleman LJ, Tawbi HA, Stoller RG, Lee JJ, Lin Y, Kiesel B, Yu J. (2014). Final results of a phase 1 study of single-agent veliparib (V) in patients (pts) with either BRCA1/2-mutated cancer (BRCA+), platinum-refractory ovarian, or basal-like breast cancer (BRCA-wt). ASCO Annual Meeting Proceedings, pp. 2570.
27. Coleman RL, Sill MW, Bell-McGuinn K, Aghajanian C, Gray HJ, Tewari KS, Rubin SC, Rutherford TJ, Chan JK, Chen A, Swisher EM. A phase II evaluation of the potent, highly selective PARP inhibitor veliparib in the treatment of persistent or recurrent epithelial ovarian, fallopian tube, or primary peritoneal cancer in patients who carry a germline BRCA1 or BRCA2 mutation - An NRG Oncology/Gynecologic Oncology Group study. Gynecol Oncol. 2015; 137: 386-91. https://doi.org/10.1016/j.ygyno.2015.03.042.
28. Cohen MH, Johnson JR, Chattopadhyay S, Tang S, Justice R, Sridhara R, Pazdur R. Approval summary: erlotinib maintenance therapy of advanced/metastatic non-small cell lung cancer (NSCLC). Oncologist. 2010; 15: 1344-51. https://doi.org/10.1634/theoncologist.2010-0257.
29. Bartlett JM, Langdon SP, Simpson BJ, Stewart M, Katsaros D, Sismondi P, Love S, Scott WN, Williams AR, Lessells AM, Macleod KG, Smyth JF, Miller WR. The prognostic value of epidermal growth factor receptor mRNA expression in primary ovarian cancer. Br J Cancer. 1996; 73: 301-6.
30. Lacroix L, Pautier P, Duvillard P, Motte N, Saulnier P, Bidart JM, Soria JC. Response of ovarian carcinomas to gefitinib-carboplatin-paclitaxel combination is not associated with EGFR kinase domain somatic mutations. Int J Cancer. 2006; 118: 1068-9. https://doi.org/10.1002/ijc.21460.
31. Farley J, Brady WE, Vathipadiekal V, Lankes HA, Coleman R, Morgan MA, Mannel R, Yamada SD, Mutch D, Rodgers WH, Birrer M, Gershenson DM. Selumetinib in women with recurrent low-grade serous carcinoma of the ovary or peritoneum: an open-label, single-arm, phase 2 study. Lancet Oncol. 2013; 14: 134-40. https://doi.org/10.1016/s1470-2045(12)70572-7.
32. Hayakawa J, Ohmichi M, Kurachi H, Ikegami H, Kimura A, Matsuoka T, Jikihara H, Mercola D, Murata Y. Inhibition of extracellular signal-regulated protein kinase or c-Jun N-terminal protein kinase cascade, differentially activated by cisplatin, sensitizes human ovarian cancer cell line. J Biol Chem. 1999; 274: 31648-54.
33. Segler A, Tsimberidou AM. Lenalidomide in solid tumors. Cancer Chemother Pharmacol. 2012; 69: 1393-406. https://doi.org/10.1007/s00280-012-1874-2.
34. Sharma RA, Steward WP, Daines CA, Knight RD, O’Byrne KJ, Dalgleish AG. Toxicity profile of the immunomodulatory thalidomide analogue, lenalidomide: phase I clinical trial of three dosing schedules in patients with solid malignancies. Eur J Cancer. 2006; 42: 2318-25. https://doi.org/10.1016/j.ejca.2006.05.018.
35. Parker RJ, Eastman A, Bostick-Bruton F, Reed E. Acquired cisplatin resistance in human ovarian cancer cells is associated with enhanced repair of cisplatin-DNA lesions and reduced drug accumulation. J Clin Invest. 1991; 87: 772-7. https://doi.org/10.1172/jci115080.
36. Ling X, Bernacki RJ, Brattain MG, Li F. Induction of survivin expression by taxol (paclitaxel) is an early event, which is independent of taxol-mediated G2/M arrest. J Biol Chem. 2004; 279: 15196-203. https://doi.org/10.1074/jbc.M310947200.
37. West KA, Castillo SS, Dennis PA. Activation of the PI3K/Akt pathway and chemotherapeutic resistance. Drug Resist Updat. 2002; 5: 234-48.
38. Olsen CM, Bain CJ, Jordan SJ, Nagle CM, Green AC, Whiteman DC, Webb PM. Recreational physical activity and epithelial ovarian cancer: a case-control study, systematic review, and meta-analysis. Cancer Epidemiol Biomarkers Prev. 2007; 16: 2321-30. https://doi.org/10.1158/1055-9965.epi-07-0566.