
INTRODUCTION
Prostate cancer (PCa) is the second leading cause of cancer-related death in males in industrialized western countries and represents a growing problem worldwide [1]. Hormone refractory/castration resistant PCa (CRPC) usually develops after an initially therapeutically efficacious treatment with anti-hormonal compounds [2]. CRPC is also associated with resistance to conventional chemotherapies. Docetaxel (DTX), a first line treatment for CRPC, confers survival advantages of approximately 2 months for patients [3, 4] with low overall survival benefit. Indeed, most patients with CRPC relapse and become resistant to DTX therapy [4–7]. Despite the high prevalence of DTX-refractory disease, little is known about the tumor biology of the DTX-resistant residual tumor cells compared with primary tumor cells. Gene expression profiling of androgen independent prostate cancer cells demonstrates complex mechanisms mediating resistance to DTX [10]. In addition, ABC drug transporter family proteins [8] and clusterin [7, 9], have been proposed to play a role in resistance. Accumulating evidence suggests that more aggressive disease develops after DTX-resistance [11, 12] with recruitment and activation of cancer stem [13, 14]. In breast cancer, it was recently shown that residual cancer cells increased mammosphere formation efficacy when compared to primary cancers [9]. Thus, the tumorigenic potential of residual/DTX-resistant (DTXR) cancer cells may be enhanced if the cancer cells were not eradicated by chemotherapy.
It has been previously observed that tumorigenic potential was increased in DTXR residual prostate cancer cell lines when compared to parental cells [15]. Tumorigenic potential in DTXR PCa could be conferred by oncogenic c-Myc, which was stabilized by constitutively activated ERK1/2 in resistant cells. Constitutively activated ERK1/2 was maintained by CXCR4, which was also upregulated in resistant cells. It is now commonly accepted that constitutive activation of the CXCR4, ERK1/2, and c-Myc signaling loop plays a major role in prostate tumorigenesis [15, 16].
The nucleo-cytoplasmic shuttling of proteins and RNAs is a dynamic process that is regulated by the exportin family of proteins. Exportin-1 (XPO-1), also known as chromosomal region maintenance 1 (CRM1), shuttles about 220 proteins from the nucleus to the cytoplasm [17, 18] and is the sole nuclear exporter of several tumor suppressor (TSP) and growth regulatory (GRP) proteins, such as p53 and p73 [19, 20], p21 [21], survivin [22, 23], cyclin D1 [23, 24], Rb1 [25], apc [26], bcr-abl [27], FOXO [28], p27 [29] and STAT3 [30]. Physiologically, export of these proteins prevents unnecessary activity in the absence of DNA injury and other oncogenic activities [31–33]. In tumor cells, however, the export of these proteins inhibits their activity thus promoting tumorigenesis. Many hematologic and solid tumors have elevated XPO-1 levels [34–37] with a strong correlation between increased XPO-1 expression and poor prognosis, as demonstrated in osteosarcoma [38], pancreatic [39], lung [35] and ovarian cancers [34].
PI3K/Akt/mTOR/GSK3β signaling has been shown to increase XPO-1 dependent nuclear export of TSPs, whereas its inhibition [40–43] as well as that of XPO-1 [22, 23] reduces this turnover/recycling. In contrast, PTEN is known to antagonize oncogenic PI3K/Akt signaling. The expression of PTEN, a cargo of XPO-1, is repressed or lost in PCa [45, 46]. It has been also described that the shuttling of cyclin D1 (CCND1 [23], responsible for the progression of cell cycle and regulating the G1/S-phase transition of proliferating cells [44]), from the nucleus to the cytoplasm is regulated by XPO1. Inhibition of XPO-1 and thus the nuclear export of cyclin D1 may activate caspase activity and apoptotic machinery. Similarly, surviving, when localized in nucleus, is mainly involved in spindle monitoring at mitosis, whereas cytoplasmic/mitochondrial survivin counteracts pro-apoptotic signals by preventing caspase-9 and caspase-3 activation, thus XPO-1 inhibition and the nuclear enrichment of survivin would inhibit the anti-apoptotic activity of survivin [22].
A recently developed series of slowly reversible orally available Selective Inhibitor of Nuclear Export (SINE) compounds bind to XPO-1 and inhibit XPO-1 mediated nuclear export [for review see 40]. SINE compounds are actively being evaluated in human [46, 47] and animal clinical trials [48, 49]. In our study, we investigated whether two SINE molecules (KPT-251 and KPT-330/ selinexor) would also be effective against CRPC cells in combination with DTX. We hypothesize that elevated XPO-1 expression is associated with DTXR, as described in a previous report [50], and that the inhibition of this cargo protein may sensitize to DTX in both naive and resistant clones. Here, we show that XPO-1 inhibition using KPT-251 and selinexor enhances the sensitivity to DTX and conclude that the XPO-1 mediated shuttling of nuclear proteins might play an important role in inducing resistance to chemotherapeutic drugs in PCa cells. Together this data suggests that targeting XPO-1 might be a promising strategy for enhancing sensitivity to chemotherapy in CRPC.
RESULTS
Effects of docetaxel in DTX sensitive PC3, 22rv1 and DU145 cell lines
First, we analyzed the effects of DTX on PC3, DU145 and 22rv1 cell lines. In Figure 1A we show the plate image representation of crystal violet stained PC3, 22rv1 and DU145 cells cultured in 24 well/plates with different doses of DTX (0-20 nM). Proliferation of these cells was inhibited by DTX (Figure 1B) with IC50 values of 7.20 nM in p53 null PC3 cells, 1.26 nM in p53 wild type 22rv1 cells, and 16.17 nM PTEN mutant and inactive DU145 cells. It is well known that DTX is able to induce replication stress promoting DSBs and leading to activation of multiple molecular pathways regulating DNA repair, including ATM-Chk2-p53 (22rv1 cell line), ATR-Chk1 (PC3 and DU145 cell lines) and PARP signaling. In addition we observed that DTX increased the levels γH2AX and phosphorylation of Chk1/2, which are indicative of DNA damage and kinase activity, respectively. In Figure 1C and 1E we show western blotting evaluation on molecular arrangement induced by 10 nM in p53 mutated PC3 cells (1C) and 1 nM in p53 wild type 22rv1 cells (1E). DTX doses close to the IC50 values were chosen for both cell lines. The levels of γH2AX, Chk1 and Chk2 were normalized using histone H3, whereas phosphorylated forms of Chk1 (p-Ser345) and Chk2 (p-Tyr68) were normalized to total expression of Chk1 and Chk2, respectively. From a first analysis of western blotting of PC3 and 22rv1 cells treated with DTX, γH2AX reached maximal levels at 24 hours then dropped to reach sub-baseline values. In 22rv1 cells (Figure 1F) the increase of γH2AX was more gradual without a clear return to basal values. This data suggests that 22rv1 cells were actively trying to repair DNA but could not. As a result, they again activated DDR, as evidenced by high γH2AX levels. PC3 cells seem to have completed, instead, the DNA-repair and could resume their cell proliferation after an initial cytostasis. The levels of Chk1 and Chk2 were significantly reduced in the time indicating possible shuttling in the cytoplasm and degradation. The reduction of Chk1 levels was higher when compared to those observed for Chk2. The normalized levels of the phosphorylated nuclear isoforms of Chk1 and Chk2 (Figure 1D, 1F) were increased in the time especially in 22rv1 cells. Chk1 and Chk2 activation was consistent with that observed for γH2AX. The levels p-(ser345)Chk1 increased in PC3 and 22rv1 (Figure 1D, 1F) following the increment of γH2Ax levels and were maximal at 48 hours although γH2Ax expression levels dropped in PC3 cells (Figure 1D). Levels of p-Chk2(Tyr68) increased both in PC3 and 22rv1 cells. Chk1 and Chk2 activation levels are different in PC3 and 22rv1cells and this suggests differences in the DTX-mediated cell apoptosis (Figure 1G) and caspase 3 activation (Figure 1H). In PC3 cells (in the absence of p53) DNA damage signals a replicative block in S and G2/M cell cycle phase. In 22rv1 (in the presence of p53) a further replicative block may be observed in the passage from G1 to S. In the Figure 1G we show FACS determinations demonstrating a bigger G2/M cell peak, corresponding to a cell cycle arrest in this phase, in PC3 cells whereas a reduction of this peak observed in 22rv1 cells, was indicative of G0/G1 cell cycle arrest and this was in agreement with several literature data. DU145 cells, with mutant and not functional p53, follow the trend of PC3 cells also if the G2/M peak in the administration of the IC50 dose of DTX seemed to be reduced compared to that observed at IC20 dose. The block of G2/M was associated also with increased subG1 apoptotic cells ranged between 25% (PC3 cells) and 67% (22rv1 cells). In addition we demonstrate a critical role of Chk1 in the protection to cell death. The addition of 50 nM Chk1 inhibitor CCT244747 (Figure 1I), indeed, breaching down Chk1 activity allows to start and thus accelerate the program of cell death.
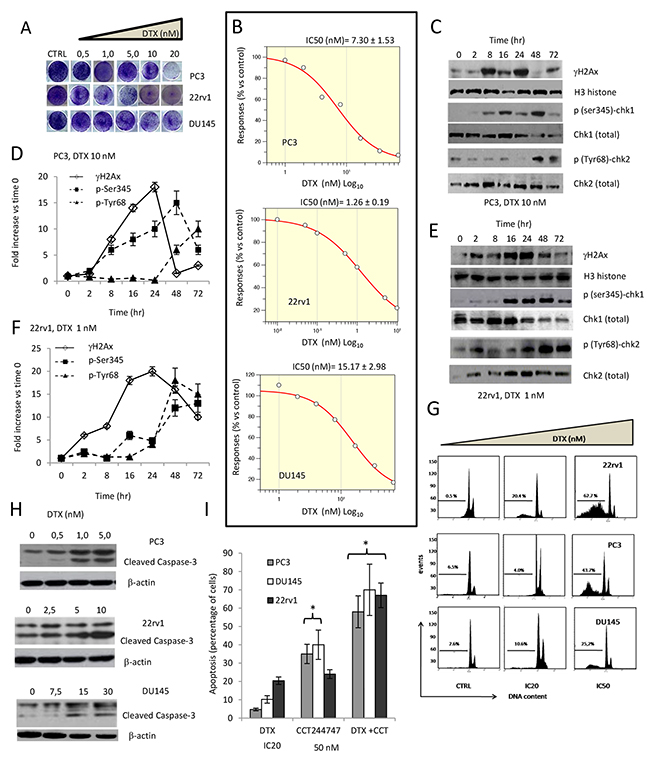
Figure 1: Effects of docetaxel (DTX) in DTX sensitive (DTXS) PC3, 22rv1 and DU145 cell lines. (A) Plate image representation of crystal violet stained PC3, 22rv1 and DU145 cells cultured in 24 well/plates with different doses of DTX (0-20 nM). (B) Proliferation curve generated with Graftit software for PC3 (IC50=7.21 nM), 22rv1 (IC50=1.26 nM) and for DU145 cells (IC50=15.17 nM). (C) DTX (10.0 nM) induces time-dependent DNA damage response (DDR) characterized by γ-H2AX phosphorylation and Chk1/2 kinase activation in PC3 cells. (D) The levels of γH2AX, Chk1 and Chk2 were normalized by using H3 histone as housekeeping nuclear protein, whereas those of phosphorylated forms of Chk1 (p-Ser345) and Chk2 (p-Tyr68) with total expression of Chk1 and chl2, respectively. Normalizing expression levels were plotted in the time for PC3 cells. (E) DTX (1.0 nM) induces time-dependent DNA damage response (DDR) characterized by γ-H2AX phosphorylation and Chk1/2 kinase activation in 22rv1 cells. (F) The levels of γH2AX, Chk1 and Chk2 were normalized by using H3 histone as housekeeping nuclear protein, whereas those of phosphorylated forms of Chk1 (p-Ser345) and Chk2 (p-Tyr68) with total expression of Chk1 and chl2, respectively. Normalizing expression levels were plotted in the time for 22rv1 cells. (G) FACS analyses for apoptotic rate in CTRL and DTX treated cells at IC20 and IC50 values. IC20 values were 0.5 nM, 5.8 nM and 10 nM for 22rv1, PC3 and DU145, respectively (H) caspase 3 activation /cleavage. (I) Addition of 50 nM Chk1 inhibitor CCT244747 start and accelerate the program of cell death in PC3, 22rv1 and DU145 cells. Each lane of western blots was loaded with 100 μg of proteins. Graphical data derived from three different western blot analysis performed on different cell extracts. Data presented as mean ±Error Standard (ES). Data for γH2AX are statistically significant at all considered times whereas p(SER235)-Chk1 and p(Tyr68)-Chk2 levels were significant starting from 16 and 24 hour, respectively (p<0.001).
Next, we confirmed that DTX resistant cell derivatives were effectively resistant to this compound. In Figure 2A we show plate image representations of crystal violet stained DU145DTXR, 22rv1DTXR and PC3DTXR cells grown in 24 well plates cultured with different doses of DTX (0-500 nM) and having significant higher IC50 values (Figure 2B) to those observed for DTXS cell strains reaching 225 nM (PCE3DTXR), 44 nM (22rv1DTRX) and 78 nM (DU145DTXR). Also in DTXR cells, DTX at IC50 values for each cell lines induced DNA damage response (DDR) characterized by γH2AX phosphorylation and Chk1/2 kinase activation (Figure 2C in PC3DTXR and Figure 2E in 22rv1DTXR cells). Our data shows that γH2AX reached maximal levels at 8-16 hours both in PC3DTXR (Figure 2C, 2D) and 22rv1DTXR (Figure 2E, 2F) cells, then returned to baseline values at 48 and 72 hours suggesting that DNA damage was repaired. Chk1 kinase activation (p-Ser345) levels increased in a time-dependent manner in 22rv1 cells (Figure 2E, 2F) whereas reached maximal levels up to 16 hours in PC3 Figure 2C, 2D), then went down and remained at sub-baseline values. The levels of p-Tyr68 Chk2 remained elevated until the 8 hour time point (Figure 2D, 2F), then decreased at the 16 hour time point and reached maximum values at 48 and 72 hours. In both cell lines the levels of Chk1 and Chk2 were maintained high and the levels of γH2AX decreased, suggesting that DNA was not repaired. As expected, caspase-3 activity and apoptosis were not observed (Figure 2G) as the cells are DTXR. The protective role of Chk1 was further tested by using 50 nM CCT244747 (Figure 2H) showing synergistic effects in association with DTX.
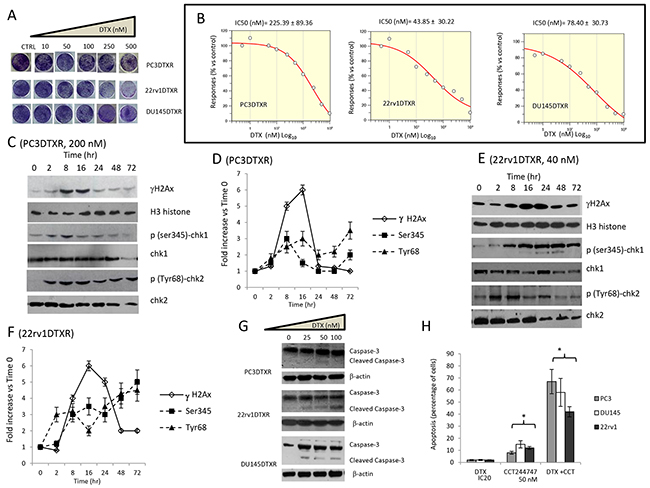
Figure 2: Effects of docetaxel (DTX) in DTX resistant (DTXR) PC3, 22rv1 and DU145 cell lines. (A) Plate image representation of crystal violet stained PC3DTXR, 22rv1DTXR and DU145DTXR cells cultured in 24 well/plates with different doses of DTX (0-500 nM). (B) Proliferation curve generated with Graftit software for PC3DTXR (IC50=225.39 nM), 22rv1 (IC50=43.85 nM) and for DU145 cells (IC50=78.40 nM). (C) DTX (200 nM) induces time-dependent DNA damage response (DDR) characterized by γ-H2AX phosphorylation and Chk1/2 kinase activation in PC3DTXR cells. (D) The levels of γH2AX, Chk1 and Chk2 were normalized by using H3 histone as housekeeping nuclear protein, whereas those of phosphorylated forms of Chk1 (p-Ser345) and Chk2 (p-Tyr68) with total expression of Chk1 and chl2, respectively. Normalizing expression levels were plotted in the time for PC3DTXR cells. (E) DTX (40 nM) induces time-dependent DNA damage response (DDR) characterized by γ-H2AX phosphorylation and Chk1/2 kinase activation in 22rv1DTXR cells. (F) The levels of γH2AX, Chk1 and Chk2 were normalized by using H3 histone as housekeeping nuclear protein, whereas those of phosphorylated forms of Chk1 (p-Ser345) and Chk2 (p-Tyr68) with total expression of Chk1 and chl2, respectively. Normalizing expression levels were plotted in the time for 22rv1DTXR cells. (G) caspase 3 activation /cleavage. (H) Addition of 50 nM Chk1 inhibitor CCT244747 start and accelerate the program of cell death in PC3DTXR, 22rv1DTXR and DU145DTXR cells. Each lane of western blots was loaded with 100 μg of proteins. Graphical data derived from three different western blot analysis performed on different cell extracts. Data presented as mean ±Error Standard (ES). In PC3DTXR cells, data for γH2AX are statistically significant starting to 2 hours and until 24 hours; p(SER235)-Chk1 was statistically significant at 8 hour and at 72 hour whereas only p(Tyr68)-Chk2 levels significantly followed a time-dependent increase (p<0.001). In 22rv1DTXR γH2AX, p(Ser235)-Chk1 and p(Tyr68)-Chk2 levels followed a statistically significant time-dependent increase (p<0.001).
Next, we compared some molecular profiles in parental and resistant cell lines. Consistent with previous reports [57–59], we show that that DTXR cells had significant higher levels of βIII tubulin, Foxo3a and ABCB1 when compared to parental ones (Figure 3A, 3C). The expression of HDAC-6, which interacts with and deacetylates α-tubulin and microtubules in vivo, was also increased in resistant cells. The expression levels of α-tubulin were significantly lower in resistant cells when compared to parental ones (Figure 3A). 22rv1 DTXR cells showed no modulation of p-FOXO3a (S253), PC3 DTXR cells showed a slight reduction expression whereas DU145 cells showed a significant strong reduction of p-FOXO3a (S253) as shown in Figure 3A, 3C). DTX resistant cells showed also higher levels of p-AktT308 and p-AktS473. XPO-1 expression levels were higher in the cytoplasm when compared to nucleus of PCa cells and this difference was increased in DTXR respect to DTX sensitive (DTXS) cells. This was in agreement with our previous data showing that more aggressive PCa cells showed higher XPO1 levels and cytoplasmatic localization [23].
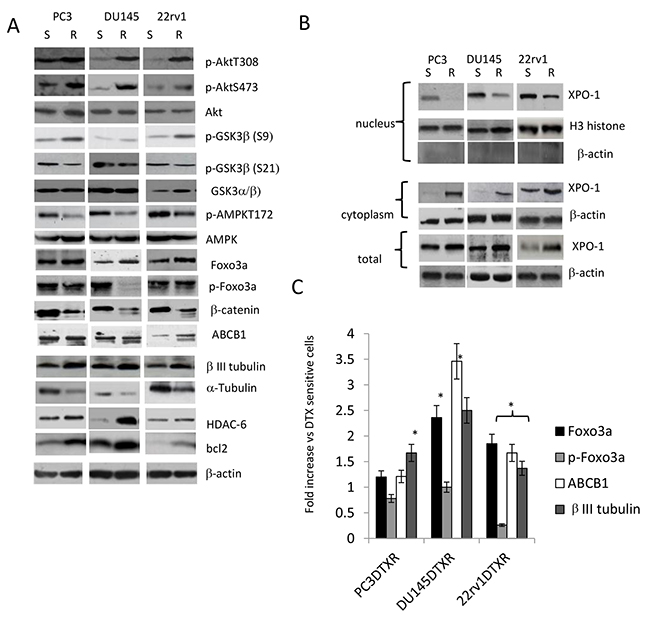
Figure 3: (A) Differences in molecular arrangements on DTX sensitive and resistant CRPC cell lines. (B) Nuclear and cytoplasmic expression of XPO1 in sensitive and resistant CRPC cell lines. Western blot for nuclear extracts were also blotted with anti β-actin antibody to verify the presence of cytosolic proteins. (B) Foxo3a, p-Foxo3a, ABCB1 and βIII tubulin levels in DTX resistant CRPC cells expressed as fold increase (C) vs DTX sensitive cells. Each lane was loaded with 100 mg of proteins. Graphs were made analyzing three different western blots. * p<0.001
In addition, we demonstrate that treatment with DTX was able to modulate the nuclear and cytoplasmatic levels of XPO1 (Figure 3B). In Figure 4A we show that administration of 20 nM DTX stimulated, in DTXS PC3 cells, an initial nuclear translocation of XPO1 at 24-48 hours (Figure 4A, 4B) and a late reduced nuclear expression. Similarly, DTXR PC3 cells treated with 100 nM DTX increased the levels of nuclear XPO1 at 24 hours which was reduced at very low extent at 72 and 96 hours (Figure 4B). A number of studies demonstrated a role for FOXO3a in tumor progression by promoting invasive migration of cancer cells [58, 59]. For example, FOXO3a promotes metastasis in the context of nucleus accumulation of β-catenin [59]. The finding suggests that nuclear FOXO3a and β-catenin may synergize to promote transcription of genes that are involved in scattering and metastasis. So, we first compared the nuclear and cytoplasmatic levels of β-catenin, c-myc and cyclin D1 (Figure 4C) and next the molecular re-arrangement induced by DTX on GSK3β/Foxo3a/β-catenin pathways both in DTXS and DTXR PC3 cells. We found that resistant strains showed high levels of oncogenic protein involved in the Foxo3a/β–catenin pathways. For example, cyclin D1 was equally distributed between cytoplasm and nucleus in both sensitive and resistant strains and was associated to elevated levels of β-catenin. Similarly c-myc was induced especially in the nuclear microenvironment and reduced in the cytoplasm of resistant DU145 cells.
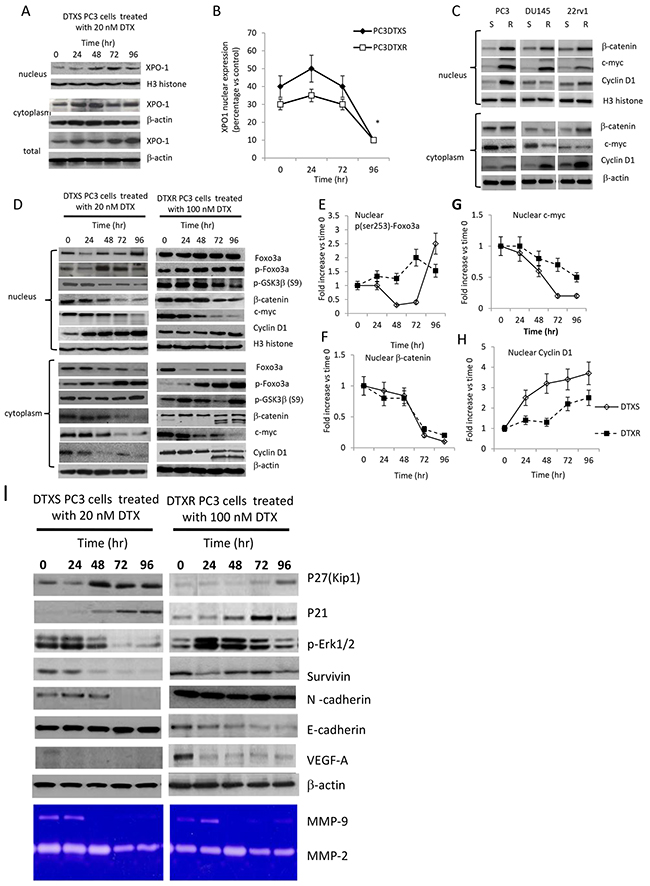
Figure 4: (A) Effects of 10 nM DTX in DTXS cells (time-dependent trend) on XPO1 expression in nuclear, cytoplasmic and total cell extracts. (B) Differences in the modulation of XPO1 expression, normalized vs Histone H3, during DTX administration in DTXS (DTX=10 nM) and DTXR (DTX=200 nM) PC3 cell strains. (C) Nuclear and cytoplasmatic Expression of β-catenin and its related targets (c-myc and cyclin D1) in DTX resistant and sensitive CRPC cells. (D) Modulation of nuclear and cytoplasmatic expression of GSK3β/Foxo3a/β-catenin and related target proteins (c-myc and cyclin D1) in DTXS and DTXR PC3 cell strains treated with 10 and 200 nM DTX, respectively. Immunoblots for p-Foxo3a, β-catenin, c-myc and cyclin D1 were normalized first versus the levels of Histone H3 and next on the levels at Time 0 (T0). Three western blots were analyzed and data expressed as mean of fold increases versus T0 ± Standard Error (SE). (E) Modulation of nuclear expression levels of p-Foxo3a in PC3DTXS and PC3DTXR cells; (F) modulation of nuclear expression levels of β-catenin in PC3DTXS and PC3DTXR cells; (G) modulation of nuclear expression levels of c-myc in PC3DTXS and PC3DTXR cells; (H) modulation of nuclear expression levels of cyclin D1 in PC3DTXS and PC3DTXR cells. (I) Western blot and zymographic evaluation of antiproliferative/cell cycle dependent (p21 and p27), EMT (Survivin, VEGF-A, N-cadherin and metalloproteinases) and Epithelial (E-cadherin) related targets.
After normalizations first versus total Foxo3a (for p-Foxo3a) or Histone H3 (for β-catenin, c-myc and cyclin D1) and next versus Time 0 (T0) we demonstrated that in the PC3DTXS cell strain, DTX administration significantly reduced the nuclear levels of p-Foxo3a (Figure 4D, 4E) up to 48 hours. Subsequently they went up to reach the maximum levels at 72 hours. In the PC3DTXR cell strain, instead, the nuclear p-Foxo3a levels grew in a time-dependent manner (Figure 4D, 4E). Parallely, cytoplasmatic expression of Foxo3a was progressively reduced in the time (Figure 4D) in both cell strains.
Several studies demonstrated a role for FOXO3a in tumor progression through the promotion of invasive migration of cancer cells [58, 59]. An important target of Foxo3a in the activation of this pathway is the β-catenin which undergoes continuous nuclear to cytoplasmic shuttling and vice versa, which regulates its function [59]. So, Foxo3a and β-catenin could synergize to promote transcription of genes that are involved in scattering and metastasis. Next we verified the nuclear and cytoplasmatic levels of β-catenin as well as the expression of some downstream targets of β-catenin (indicators of activity) such as c-myc, cyclin D1, cytokeratin 18, E-cadherin, N-cadherin and MMP-9. As expected higher β-catenin levels were found in PC3 DTXR cell strain when compared to PC3DTXS ones (Figure 4F) suggesting that β-catenin expression could be associated with drug resistance to DTX. So we verified if β-catenin levels were modified by DTX treatment in both cell strains. We observed that the levels of β-catenin were significantly reduced in the nucleus of both DTX sensitive or resistant treated PC3 cells with similar degree (Figure 4D, 4F). The analyses of the cytoplasmatic levels of this protein showed an increased proteolysis observed in PC3 DTXS cells at 72 and 96 hours of treatment with DTX (Figure 4D).
The expression of c-myc was significantly reduced in DTXS PC3 cells both in the nucleus and in the cytoplasm (Figure 4D). The comparison between DTX sensitive and resistant cells treated with DTX shows that c-myc undergoes a reduction of about 50% in resistant cells whereas that observed in sensitive cells was much more of 150% (Figure 4G). The levels of GSK3β were not significantly modified in DTXS PC3 cells whereas in DTXR PCX3 cells p-GSK3β levels progressively decreased after an early induction due probably to modifications in Akt activity. Nuclear accumulation was, instead, observed for Cyclin D1 (Figure 4H), a protein that must exit the nucleus in the transition from G2/M to G0/G1 of cell cycle. This justify further that PC3 are arrested in the G2/M cell cycle phase.
Expression of VEGF-A as well as N-cadherin, a marker for Epithelial-Mesenchymal Transition (EMT) are related to a β-catenin nuclear activity. So we verified if DTX sensitivity/resistance was associated to EMT phenotype. It has been well known that DTXR cells express higher levels of N-cadherin of DTXS cells. Similarly, VEGF-A secretion was higher in DTXR when compare to DTXS cells. Conversely, the levels of epithelial markers such as cytokeratin 18 (K18) or E-cadherin were significantly reduced in DTXR. Short-term administration of DTX was able to down-regulate N-cadherin and VEGF levels in DTXS cells whereas no changes were found in DTXR (Figure 4I) No significant modulation by DTX administration was found in zymographic analyses for MMP2 whereas MMP9 appear to be significantly down-regulated. Cell cycle dependent p21 and p27 proteins was upregulated indicating cell cycle arrest. The levels of Erk were up-regulated in DTXR cells whereas a significant down-modulation was observed in DTXS cells and this was in agreement with the higher effects of DTX in DTXS when compared to those observed in DTXR cells. DTXR cells result also protected by different intracellular signaling involving Akt and MAPK.
XPO1 inhibition increases the sensitivity to DTX in PC3, DU145 and 22rv1 DTX sensitive cells and sensitizes DTXR PC3, 22rv1 and DU145 cells to DTX in vitro
The combination of selinexor with DTX demonstrated a significant reduction of tumor cell viability as evidenced by a dose-dependent chemotherapeutic agent induction of 50% cell death. For the Chou-Talay analyses of combination we examined PC3 and DU145 cells. Importantly, both cell lines are sensitive to selinexor (IC50 values for selinexor 380 and 105 nM for PC3 and DU145 cells, respectively) and DTX (7.2 and 15.2 nM for PC3 and DU145 cells, respectively). Treatments with DTX and selinexor in combination in CRPC cell lines was synergistic, additive or competitive depending on the concentrations used and the cell line studied.
In Figure 5 we show the PC3 (A) and DU145 (B) synergy heat map for combination indices (CIs) calculated by Chou-Talay method. This Figure shows that the combination is synergistic at IC20 values for both compounds with more points of synergy observed in PC3 cells than in DU145 cells. In order to calculate the changes of IC50 values for DTX in our cell systems we used the IC20 values of selinexor or KPT-251 for single cell lines and growing doses of DTX. (Figure 5C–5E) confirms that administration of SINE compounds sensitizes tumor cells to DTX sensitively reducing IC50 values for this anticancer agent.
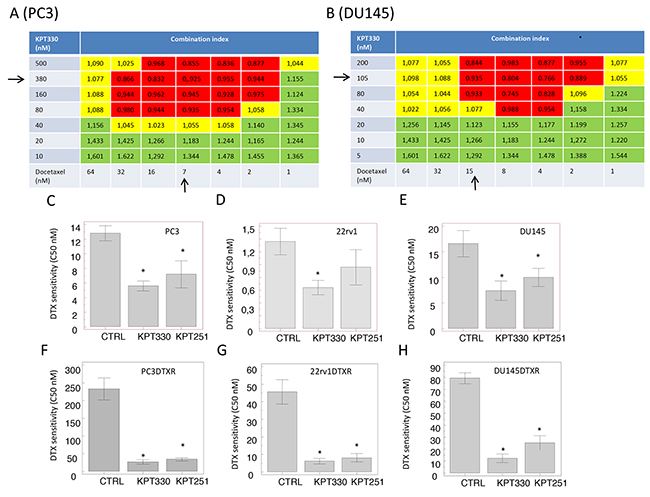
Figure 5: Synergy head maps for Combination Index (CI), calculated by Chou-Talay method. (A) PC3 synergy map calculated for selinexor and DTX co-treatment. (B) DU145 synergy map calculated for selinexor and DTX co-treatment. (C) Reduction of DTX sensitivity (IC50) calculated for PC3 cultured with selinexor and KPT-251 at IC20 values of 100 nM and 78 nM, respectively. (D) Reduction of DTX sensitivity (IC50) calculated for 22rv1 cultured with selinexor and KPT-251 at IC20 values of 75 nM and 56 nM, respectively. (E) Reduction of DTX sensitivity (IC50) calculated for DU145 cultured with selinexor and KPT-251 at IC20 values of 50 nM and 58 nM, respectively. (F) Reduction of DTX sensitivity (IC50) calculated for PC3DTXR cultured with selinexor and KPT-251 at IC20 values of 120 nM and 85 nM, respectively. (G) Reduction of DTX sensitivity (IC50) calculated for 22rv1DTXR cultured with selinexor and KPT-251 at IC20 values of 90 nM and 75 nM, respectively. (H) Reduction of DTX sensitivity (IC50) calculated for DU145DTXR cultured with selinexor and KPT-251 at IC20 values of 135 nM and 92 nM, respectively. Synergy is showed in the red boxes, additivity in yellow boxes and competition in green boxes. Black arrows represent the IC50 values for both compounds.
SINE compounds have significant synergistic effects in docetaxel-resistant prostate cancer cell derivatives restoring DTX sensitivity (Figure 5F–5H): co-administration with 50 nM selinexor corresponding to IC20 value for PC3DTXR reduced IC50 value calculated for docetaxel from 225 nM to 47 nM, a 5-fold reduction. Similarly, co-administration of 125 nM KPT-251 (IC20 value [23]) reduced the IC50 of DTX 2-fold in the same cells (IC50 = 3.7 nM). The decrement observed in 22rv1 was of about 10-fold (44 nM vs 7 nM for selinexor and 6.2 nM for KPT-251) whereas the reduction of IC50 in DU145 DTXR was about 6 fold (78 nM vs 12 nM for selinexor and 25 nM for KPT-251).
XPO1 inhibitors increased DNA damage when used with DTX
In order to demonstrate that selinexor increased DNA damage and slowed down DNA repair when used in combination with DTX, we evaluated the changes in the γH2AX expression by ELISA in PC3 DTXS and PC3 DTXR cells. This analysis levels revealed that DTX-induced DNA damage signals (such as γH2AX) could not promote complete DNA damage repair in both DTX sensitive and resistant cells after pre-treatment with selinexor (Figure 6A). Indeed, we observed, a complete return to baseline levels of γH2AX at 24 and 48 hours in single agent DTX treatment but nor when DTX was combined with selinexor. In Figure 6B we show immunocytochemical pictures performed on DU145 DTXR and 22rv1 DTXR cell strains demonstrating that in DTXR treated DU145 and 22rv1 cells γH2AX staining was significantly increased up to time 8 (T8) and later. When we considered combined treatments, γH2AX levels reached maximal values at T8-T16 in DU145DTXR cells and at T16-T24 in 22rv1DTXR. Some mitosis of culture treated with DTX and selinexor in combination are strongly γH2AX positive. These mitosis result also aberrant. Next we evaluated the expression changes in Foxo3a, Chk1 and Chk2 after KPT330 (380 nM) administration focusing our attention on PC3 DTXS cells (Figure 6C). We observed that 380 nM selinexor increased steady state levels of FOXO3 and this could be due to p-AMPK down-modulation. This effect was time dependent and maximal from 12-24 hours (Figure 6C). Selinexor was able also to reduce total and phosphorylated levels of Chk1/2 as well as reduce βIII tubulin in the presence of significant levels of α-tubulin, the major target of DTX. Combination treatments were able to modulate several proteins involved in the regulation of cell cycle (p21, p27, cyclin D1 and cyclin A2) and apoptosis (bcl2, bim, bax) inducing caspase 3 cleavage (Figure 6D). In Figure 6E we show immunocytochemical evaluation of the increase of Foxo3a after DTX and combined DTX plus selinexor treatment. Foxo3a appears to be increased mainly in the nucleus of DTX plus selinexor treated cells. Similarly we observed by immuno-cytochemistry that total and nuclear β-catenin (22rv1DTXR, Figure 6F) expression levels were significantly reduced in single DTX or selinexor administration but mainly in combined treatments. Cyclin D1 (DU145DTXR, Figure 6G) levels were increased in the nucleus of DTX treated cells but abrogated after selinexor administration alone or in combination with DTX. In addition, we observed that DTX-induced PARP1 cleavage was increased after combination with selinexor (Figure 6H) as result of a reduced or slowed down selinexor-inhibited DNA damage repair, as previously reported (reference: Ranganathan et al 2016). This finding is associated with increased DNA fragmentation (DNA laddering, Figure 6I) and apoptosis (Figure 6J). In Figure 6H we show also the effects of KPT251.
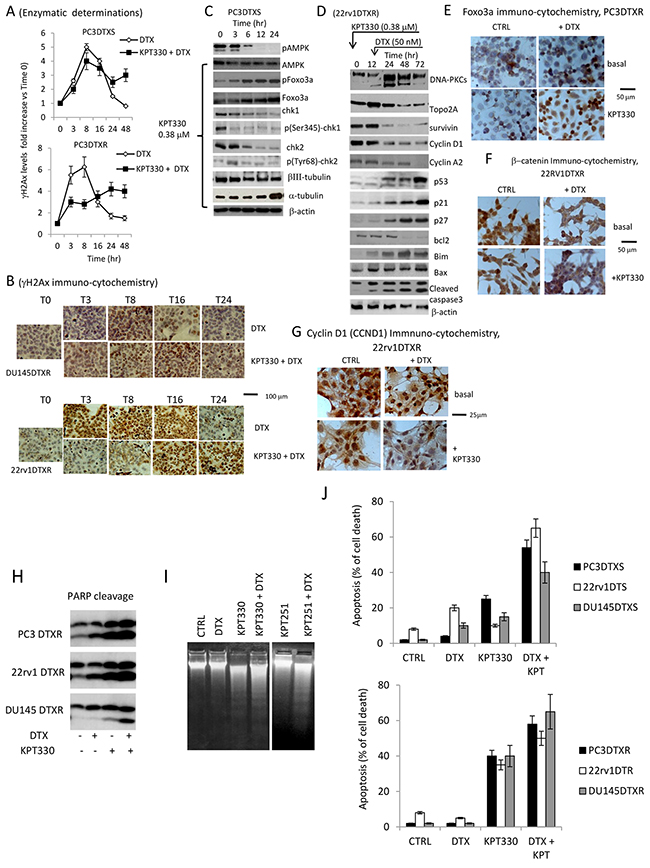
Figure 6: XPO1 inhibitors increased DNA damage when used with docetaxel. (A) Enzymatic determination of γH2AX histone expression in PC3DTXS and PC3DTXR (a Time course experiment). γH2AX expression levels were considered as fold increase vs Time 0 (T0). (B) immunocytochemical eveluation of gH2AX expression in DU145DTXR and 22rv1DTXR cells treated with 80 nM and 40 nM DTX, respectively. (C) Western blot analysis for the expression of DNA repair signaling proteins (ATM/pATM; Foxo3a/pFoxo3a; Chk1/p-Chk1 and Chk2/p-Chk2) and bIII tubulin in PC3DTXS cells treated with 380 nM selinexor. (D) Combination treatment: western blot analysis for the expression of markers for cell cycle (p21, p27, cyclin D1 and cyclin A2) and apoptosis (bcl2, bim, bax). Induction of caspase 3 activation/cleavage. (E) Immunocytochemical evaluation for Foxo3a expression and cytological localization in PC3DTXR cells in CTRL, KPT330 (380 nM), DTX (200 nM) and combination showing increase of Foxo3a in the nucleus of DTX plus Selinexor treated cells. (F) Immunocytochemical evaluation for β-catenin expression and cytological localization in 22rv1DTXR cells in CTRL, KPT330 (380 nM), DTX (200 nM) and combination showing a sensitive decrease of β-catenin in the nucleus of DTX plus Selinexor treated cells. (G) Immunocytochemical evaluation for c-myc expression and cytological localization in 22rv1DTXR cells in CTRL, KPT330 (380 nM), DTX (200 nM) and combination showing a sensitive decrease of c-myc in the nucleus of DTX plus Selinexor treated cells. (H) PARP cleavage in single and combined treatments indicating increased apoptosis and unrepaired DNA after co-administration of KPT330 and DTX. (I) DNA ladder confirming increased DNA fragmentation in the combined treatment. (J) Apoptosis evaluation by FACS in DTXS and DTXR cells. Each lane was loaded with 100 μg of proteins.
In vivo anti-tumor effect of SINE compounds in combination with DTX
To determine the effects of selinexor or KPT-251 administration on DTX sensitivity in vivo we evaluated two SINE compounds (selinexor and KPT-251) in combination with DTX in PC3, DU145, 22rv1 cell lines, and in DTX resistant PC3 DTXR. The cells were subcutaneously injected in athymic male nude mice. In order to reduce the probability of biases due to differences in tumor engraftment we analyzed the tumor progression the parameter “Time to Progression (TTP)”, defined as the time (days) necessary to double the tumor volume for each tumor, comparing differences of TTP by Kaplan Meyer distribution. Xenografted mice were randomly assigned to receive therapeutic doses of selinexor, KPT-251 or DTX and combinations as described in Materials and methods.
We demonstrate that combination between selinexor and DTX (Tables 1 and 2) significantly increased the efficacy of single treatments evaluated by tumor weight reductions measured at the end of drug administration in PC3, DU145 and 22rv1. Selinexor restored also the sensitivity to DTX of PC3 DTXR (Table 2). The calculation of combination indices revealed that the combination involving selinexor and DTX significantly increased the efficacy of single treatments evaluated as tumor weight reductions with synergistic effects both in PC3 DTXR (CI=0.64) and 22rv1 (CI=0.50) xenografts and additive effects in PC3 (CI=0.95) and DU145 (CI=1.12) xenografts. The number of tumors in which progression was: (i) 10/10 in the animal groups of CTRL and in those treated with selinexor, KPT-251 and DTX, and 7/10 (selinexor + DTX) and 8/10 (KPT-251 + DTX) in PC3 tumors; (ii) 10/10 in the groups of CTRL and in those treated with DTX, selinexor, KPT-251 and in the combination KPT-251 + DTX and 6/12 in the group treated with selinexor + DTX in DU145 tumors; (iii) 10/10 in the groups of CTRL and in those treated with DTX, selinexor and KPT251, whereas progression was observed in 6/10 in the group of animals treated with selinexor + DTX and 8/10 in that treated with KPT-251 and DTX in 22rv1 tumors.
Table 1: Antitumor activity of DTX alone or in combination with KPT330 or KPT251 in PC3 and 22rv1 xenografts
Cell line |
Drug |
Weight of mice (gr +/- SE) |
Tumor weight (mg +/- SE) |
TTP (days +/_ SE) |
Vessel count (+/- SE) |
Ki67 (% +/- SE) |
Apoptosis (% +/- SE) |
|---|---|---|---|---|---|---|---|
PC3 |
Vehicle |
25,8 ± 0.6 |
880 ± 140 |
9.0 ± 1,0 |
23.2± 2.3 |
55.5 ± 3.5 |
< 2 |
DTX |
26.0 ± 0.4 |
627 ± 172 |
13.8 ± 1,5 |
11.5 ± 0.5 |
34.5 ± 2.5 |
8.5 ± 1.0 |
|
KPT-330 |
23.8 ± 0.5 |
560± 94 |
14.4 ± 0.5 |
6.4 ± 0.5 |
25.0 ± 1.0 |
5.0 ± 0.5 |
|
KPT-251 |
24.5 ± 0.3 |
666± 94 |
12.2 ± 0.6 |
12.0 ± 0.5 |
30.0 ± 2.0 |
2.5 ± 0.5 |
|
DTX + KPT-330 |
24.5 ± 0.3 |
279 ± 59 |
22.2 ± 0.8 |
1.3 ± 0.5 |
10.0 ± 1.5 |
34.5 ± 3.5 |
|
DTX + KPT-251 |
24.8± 0.6 |
355± 41 |
18.9 ± 0.7 |
4.7 ± 0.5 |
20.0 ± 1.0 |
17.0 ± 1.5 |
|
22rv1 |
Vehicle |
26.5 ± 0.3 |
1045 ± 212 |
10.0 ± 1.5 |
30.5 ± 2.5 |
44.0 ± 3.0 |
< 2 |
DTX |
24.5 ± 0.4 |
709 ± 145 |
13.5 ± 1.0 |
20.0 ± 2.0 |
35.5 ± 2.0 |
10.0 ± 0.5 |
|
KPT-330 |
24.0 ± 0.4 |
527 ± 72 |
17.0 ± 1.5 |
8.0 ± 0.5 |
24.5 ± 2.5 |
8.5 ± 1.1 |
|
KPT-251 |
23.8 ± 0.55 |
615±55 |
15.0 ± 1.0 |
14.5 ± 0.5 |
32.0 ± 1.5 |
< 2 |
|
DTX + KPT-330 |
24.5 ± 0.3 |
200± 88 |
22.5 ± 2.0 |
5.0 ± 0.5 |
10.5 ± 2.0 |
44.5 ± 0.5 |
|
DTX + KP-T251 |
25.5 ± 0.3 |
279 ± 68 |
20.5 ± 1.5 |
10.0 ± 0.5 |
15.5 ± 1.5 |
30.5 ± 3.5 |
Table 2: Antitumor activity of DTX alone or in combination with KPT330 or KPT251 in DU145 and PC3DTXR xenografts
Cell line |
Drug |
Weight of mice (gr +/- SE) |
Tumor weight (mg +/- SE) |
TTP (days +/_ SE) |
Vessel count (+/- SE) |
Ki67 (% +/- SE) |
Apoptosis (% +/- SE) |
|---|---|---|---|---|---|---|---|
DU145 |
Vehicle |
24.5 ± 0.5 |
798 ± 210 |
12.6 ± 3.3 |
24.9 ± 2.4 |
36.5 ± 3.5 |
<2 |
DTX |
25.3 ± 0.5 |
331 ± 86 |
17.6 ± 2.1 |
11.5 ± 1.5 |
16.4 ± 2.5 |
8.5 ± 1.5 |
|
KPT-330 |
23.8 ± 0.5 |
477 ± 145 |
16.4 ± 2.6 |
6.8 ± 1.2 |
22.0 ± 3.0 |
4.0 ±1.0 |
|
KPT-251 |
21.5 ± 1.0 |
360± 82 |
15.6 ± 3.2 |
7.0 ± 0.5 |
16.5 ± 1.8 |
7.5 ± 0.5 |
|
DTX + KPT-330 |
21.5 ± 0.5 |
178 ± 52 |
22.6 ± 4.1 |
4,8 ± 0.2 |
11.8 ± 2.8 |
19.5 ± 2.5 |
|
DTX + KPT-251 |
21.0± 0.5 |
224 ± 67 |
21.6 ± 3.5 |
3.0 ± 0.1 |
9.5 ± 0.5 |
24.5 ± 2.0 |
|
PC3DTXR |
Vehicle |
25.0 ± 1.0 |
1150± 192 |
8.0 ± 1.0 |
35.5 ± 3.0 |
50.0 ± 3.0 |
< 2 |
DTX |
25.3 ± 0.5 |
1227 ± 270 |
8.5 ± 2.0 |
38.0 ± 2.0 |
54.5 ± 2.5 |
<2 |
|
KPT-330 |
24.0 ± 0.5 |
775 ± 110 |
13.0 ± 1.5 |
16.0 ± 0.5 |
28.0 ± 1.5 |
12.0 ± 2.5 |
|
KPT-251 |
22.0 ± 1.0 |
825 ± 120 |
11.0 ± 1.0 |
22.0 ± 2.5 |
35.0 ± 4.0 |
8.5 ± 1.0 |
|
DTX + KPT-330 |
22.5 ± 0.5 |
450 ± 50 |
17.5 ± 2.0 |
5,5 ± 0.5 |
8.0 ± 1.0 |
38.0 ± 5.0 |
|
DTX + KPT-251 |
21.0± 1.0 |
545± 88 |
15.5 ± 1.5 |
8.0 ± 0.5 |
13.0 ± 2.0 |
21.0 ± 3.0 |
In Figure 7 we show the Kaplan Meyer graphic representation of the Time to Progression calculated in the single animal groups whereas the calculation of Hazard ratios and statistics were enclosed in the Table 3. To explore cellular mechanisms that could account for the anti-tumor effects we assessed immuno-histochemically the tumor cells proliferation (Ki67); apoptosis (TUNEL and cleaved-caspase 3) and angiogenesis modification (mouse CD31). Data are summarized in Tables 1 and 2 whereas some pictures of treated and untreated tumors are shown in Figure 8).
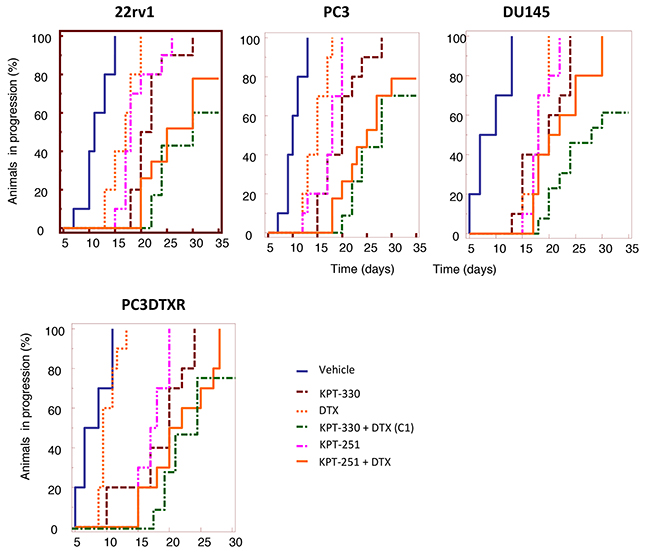
Figure 7: In vivo experiments. Kaplan-Meier estimates for rates of progression in 22rv1 PC3, DU145 and PC3DTXR subcutaneous tumors.
Table 3: Statistical analysis performed on Time to Progression Kaplan Meyer curved generated for DTX sensitive Pca cells and DTX resistant PC3 cell line
PC3 |
22rv1 |
DU145 |
PC3DTXR |
|||||
|---|---|---|---|---|---|---|---|---|
Comparison |
Hazard ratio |
Significance |
Hazard ratio |
Significance |
Hazard ratio |
Significance |
Hazard ratio |
Significance |
DTX vs vehicle |
3.16 |
P=0.0008 |
3.36 |
P=0.0002 |
6.06 |
P<0.0001 |
1.75 |
P=0.2028 (NS) |
KPT330 vs vehicle |
7.82 |
P<0.0001 |
7.84 |
P<0.0001 |
8.49 |
P<0.0001 |
5.66 |
P<0.0001 |
KPT-330 vs DTX |
2.48 |
P=0.0025 |
2.33 |
P=0.0086 |
1.40 |
P=0.1954 (NS) |
3.24 |
P<0.0001 |
C1 vs vehicle |
17.96 |
P<0.0001 |
18.52 |
P<0.0001 |
19.52 |
P<0.0001 |
10.71 |
P<0.0001 |
C1 vs DTX |
5.70 |
P<0.0001 |
5.51 |
P<0.0001 |
3.22 |
P<0.0001 |
6.12 |
P<0.0001 |
C1 vs KPT-330 |
2.30 |
P<0.0001 |
2.36 |
P=0.0055 |
2.30 |
P=0.0012 |
1.89 |
P=0.0175 |
KPT-251 vs vehicle |
5.37 |
P<0.0001 |
5.20 |
P<0.0001 |
6.68 |
P<0.0001 |
4.62 |
P<0.0001 |
KPT-251 vs DTX |
1.70 |
P=0.1846 (NS) |
5.51 |
P<0.0001 |
1.10 |
P=0.7665 (NS) |
3.24 |
P<0.0001 |
C2 vs vehicle |
13.24 |
P<0.0001 |
12.87 |
P<0.0001 |
12.36 |
P<0.0001 |
8.33 |
P<0.0001 |
C2 vs DTX |
4,20 |
P<0.0001 |
3.83 |
P<0.0001 |
2.04 |
P=0.0884 (NS) |
4.76 |
P<0.0001 |
C2 vs KPT-251 |
2.46 |
P=0.0036 |
2.47 |
P=0.0040 |
1.85 |
P=0.1428 (NS) |
1.80 |
P=0.0116 (NS) |
C2 vs C1 |
1.36 |
P=0.2554 (NS) |
1.44 |
P=0.2120 (NS) |
1.58 |
P=0.2265 (NS) |
1.37 |
P=0.5449 (NS) |
KPT-251 vs KPT-330 |
1.46 |
P=0.0213 (NS) |
1.51 |
P=0.1877 (NS) |
1.27 |
P=0.7688 (NS) |
1.23 |
P=0.6290 (NS) |
Immunohistochemical analyses show that combined treatment shrinks tumors and exposition of blood vessels, significantly decreased the percentage of Ki67 positive cells when compared to controls or single drug treatments suggesting reduced cell proliferation. (Figure 8A, Tables 1 and 2). Increased apoptosis, detected by TACS BlueLabel-based TUNEL kit assay was also observed (Tables 1 and 2) and was higher in combination treatments when compared to single administrations. In particular in DU145 xenografts, selinexor alone decreased Ki67 expression by 68% whereas apoptosis increased by 4 folds and decreased micro vessel density by 64% (Table 2). DTX decreased Ki67 by 66% expression, increased apoptosis by about 2-folds and decreased micro vessel density to about 44%. The combination of selinexor plus DTX increased antiproliferative activity reducing Ki67 expression by 77% and micro vessel density by 88%; whereas, it increased apoptosis by about 4 folds. The same analyses performed on PC3 and 22rv1 shows similar results with different efficacy (Table 1). We also analyzed the drug effects on the PC3 DTXR model (Table 2). These analyses demonstrate that selinexor alone decreased Ki67 by 44% whereas apoptosis increased by 12 times and decreased micro vessel density by 38%. DTX shows similar Ki67 expression, and micro vessel density. The combination of selinexor plus DTX restored the antiproliferative activity, reducing Ki67 expression and micro vessel density by 84% whereas, it increased apoptosis by 3 times. In addition we observed that total expression of XPO1 was also decreased in combined treatments (Figure 8A) as result of the possible DTX-mediated nuclear accumulation (our in vitro data, see above) and selinexor-mediated XPO1 degradation. Next we demonstrated increased expression of Foxo3a in xenograft tissue of mice receiving DTX, The localization was both nuclear and cytoplasmatic. Nuclear expression of Foxo3a was increased in selinexor treated tumors whereas a reduced nuclear and cytoplasmatic expression of Foxo3a was observed in the combined treatment as result of a probable increase in Foxo3a degradation. In Figure 8A we show the IHC pictures obtained in PC3DTXS xenografts. A similar behavior was observed for β-catenin and cyclin D1 expression after combination treatment selinexor and DTX due to increased protein degradation as shown in Figure 8B in 22rv1DTXS xenograft. Increased caspase 3 expression was also demonstrated in combined administration respect to those observed in controls and single treatment as shown in Figure 8C in DU145DTXS xenograft. These results indicate the combination had a greater impact on tumor proliferation and apoptosis then single agents.
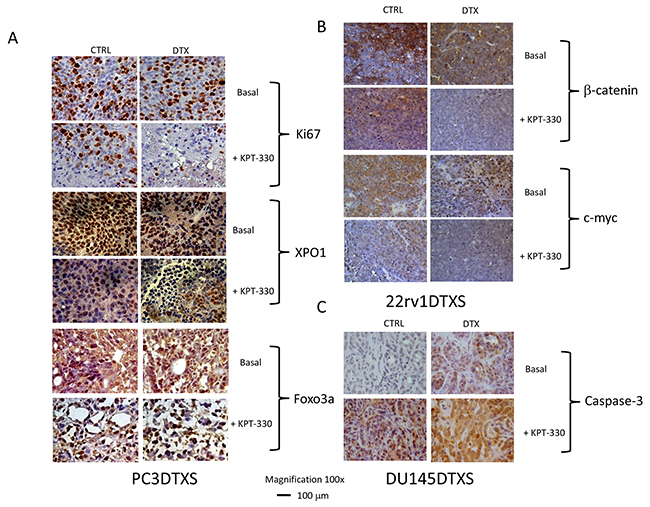
Figure 8: Immunohistochemical analyses of PCa xenograft treated with DTX, KPT330 or combinations in vivo. (A) Evaluation of Ki67, XPO1 and Foxo3a in PC3DTXS xenografts. (B) β-catenin and c-myc expression in 22rv1DTXS xenografts. (C) Caspase-3 expression in DU145DTXS xenografts.
DISCUSSION
Paclitaxel (PTX), an alkaloid that targets microtubules, and its synthetic analogues (i.e. docetaxel, DTX) are anticancer drugs validated against several human solid tumors. This family of compounds alters and disrupts mitosis, cell motility, and the cell proliferation. DTX-resistant (DTXR) cancers highlight the rapid onset of multiple cross-resistance and the high percentage of failures even in therapies that involve drug combinations. Indeed, drug resistance is the most important obstacle for treatment of cancer, including CRPC. Several molecular mechanisms have been identified and are related to increased activation of pathways involved in DNA damage repair and cell survival. An important role is played by increased expression and/or activity of multi-drug resistance proteins such as ABCB1 [60, 61]. In our study, we demonstrated the possibility that acquired DTXR may be overcome by a combinatorial therapy including SINE compounds (XPO1 inhibitors) selinexor (KPT-330) or KPT-251, with the DTX. CRPC drug-sensitive cell lines with their drug-resistant strains were used in this study. Functionally, DTX interferes with microtubule assemblage. It has been demonstrated that paclitaxel resistant PC3 cells show decreased expression of acetylated α-tubulin and the cell cycle regulator p21, and increased expression of βIII tubulin, histone deacetylase 6 (HDAC6), and the anti-apoptotic protein Bcl2. In our cell models α-tubulin was lower cells whereas βIII tubulin and HDAC6 were higher in resistant cells when compared with levels observed in parental cells. Similarly, these proteins were modulated during the treatment with DTX in sensitive cells from short term to long term culture (data not shown). DTX-mediated microtubule rearrangement alters cell division resulting in double-strand DNA breaks and subsequent apoptotic cell death. It has been widely demonstrated that metastatic CRPC can have deep genomic aberrations that interfere with DNA repair [62, 63]. In addition, several tumor suppressor proteins (TSP) and growth regulatory proteins (GRP) are mislocalized in cancer cells by overexpression and activity of XPO-1 [15–31]. Nuclear and cytoplasmic expression of XPO-1 is elevated in prostate tumors when compared to normal and hyperplastic tissue [37]. Here we demonstrate that XPO-1 is overexpressed in DTX resistant CRPC cells and differentially localize into the cytoplasm where, several proteins targeted by this cargo, are overexpressed. Some of these proteins (i.e. survivin) are able to reduce apoptosis whereas others increase drug efflux. SINE compounds, which inhibit XPO1 activity, have been demonstrated to have anticancer effects in models of PCa [23, 37]. In this report, we further demonstrate that XPO-1 is a potential target for the treatment of aggressive CRPC cells in association with DTX. DTX sensitive and DTX Resistant cells were also considered for the evaluation of in vitro effects. When XPO-1 inhibitors were used in combination with DTX, DNA damage signaling was increased (increased phospho-H2AX (ϒH2AX) levels), but the rate of DNA repair was significantly reduced since ϒH2AX levels were maintained for prolonged times when compared to DTX alone. This results in increased apoptosis and improves the effectiveness of DTX. This two-drug combination was also highly effective against DTX-resistant CRPC cells. Reduction in tumor growth was dose-dependent and associated with inhibition of cellular proliferation and activation of apoptosis, which correlated with PARP and caspase-3 cleavage. SINE compounds are potent therapeutic tools to treat aggressive/castration resistant PCa cells. This appears to be due to the modulation of a multiple signaling pathways including time-dependent cyclin D1 and survivin decreases in expression. It has been demonstrated that cyclin D1 knockdown/decrement reduces cell proliferation and increases sensitivity to chemotherapy [64] and when sequestered in the cytoplasm [65] induces apoptosis. It has been observed that selinexor and KPT-251 reduces the export of cyclin D1 and P21WAF1 from the nucleus and reduce overall expression of cyclin D1 following prolonged exposure. Abnormalities in the regulation of cyclin D1 expression [66] and cell-cycle inhibitory genes (p21WAF1, p16INK4a, and p27KIP1) have been reported in PCa [67]. P21WAF1 mainly localizes to the cytoplasm where it play an anti-apoptotic role. However, when localized in the nucleus, P21WAF1 prevents cell cycle progression at the G1 phase. Similarly nuclear localization of P27KIP1 enables this regulatory function.
High levels of survivin expression are independent risk factors for poor prognosis in several cancers and the cytoplasmic localization of survivin is particularly high in prostate tumors [68], whereas increased nuclear expression of survivin is a favorable prognostic factor [68]. These observations suggest that nuclear survivin is suppressive for tumor growth and further targeting the cytoplasmic, antiapoptotic fraction of survivin would be an ideal therapeutic avenue. Treatment with selinexor or KPT-251 initially promotes survivin nuclear localization, but at later time points leads to a reduction in its protein levels, which correlates with the timing of cellular antitumor effects of these compounds. Together, this supports a hypothesis in which XPO-1 inhibition leads to a loss of survivin levels, thus inhibiting tumor growth and enhanced apoptosis. Reduced expression of TUB3, survivin and cyclin D1 conditions tumor cells to be more responsive to DTX. In addition the antitumor and chemosensitizing effects of SINE compounds are sustained by other molecular changes. Foxo3a is overexpressed in DTX resistant cells where PI3K/Akt/mTOR signaling pathways are constitutively activated. In this state, Foxo3a is constitutively inactive being in the cytoplasm. We observed that KPT-251 and selinexor significantly increase nuclear localization of FOXO3a, where it becomes active and this is due also by reduced activation of PI3K/Akt/mTOR signaling pathways with increased nuclear accumulation of Foxo3a. We observed also that knockdown of FOXO3a expression using small interfering RNA attenuated sensitively the docetaxel efficacy (data not shown).
A better understanding of the downstream cellular targets of docetaxel and SINE compounds will provide information on its mechanism of action and the potential of combined treatment in CRPC. Analogous to observed effects in lung cancer following cisplatin treatment, nuclear accumulation of FOXO3a can be an important player for SINE-dependent DTX sensitization in DTXR PCa cells. The molecular mechanisms regulating FOXO3a cellular localization, however, are complex and largely unknown. XPO-1 plays a key role in the shuttling proteins, including Foxo3a, from the nucleus to the cytoplasm. The phosphorylation of FOXO3a on the Ser7, S253 or Tyr32 residues can lead to the nuclear localization of FOXO3a. Ser7 phosphorylation-deficient mutants seem to be still able to activate the expression of Foxo3a target genes [69]. In contrast, S253 and Thr32 [70] have been shown to play a significant role in the nuclear translocation of Foxo3a. It has also been shown that the inhibition of FOXO3a phosphorylation at Thr32, observed after Akt inhibition, induces FOXO3a nuclear accumulation in lung cancer cells with increased expression of the FOXO3a-dependent apoptotic protein Bim. DTX and SINE compounds induce Foxo3a nuclear accumulation and the activity of apoptotic signaling proteins. Moreover, this class of compounds has been used in combination studies with standard chemotherapies, for example with Topoisomerase II and Proteasome Inhibitors [71]. Altogether, this data suggests that SINE compounds, in combination with DTX, could be used as therapeutic tools for advanced/castration resistant prostate tumors.
MATERIALS AND METHODS
Reagents and drug preparation
All materials for tissue culture were purchased from Hyclone (Cramlington, NE, USA). Plasticware was obtained from Nunc (Roskilde, Denmark). Antibodies including: H3 histone [FL-136, sc-10809], c-myc [9E10, sc-40], β-catenin [H-102, sc-7199] p-GSK3β Ser9 [sc11757], GSK3β [H76, sc-9166], XPO-1 [sc-5595], p53 [sc126], p-Akt Ser473 [sc-135651], p-Akt Thr308 [sc135650], PARP-1 [H-250, sc-7150], DNA-PKCs [H-163, sc-9051], Chk1 [G-4, sc-8408], Chk2 [A-12, sc-5278], Topoisomerase 2A [T22C5, sc-65743], ABCB1 known as Mdr-1 [D-11, sc-55510], HDAC6 [H-300, sc-11420], βIII tubulin [TU-20, sc-51670], α-tubulin [B-7, sc-5286] and acetylated α-tubulin were purchased from Santa Cruz (SantaCruz, CA, USA). Antibodies targeting Foxo3a [ab37409], p-FOXO3A [ab31109], p(S345)-Chk1 [ab47318] and p(Thr68-Chk2 [ab32148] were purchased from Abcam (Cambridge UK). Antibodies against Cyclin D1 [2878], AMPKα [5832], phospho-AMPKα (Thr172) [2535] were purchased from Cell Signaling (Danvers, MA, USA). The Ki67 antibody (clone MIB-1) was purchased from Dako (Dako Italia, Cernusco sul Naviglio [MI], Italy). Tunel assay kit [S71003] was purchased from Merck KGaA (Darmstadt, Germany). Survivin antibody was purchased from Biorbyt.
SINE compounds (KPT-251 and selinexor) were provided by Karyopharm Therapeutics Inc., Newton, MA whereas DTX was purchased from Selleck Chemicals (Aurogene, Rome, Italy). For in vitro studies, all compounds were dissolved in DMSO and stored at -20°C until use
Cell lines
Three commercial (22rv1, DU145 and PC3) models for CRPC were purchased from DSMZ and ATCC. PC3, 22rv1 and DU145 DTX-resistant cells (DTXR) were selected by cultivating PCa cells in the presence of 10 nM DTX as previously described [51, 52]. Selected clones were pooled and maintained for under continuous 10 nM docetaxel exposure followed by incremental doses of DTX for at least six months. To minimize the risk of misidentified and/or contaminated cell lines, DNA profiling was periodically carried out in-house to authenticate cell cultures. DNA was isolated from cell lines using a standard DNA isolation kit. STR profiling was performed using GenePrint® 10 System (Promega Corporation, Madison, WI). An eight-capillary 3500 Genetic Analyzer (Applied Biosystems Life Technologies Europe BV, Monza, Italy) was used to separate and identify alleles using standard procedures. GenePrint® 10 System allows co-amplification and detection of eight human loci required by the guidelines ASN-0002. For non-commercial cell lines, the authentication process was carried out by comparing STR-fingerprints with those published by Adri van Bokhoven and co-workers [53]. In addition, cell lines were stocked at very low passages and used at <15-20 subcultures.
Growth assays
Cells were seeded at a density of 2 x 10⁴ cells/mL in 24-well plates. Cells were left to attach and grow in 5% FCS DMEM for 24 h. After this time, cells were maintained in the appropriate culture conditions. Morphological controls were performed every day with an inverted phase-contrast photomicroscope (Nikon Diaphot, Tokyo, Japan). Cells were trypsinized and resuspended in 1.0 ml of saline, then counted using a NucleoCounterTM NC-100 (automated cell counter systems, Chemotec, Gydevang, Denmark). The effect on cell proliferation was measured by taking the mean cell number with respect to controls over time for the different treatment groups. The half-maximal inhibitory concentration (IC50; concentration of drug required for a 50% reduction in growth/viability) values and combination index (CI) values of the SINE molecules when used alone and in combination with other drugs were determined by using the Dojindo Cell Counting Kit-8 (Dojindo EU GmbH, Munich, Germany).
For drug combination experiments, cell viability assays were performed as described above, and the results were analyzed for synergistic, additive, and antagonistic effects using the CI method developed by Chou and Talalay [54].
Cell viability and apoptosis assay
Viable cells were counted using the NucleoCounterTM NC-100 (automated cell counter systems, Chemotec, Cydevang, DK). Apoptosis was evaluated by using Tali® Apoptosis Kit - Annexin V Alexa Fluor® 488 & Propidium Iodide-based, (Life Technologies Italia, Monza, Italy). Stained cells were then measured on a Tali® Image-Based Cytometer. Apoptosis was further confirmed by FACS analysis following the instructions of the manufacturer.
Western blot
Cytoplasmic and nuclear protein extracts were obtained by using the Nuclear/Cytosol Fractionation Kit from Biovision Inc. (Milpitas, CA, USA). Cell extracts and conditioned media from treated and untreated cells were electrophoresed under reducing conditions and transferred to nitrocellulose filter (Schleicher and Schuell GmbH, Dassel, Germany). Reactive bioluminescent bands were visualized by using the detection kit (Supersignal, Perbio Science, Tattenhall, UK) using Bio-Rad gel DocTM (Bio-Rad Laboratories S.r.l., Milan, Italy).
Xenograft model
Male CD1 nude mice (Charles River, Milan, Italy) were maintained under the guidelines established by the University of L’Aquila, Medical School and Science and Technology School Board Regulations. Experiments on animals have been approved by your local IRB in compliance with the Italian government regulation n.116 January 27, 1992 for the use of laboratory animals which is line with ARRIVE guidelines. All mice received subcutaneous flank injections of 1 x 10⁶ PC3, DU145, 22v1 cells or PC3DTXR. Tumor growth was measured bi-weekly with a Vernier caliper (length x width). Tumor weight was calculated according to the formula: TW (mg) = tumor volume (mm3) = d2 x D/2, where d and D are the shortest and longest diameters, respectively. The effects of the treatments were examined as previously described [55, 56]. Animals were sacrificed by carbon dioxide inhalation and tumors were subsequently removed surgically. A piece of tumor was frozen in liquid nitrogen for protein analysis and another piece was fixed in paraformaldehyde overnight for immunohistochemical analyses.
Treatments
Mice were treated by oral gavage with either vehicle control (Pluronic F-68/PVP-K29/ 32), selinexor or KPT-251. Groups of 10 animals were considered. Before tumor injection, animals were randomized to receive (i) vehicle (PBS 1 mL/kg i.p., 2/week and povidone/pluronic F68 1 mL/kg p.o., 3/week), (ii) selinexor (10 mg/Kg, q 2d × 3 weeks, po), (iii) docetaxel (i.p. injection of 7.5 mg/kg per week), (iv) selinexor (110 mg/Kg, q 2d × 3 weeks, po) + DTX (i.p. injection of 7.5 mg/kg per week). KPT-251, was also tested at 30 mg/kg q2d × 3 weeks, po and in the same combinations. Treatments were started when tumor volumes reached approximately 80 mm3 (Day 0) and were stopped after 28 days. The following parameters were used to quantify the antitumor effects upon different treatments: (1) tumor volume measured during and at the end of experiments, (2) tumor weight measured at the end of experiment, (3) complete response (CR) defined as the disappearance of the target lesion with respect to baseline, (4) tumor progression (TP) defined as an increase of greater than 50% of tumor volume with respect to baseline, (5) time to progression (TTP). In vivo, combinational studies were evaluated by CalcuSyn (Biosoft). For the calculation of CI, the values of cell kill for a fixed tumor volume were considered (determined by the log cell kill (LCK)). LCK was determined as LCKZ (TKC)/(3.3KTd), where Td represents the mean control group doubling time required to reach a fixed tumor volume, expressed in days, whereas T and C are the same values as described above [55].
Immunohistochemical analyses
Indirect immunoperoxidase staining of tumor xenografts samples was performed on paraffin embedded tissue sections (4 μm). Briefly, sections were incubated with primary antibodies overnight at 4°C. Next, avidin–biotin assays were done using the Vectastain Elite kit obtained from Vector Laboratories. Mayer’s hematoxylin was used as nuclear counterstain. Ki67 labeling index was determined by counting 500 cells at 100X and determining the percentage of cells staining positively for Ki67. Apoptosis was determined by using the TACS TdT in situ TACS Blue Label kit (code 4811-30-K; R&D Systems, Inc. Minneapolis, MN). Apoptosis was measured as the percentage of tunnel positive cells +/- SD measured on five random fields (400 X).
Tumor microvessels were counted at ×400 in five arbitrarily selected fields and the data were presented as number of CD31+ microvessels / ×100 microscopic field for each group. The presence of red cells in tumor tissue and in blood vessels as well as the presence of micro-thrombi and bleeding zones was demonstrated by Martius yellow-brilliant crystal scarlet blue technique. Tumor hemoglobin levels were quantified as described elsewhere [41].
Statistical analysis
Continuous variables were summarized as the mean and SD or 95% CI for the mean. Statistical comparisons between controls and treated groups were established by carrying out the ANOVA test or by Student’s t-test for unpaired data (for two comparisons). Dichotomous variables were summarized by absolute and/or relative frequencies. For dichotomous variables, statistical comparisons between control and treated groups were established by carrying out the exact Fisher’s test. For multiple comparisons, the level of significance was corrected by multiplying the P value by the number of comparisons performed (n) according to the Bonferroni correction. Overall survival was determined by Kaplan–Meier analysis and a Gehan’s generalized Wilcoxon test. When more than two survival curves were compared, the Logrank test for trend was used. This tests the probability that there is a trend in survival scores across the groups. All tests were two-sided and were determined by Monte Carlo significance. P values <0.05 were considered statistically significant. In the figures in which statistical analysis was performed, significance is indicated by an asterisk. SPSS (statistical analysis software package, IBM Corp., Armonk, NY, USA) version 10.0 and StatDirect (version. 2.3.3, StatDirect Ltd, Altrincham, Manchester, UK) were used for statistical analysis and graphical presentation.
Author contributions
C. Festuccia, GL Gravina, M.G. Kauffman and S. Shacham have made substantial contributions to conception and design of experiments, interpretation of results and have been involved in drafting the manuscript and revising it critically for important intellectual content.
A. Mancini, C Colapietro, L Biordi, R Iorio and F Marampon have made substantial contributions to acquisition of in vivo and in vitro data.
Y. Landesman, A Vetuschi and S Pompili have made substantial contribution to obtaining of immunohistochemical data on tissue harvested from xenograft treated with Sine or controls (Landesman Y.).
C. Argueta and V. Flati have completely revised from a scientific and linguistic point of view this report.
Study supervision: C. Festuccia.
All authors have read and approved the manuscript.
CONFLICTS OF INTEREST
Yosef Landesman, Christian Argueta, Michael G Kauffman and Sharon Shacham are employees of Karyopharm Therapeutics, Newton, MA, USA. Other authors declare that they have no competing interests.
FUNDING
The cost of this research is partially funding by Karyopharm Therapeutics.
REFERENCES
1. Grozescu T, Popa F. Prostate cancer between prognosis and adequate/proper therapy. J Med Life. 2017; 10:5–12.
2. Vlachostergios PJ, Puca L, Beltran H. Emerging variants of castration-resistant prostate cancer. Curr Oncol Rep. 2017; 19:32. https://doi.org/10.1007/s11912-017-0593-6.
3. Poorthuis MH, Vernooij RW, van Moorselaar RJ, de Reijke TM. First-line non-cytotoxic therapy in chemotherapy-naive patients with metastatic castration-resistant prostate cancer: a systematic review of 10 randomised clinical trials. BJU Int. 2017; 119:831–45. https://doi.org/10.1111/bju.13764.
4. Lohiya V, Aragon-Ching JB, Sonpavde G. Role of chemotherapy and mechanisms of resistance to chemotherapy in metastatic castration-resistant prostate cancer. Clin Med Insights Oncol. 2016; 10:57–66.
5. Chandrasekar T, Yang JC, Gao AC, Evans CP. Mechanisms of resistance in castration-resistant prostate cancer (CRPC). Transl Androl Urol. 2015; 4:365–80. https://doi.org/10.3978/j.issn.2223-4683.2015.05.02.
6. Kroon J, Kooijman S, Cho NJ, Storm G, van der Pluijm G. Improving taxane-based chemotherapy in castration-resistant prostate cancer. Trends Pharmacol Sci. 2016; 37:451–62. https://doi.org/10.1016/j.tips.2016.03.003.
7. Hotte SJ. Addressing taxane resistance in metastatic castration-resistant prostate cancer: a focus on chaperone proteins. Future Oncol. 2017; 13:369–79.
8. Hour TC, Chung SD, Kang WY, Lin YC, Chuang SJ, Huang AM, Wu WJ, Huang SP, Huang CY, Pu YS. EGFR mediates docetaxel resistance in human castration-resistant prostate cancer through the Akt-dependent expression of ABCB1 (MDR1). Arch Toxicol. 2015; 89:591–605. https://doi.org/10.1007/s00204-014-1275-x.
9. Zhou J, Chen X, Gilvary DL, Tejera MM, Eksioglu EA, Wei S, Djeu JY. HMGB1 induction of clusterin creates a chemoresistant niche in human prostate tumor cells. Sci Rep. 2015; 5:15085.
10. Desarnaud F, Geck P, Parkin C, Carpinito G, Makarovskiy AN. Gene expression profiling of the androgen independent prostate cancer cells demonstrates complex mechanisms mediating resistance to docetaxel. Cancer Biol Ther. 2011; 11:204–12.
11. Yin B, Zhang M, Zeng Y, Li Y, Zhang C, Song Y. Downregulation of cytokeratin 18 is associated with paclitaxel-resistance and tumor aggressiveness in prostate cancer. Int J Oncol. 2016; 48:1730–6. https://doi.org/10.3892/ijo.2016.3396.
12. Okugawa K, Kobayashi H, Hirakawa T, Sonoda T, Ogura T, Nakano H. In vivo establishment and characterization of a paclitaxel-resistant human ovarian cancer cell line showing enhanced growth properties and drug-resistance only in vivo. J Cancer Res Clin Oncol. 2004; 130:178–86.
13. Domingo-Domenech J, Vidal SJ, Rodriguez-Bravo V, Castillo-Martin M, Quinn SA, Rodriguez-Barrueco R, Bonal DM, Charytonowicz E, Gladoun N, de la Iglesia-Vicente J, Petrylak DP, Benson MC, Silva JM, Cordon-Cardo C. Suppression of acquired docetaxel resistance in prostate cancer through depletion of notch- and hedgehog-dependent tumor-initiating cells. Cancer Cell. 2012; 22:373–88. https://doi.org/10.1016/j.ccr.2012.07.016.
14. Sims-Mourtada J, Opdenaker LM, Davis J, Arnold KM, Flynn D. Taxane-induced hedgehog signaling is linked to expansion of breast cancer stem-like populations after chemotherapy. Mol Carcinog. 2015; 54:1480–93. https://doi.org/10.1002/mc.22225.
15. Hatano K, Yamaguchi S, Nimura K, Murakami K, Nagahara A, Fujita K, Uemura M, Nakai Y, Tsuchiya M, Nakayama M, Nonomura N, Kaneda Y. Residual prostate cancer cells after docetaxel therapy increase the tumorigenic potential via constitutive signaling of CXCR4, ERK1/2 and c-Myc. Mol Cancer Res. 2013; 11:1088–100. https://doi.org/10.1158/1541-7786.
16. Karanika S, Karantanos T, Kurosaka S, Wang J, Hirayama T, Yang G, Park S, Golstov AA, Tanimoto R, Li L, Thompson TC. GLIPR1-ΔTM synergizes with docetaxel in cell death and suppresses resistance to docetaxel in prostate cancer cells. Mol Cancer. 2015; 14:122. https://doi.org/10.1186/s12943-015-0395-0.
17. Stelma T, Chi A, van der Watt PJ, Verrico A, Lavia P, Leaner VD. Targeting nuclear transporters in cancer: diagnostic, prognostic and therapeutic potential. IUBMB Life. 2016; 68:268–80. https://doi.org/10.1002/iub.1484.
18. Noske A, Weichert W, Niesporek S, Roske A, Buckendahl AC, Koch I, Sehouli J, Dietel M, Denkert C. Expression of the nuclear export protein chromosomal region maintenance/exportin 1/Xpo1 is a prognostic factor in human ovarian cancer. Cancer. 2008; 112:1733–43.
19. Santiago A, Li D, Zhao LY, Godsey A, Liao D. p53 SUMOylation promotes its nuclear export by facilitating its release from the nuclear export receptor CRM1. Mol Biol Cell. 2013; 24:2739–52.
20. Lohrum MA, Woods DB, Ludwig RL, Bálint E, Vousden KH. C-terminal ubiquitination of p53 contributes to nuclear export. Mol Cell Biol. 2001; 21:8521–32.
21. Alt JR, Gladden AB, Diehl JA. p21(Cip1) promotes cyclin D1 nuclear accumulation via direct inhibition of nuclear export. J Biol Chem. 2002; 277:8517–23.
22. De Cesare M, Cominetti D, Doldi V, Lopergolo A, Deraco M, Gandellini P, Friedlander S, Landesman Y, Kauffman MG, Shacham S, Pennati M, Zaffaroni N. Anti-tumor activity of selective inhibitors of XPO1/CRM1-mediated nuclear export in diffuse malignant peritoneal mesothelioma: the role of survivin. Oncotarget. 2015; 6:13119–32. https://doi.org/10.18632/oncotarget.3761.
23. Gravina GL, Mancini A, Sanita P, Vitale F, Marampon F, Ventura L, Landesman Y, McCauley D, Kauffman M, Shacham S, Festuccia C. KPT-330, a potent and selective exportin-1 (XPO-1) inhibitor, shows antitumor effects modulating the expression of cyclin D1 and survivin in prostate cancer models. BMC Cancer. 2015; 15:941. https://doi.org/10.1186/s12885-015-1936-z.
24. Mori K, Hirao E, Toya Y, Oshima Y, Ishikawa F, Nose K, Shibanuma M. Competitive nuclear export of cyclin D1 and Hic-5 regulates anchorage dependence of cell growth and survival. Mol Biol Cell. 2009; 20:218–32. https://doi.org/10.1091/mbc.E08-04-0428.
25. Liu X, Chong Y, Tu Y, Liu N, Yue C, Qi Z, Liu H, Yao Y, Liu H, Gao S, Niu M, Yu R. CRM1/XPO1 is associated with clinical outcome in glioma and represents a therapeutic target by perturbing multiple core pathways. J Hematol Oncol. 2016; 9:108.
26. Neufeld KL. Nuclear APC. Adv Exp Med Biol. 2009; 656:13–29.
27. Walker CJ, Oaks JJ, Santhanam R, Neviani P, Harb JG, Ferenchak G, Ellis JJ, Landesman Y, Eisfeld AK, Gabrail NY, Smith CL, Caligiuri MA, Hokland P, et al. Preclinical and clinical efficacy of XPO1/CRM1 inhibition by the karyopherin inhibitor KPT-330 in Ph+ leukemias. Blood. 2013; 122:3034–44. https://doi.org/10.1182/blood-2013-04-495374.
28. Clavel S, Siffroi-Fernandez S, Coldefy AS, Boulukos K, Pisani DF, Dérijard B. Regulation of the intracellular localization of Foxo3a by stress-activated protein kinase signaling pathways in skeletal muscle cells. Mol Cell Biol. 2010; 30:470–80. https://doi.org/10.1128/MCB.00666-09.
29. Wang Y, Wang Y, Xiang J, Ji F, Deng Y, Tang C, Yang S, Xi Q, Liu R, Di W. Knockdown of CRM1 inhibits the nuclear export of p27(Kip1) phosphorylated at serine 10 and plays a role in the pathogenesis of epithelial ovarian cancer. Cancer Lett. 2014; 343:6–13.
30. Cheng Y, Holloway MP, Nguyen K, McCauley D, Landesman Y, Kauffman MG, Shacham S, Altura RA. XPO1 (CRM1) inhibition represses STAT3 activation to drive a survivin-dependent oncogenic switch in triple-negative breast cancer. Mol Cancer Ther. 2014; 13:675–86.
31. Nguyen KT, Holloway MP, Altura RA. The CRM1 nuclear export protein in normal development and disease. Int J Biochem Mol Biol. 2012; 3:137–51.
32. Bouayad D, Pederzoli-Ribeil M, Mocek J, Candalh C, Arlet JB, Hermine O, Reuter N, Davezac N, Witko-Sarsat V. Nuclear-to-cytoplasmic relocalization of the proliferating cell nuclear antigen (PCNA) during differentiation involves a chromosome region maintenance 1 (CRM1)-dependent export and is a prerequisite for PCNA antiapoptotic activity in mature neutrophils. J Biol Chem. 2012; 287:33812–25.
33. Taylor-Kashton C, Lichtensztejn D, Baloglu E, Senapedis W, Shacham S, Kauffman MG, Kotb R, Mai S. XPO1 inhibition preferentially disrupts the 3D nuclear organization of telomeres in tumor cells. J Cell Physiol. 2016; 231:2711–9.
34. Kim J, McMillan E, Kim HS, Venkateswaran N, Makkar G, Rodriguez-Canales J, Villalobos P, Neggers JE, Mendiratta S, Wei S, Landesman Y, Senapedis W, Baloglu E, et al. XPO1-dependent nuclear export is a druggable vulnerability in KRAS-mutant lung cancer. Nature. 2016; 538:114–7.
35. Gao W, Lu C, Chen L, Keohavong P. Overexpression of CRM1: a characteristic feature in a transformed phenotype of lung carcinogenesis and a molecular target for lung cancer adjuvant therapy. J Thorac Oncol. 2015; 10:815–25.
36. Brodie KM, Henderson BR. Characterization of BRCA1 protein targeting, dynamics, and function at the centrosome: a role for the nuclear export signal, CRM1, and Aurora A kinase. J Biol Chem. 2012; 287:7701–16. https://doi.org/10.1074/jbc.M111.327296.
37. Gravina GL, Tortoreto M, Mancini A, Addis A, Di Cesare E, Lenzi A, Landesman Y, McCauley D, Kauffman M, Shacham S, Zaffaroni N, Festuccia C. XPO1/CRM1-selective inhibitors of nuclear export (SINE) reduce tumor spreading and improve overall survival in preclinical models of prostate cancer (PCa). J Hematol Oncol. 2014; 7:46. https://doi.org/10.1186/1756-8722-7-46.
38. Yao Y, Dong Y, Lin F, Zhao H, Shen Z, Chen P, Sun YJ, Tang LN, Zheng SE. The expression of CRM1 is associated with prognosis in human osteosarcoma. Oncol Rep. 2009; 21:229–35.
39. Huang WY, Yue L, Qiu WS, Wang LW, Zhou XH, Sun YJ. Prognostic value of CRM1 in pancreas cancer. Clin Invest Med. 2009; 32:E315.
40. Kau TR, Schroeder F, Ramaswamy S, Wojciechowski CL, Zhao JJ, Roberts TM, Clardy J, Sellers WR, Silver PA. A chemical genetic screen identifies inhibitors of regulated nuclear export of a Forkhead transcription factor in PTEN-deficient tumor cells. Cancer Cell. 2003; 4:463–76.
41. Dal Col J, Dolcetti R. GSK-3beta inhibition: at the crossroad between Akt and mTOR constitutive activation to enhance cyclin D1 protein stability in mantle cell lymphoma. Cell Cycle. 2008; 7:2813–6.
42. Schütz SV, Cronauer MV, Rinnab L. Inhibition of glycogen synthase kinase-3beta promotes nuclear export of the androgen receptor through a CRM1-dependent mechanism in prostate cancer cell lines. J Cell Biochem. 2010; 109:1192–200.
43. Ko JK, Choi CH, Kim YK, Kwon CH. The proteasome inhibitor MG-132 induces AIF nuclear translocation through down-regulation of ERK and Akt/mTOR pathway. Neurochem Res. 2011; 36:722–31.
44. Marampon F, Gravina G, Ju X, Vetuschi A, Sferra R, Casimiro M, Pompili S, Festuccia C, Colapietro A, Gaudio E, Di Cesare E, Tombolini V, Pestell RG. Cyclin D1 silencing suppresses tumorigenicity, impairs DNA double strand break repair and thus radiosensitizes androgen-independent prostate cancer cells to DNA damage. Oncotarget. 2016; 7:5383–400. https://doi.org/10.18632/oncotarget.6579.
45. Festuccia C, Gravina GL, Muzi P, Pomante R, Ventura L, Vessella RL, Vicentini C, Bologna M. Bicalutamide increases phospho-Akt levels through Her2 in patients with prostate cancer. Endocr Relat Cancer. 2007; 14:601–11.
46. Edlind MP, Hsieh AC. PI3K-AKT-mTOR signaling in prostate cancer progression and androgen deprivation therapy resistance. Asian J Androl. 2014; 16:378–86.
47. Gravina GL, Senapedis W, McCauley D, Baloglu E, Shacham S, Festuccia C. Nucleo-cytoplasmic transport as a therapeutic target of cancer. J Hematol Oncol. 2014; 7:85. https://doi.org/10.1186/s13045-014-0085-1.
48. Savona M, Garzon R, Brown PN, Yee K, Lancet JE, Gutierrez M, Gabrail N, Mau-Sorensen M, Baz R, Byrd JC, Kuruvilla J, Siegel DS, Shacham S, et al. Phase I trial of selinexor (KPT-330), a first-in-class oral selective inhibitor of nuclear export (SINE) in patients (PTS) with advanced acute myelogenous leukemia (AML). Blood. 2013; 122:1440.
49. London CA, Bernabe LF, Barnard S, Kisseberth WC, Borgatti A, Henson M, Wilson H, Jensen K, Ito D, Modiano JF, Bear MD, Pennell ML, Saint-Martin JR, et al. Preclinical evaluation of the novel, orally bioavailable selective inhibitor of nuclear export (SINE) KPT-335 in spontaneous canine cancer: results of a Phase I study. PLoS One. 2014; 9:e87585.
50. Turner JG, Dawson J, Sullivan DM. Nuclear export of proteins and drug resistance in cancer. Biochem Pharmacol. 2012; 83:1021–32.
51. O’Neill AJ, Prencipe M, Dowling C, Fan Y, Mulrane L, Gallagher WM, O’Connor D, O’Connor R, Devery A, Corcoran C, Rani S, O'Driscoll L, Fitzpatrick JM, Watson RW. Characterisation and manipulation of docetaxel resistant prostate cancer cell lines. Mol Cancer. 2011; 10:126. https://doi.org/10.1186/1476-4598-10-126.
52. Puhr M, Hoefer J, Schafer G, Erb HH, Oh SJ, Klocker H, Heidegger I, Neuwirt H, Culig Z. Epithelial-to-mesenchymal transition leads to docetaxel resistance in prostate cancer and is mediated by reduced expression of miR-200c and miR-205. Am J Pathol. 2012; 181:2188–201.
53. van Bokhoven A, Varella-Garcia M, Korch C, Johannes WU, Smith EE, Miller HL, Nordeen SK, Miller GJ, Lucia MS. Molecular characterization of human prostate carcinoma cell lines. Prostate. 2003; 57:205–25.
54. Chou TC. Drug combination studies and their synergy quantification using the Chou-Talalay method. Cancer Res. 2010; 70:440–6. https://doi.org/10.1158/0008-5472.CAN-09-1947.
55. Bruzzese F, Di Gennaro E, Avallone A, Pepe S, Arra C, Caraglia M, Tagliaferri P, Budillon A. Synergistic antitumor activity of epidermal growth factor receptor tyrosine kinase inhibitor gefitinib and IFN-alpha in head and neck cancer cells in vitro and in vivo. Clin Cancer Res. 2006; 12:617–25.
56. Gravina GL, Marampon F, Petini F, Biordi L, Sherris D, Jannini EA, Tombolini V, Festuccia C. The TORC1/TORC2 inhibitor, Palomid 529, reduces tumor growth and sensitizes to docetaxel and cisplatin in aggressive and hormone-refractory prostate cancer cells. Endocr Relat Cancer. 2011; 18:385–400.
57. Smiyun G, Azarenko O, Miller H, Rifkind A, LaPointe NE, Wilson L, Jordan MA. βIII-tubulin enhances efficacy of cabazitaxel as compared with docetaxel. Cancer Chemother Pharmacol. 2017; 80:151–64.
58. Storz P, Döppler H, Copland JA, Simpson KJ, Toker A. FOXO3a promotes tumor cell invasion through the induction of matrix metalloproteinases. Mol Cell Biol. 2009; 29:4906–17.
59. Tenbaum SP, Ordóñez-Morán P, Puig I, Chicote I, Arqués O, Landolfi S, Fernández Y, Herance JR, Gispert JD, Mendizabal L, Aguilar S, Ramón y Cajal S, Schwartz S Jr, et al. β-catenin confers resistance to PI3K and AKT inhibitors and subverts FOXO3a to promote metastasis in colon cancer. Nat Med. 2012; 18:892–901.
60. Aldonza MB, Hong JY, Alinsug MV, Song J, Lee SK. Multiplicity of acquired cross-resistance in paclitaxel-resistant cancer cells is associated with feedback control of TUBB3 via FOXO3a-mediated ABCB1 regulation. Oncotarget. 2016; 7:34395–419. https://doi.org/10.18632/oncotarget.9118.
61. Aldonza MB, Hong JY, Lee SK. Paclitaxel-resistant cancer cell-derived secretomes elicit ABCB1-associated docetaxel cross-resistance and escape from apoptosis through FOXO3a-driven glycolytic regulation. Exp Mol Med. 2017; 49:e286. https://doi.org/10.1038/emm.2016.131.
62. Jabir RS, Naidu R, Annuar MA, Ho GF, Munisamy M, Stanslas J. Pharmacogenetics of taxanes: impact of gene polymorphisms of drug transporters on pharmacokinetics and toxicity. Pharmacogenomics. 2012; 13:1979–88. https://doi.org/10.2217/pgs.12.165.
63. Dorsey JF, Dowling ML, Kim M, Voong R, Solin LJ, Kao GD. Modulation of the anti-cancer efficacy of microtubule-targeting agents by cellular growth conditions. Cancer Biol Ther. 2010; 9:809–18.
64. Mateo J, Boysen G, Barbieri CE, Bryant HE, Castro E, Nelson PS, Olmos D, Pritchard CC, Rubin MA, de Bono JS. DNA repair in prostate cancer: biology and clinical implications. Eur Urol. 2017; 71:417–25. https://doi.org/10.1016/j.eururo.2016.08.037.
65. He Y, Franco OE, Jiang M, Williams K, Love HD, Coleman IM, Nelson PS, Hayward SW. Tissue-specific consequences of cyclin D1 overexpression in prostate cancer progression. Cancer Res. 2007; 67:8188–97.
66. Alao JP, Gamble SC, Stavropoulou AV, Pomeranz KM, Lam EW, Coombes RC, Vigushin DM. The cyclin D1 proto-oncogene is sequestered in the cytoplasm of mammalian cancer cell lines. Mol Cancer. 2006; 5:7.
67. Roy S, Singh RP, Agarwal C, Siriwardana S, Sclafani R, Agarwal R. Downregulation of both p21/Cip1 and p27/Kip1 produces a more aggressive prostate cancer phenotype. Cell Cycle. 2008; 7:1828–35.
68. Shariat SF, Lotan Y, Saboorian H, Khoddami SM, Roehrborn CG, Slawin KM, Ashfaq R. Survivin expression is associated with features of biologically aggressive prostate carcinoma. Cancer. 2004; 100:751–7.
69. Ho KK, McGuire VA, Koo CY, Muir KW, de Olano N, Maifoshie E, Kelly DJ, McGovern UB, Monteiro LJ, Gomes AR, Nebreda AR, Campbell DG, Arthur JS, Lam EW. Phosphorylation of FOXO3a on Ser-7 by p38 promotes its nuclear localization in response to doxorubicin. J Biol Chem. 2012; 287:1545–55.
70. Bailey AN, Hocker AD, Vermillion BR, Smolkowski K, Shah SN, Jewett BA, Dreyer HC. MAFbx, MuRF1, and the stress-activated protein kinases are upregulated in muscle cells during total knee arthroplasty. Am J Physiol Regul Integr Comp Physiol. 2012; 303:R376–86.
71. Turner JG, Dawson J, Emmons MF, Cubitt CL, Kauffman M, Shacham S, Hazlehurst LA, Sullivan DM. CRM1 inhibition sensitizes drug resistant human myeloma cells to topoisomerase II and proteasome inhibitors both in vitro and ex vivo. J Cancer. 2013; 4:614–25.