
INTRODUCTION
Hepatocellular carcinoma (HCC), one of the most lethal cancers, can be effectively treated with surgical resection and liver transplantation [1]; however, recurrence and metastasis after these procedures remain primary obstacles for liver cancer treatment [2–4]. Cancer stem cells (CSCs), or tumor-initiating cells, have been identified in multiple malignancies, including liver cancer [5, 6]. These cells have unique characteristics and are thought drive tumor initiation, development, metastasis and recurrence [6–8]. As such, CSCs represent novel therapeutic targets for the treatment and prevention of tumor progression. The identification of CSC-specific markers, the isolation and characterization of CSCs from malignant tissues, and targeting strategies for the destruction of CSCs have provided new opportunities for cancer research [8, 9]. We previously demonstrated that the pluripotency factor Nanog not only serves as a novel biomarker for CSCs but also potentially plays a crucial role in maintaining the self-renewal capability of liver CSCs [10]. However, despite the potential clinical importance, the regulation of Nanog in CSCs at the molecular level is not well understood.
MicroRNAs (miRNAs), a class of endogenous non-coding RNAs that help regulate several cellular processes [11, 12], appear to have a role in tumor initiation through their regulation of CSC properties such as self-renewal, tumorigenicity and drug resistance [13–16]. The miR-449 cluster, which belongs to the miR-34 family and encodes the highly conserved miRNAs including miR-449a, miR-449b and miR-449c [17], has been shown to cause cell cycle arrest or promote apoptosis in a variety of cell and cancer types [18–20]. In addition, miR-449 expression is decreased in many tumor tissues [19, 21, 22]. However, to date, no studies have directly demonstrated that miR-449 has a causal role in tumorigenesis, despite the decrease in miR-449 levels in tumor tissues. Furthermore, the biological functions of miR-449 in CSCs are unknown. Therefore, obtaining a better understanding of how miR-449 regulates the expression of genes related to stemness could provide new insights into the process of tumorigenesis and reveal new therapeutic targets.
Here, we demonstrated that miR-449a is upregulated in HCC tissues and that high expression of miR-449a correlates with poor clinical prognosis. Furthermore, we showed that miR-449a participates in CSC regulation by improving self-renewal ability. Exogenous expression of miR-449a increased the stem cell properties of HCC cell lines and enhanced drug resistance. Moreover, increased expression of miR-449a resulted in higher expression of Nanog and downregulation of the Tcf3 gene, which negatively regulates Nanog, and TCF3 was confirmed as a novel target of miR-449a. These findings indicate that miR-449a has important roles in the self-renewal and tumor progression of CSCs. Collectively, this study reveals the miR-449a–TCF3-Nanog axis as a potential therapeutic target for liver cancer.
RESULTS
Upregulation of miR-449 in human HCC is correlated with poor prognosis
The miR-449 cluster contains three miRNAs: miR-449a, b, and c. To investigate the expression of the miR-449 cluster in malignant liver cancer, the levels of these miRNAs were measured in 25 fresh HCC tissue samples, paired adjacent normal tissues and three normal liver tissues. The results showed marked upregulation of miR-449a in HCC tissues but no significant differences in the expression of miR-449b and miR-449c (Figure 1A). Furthermore, miR-449a was expressed at much higher levels than miR-449b or miR-449c (Figure 1B). Therefore, we utilized qRT-PCR to analyze the expression of only miR-449a in a larger set of patient samples, including fresh HCC tissue samples paired with adjacent normal tissues (n = 52), paraffin-embedded tissue sections (n = 36), and normal liver tissues (n = 13). The results revealed that miR-449a is upregulated in HCC tissue (Figure 1C). We next analyzed correlations between miR-449a expression and overall survival, tumor recurrence, and other clinical data for 75 patients with follow-up data. Kaplan-Meier analysis and the log-rank test were used to compare the overall survival of HCC patients on the basis of miR-449a expression levels. To accomplish this, the HCC patients were divided into two groups: a low-miR-449a-expressing group (miR-449a expression levels below the median, n = 37) and a high-miR-449a-expressing group (miR-449a expression levels above the median, n = 38). Remarkably, high expression of miR-449a was directly correlated with poor overall survival (Figure 1D). Subsequently, we examined correlations between miR-449a expression and other clinical parameters. Pathology analysis showed that high levels of miR-449a were significantly associated with tumor recurrence (P = 0.013), metastasis (P < 0.001), vascular invasion (P = 0.009) and interstitial hyperplasia in tumors (P = 0.029) (Table 1). The total number was < 75 for several clinical parameters due to missing data.
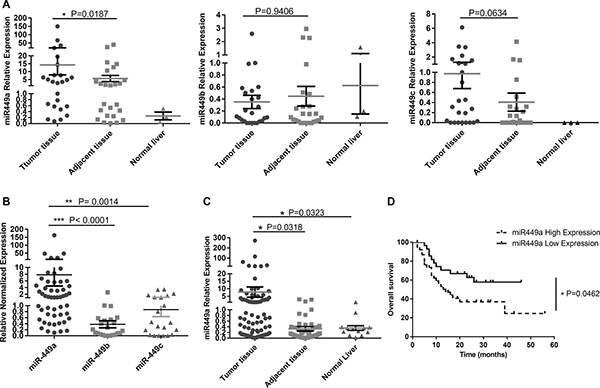
Figure 1: miR-449 is upregulated in HCC patients and correlated with poor prognosis. (A) Relative expression of miR-449 (a/b/c) was measured in 25 fresh HCC tumor tissues, paired adjacent tissues and 3 normal liver tissues using qRT-PCR. (B) Comparison of miR-449a, miR-449b and miR-449c expression in HCC tissue; miR-449a expression was much higher than that of the other miR-449 subtypes. (C) Relative expression of miR-449a in a large set of patient samples, which included fresh HCC tissue samples paired with adjacent normal tissues (n = 52), paraffin-embedded tissue sections (n = 36), and normal liver tissues (n = 13). (D) Expression of miR-449a correlated with poor overall survival of human HCC patients. HCC patients were divided into two groups: a low-miR-449a-expression group (miR-449a expression levels below the median, n = 37, solid line) and a high-miR-449a-expression group (miR-449a expression levels above the median, n = 38, dotted line). Overall survival of these patients is shown. P values were generated using the log-rank test.
Table 1: Correlation between miR-449a levels in HCC tissues and clinicopathological parameters of HCC patients
miR-449a |
||||
|---|---|---|---|---|
Variable |
n |
Low |
High |
p-value |
Age (years) |
||||
< 50 |
47 |
22 |
25 |
0.577 |
≥ 50 |
28 |
15 |
13 |
|
Sex |
||||
Female |
7 |
3 |
4 |
0.723 |
Male |
68 |
34 |
34 |
|
Tumor recurrence |
||||
− |
14 |
11 |
3 |
0.013* |
+ |
45 |
16 |
29 |
|
Metastasis |
||||
− |
20 |
17 |
3 |
< 0.001*** |
+ |
39 |
10 |
29 |
|
Tumor grade |
||||
I |
9 |
2 |
7 |
0.068 |
II |
34 |
16 |
18 |
|
III |
31 |
18 |
13 |
|
Tumor size (cm) |
||||
< 5 |
16 |
10 |
6 |
0.192 |
≥ 5 |
57 |
25 |
32 |
|
Tumor features |
||||
Necrosis |
||||
+ |
51 |
25 |
26 |
0.474 |
++ |
17 |
7 |
10 |
|
+++ |
6 |
4 |
2 |
|
Vascular invasion |
||||
− |
12 |
10 |
2 |
0.009** |
+ |
55 |
24 |
31 |
|
++ |
7 |
2 |
5 |
|
Interstitial hyperplasia |
||||
+ |
54 |
22 |
32 |
0.029* |
++ |
14 |
10 |
4 |
|
+++ |
6 |
4 |
2 |
|
Capsular invasion |
||||
− |
19 |
9 |
10 |
0.401 |
+ |
35 |
18 |
17 |
|
++ |
20 |
9 |
11 |
Note: (1) *P < 0.05, **P < 0.01, and ***P < 0.001 significant difference. (2) χ2 test. (3) Total number < 75 due to missing data.
miR-449a promotes self-renewal and tumorigenesis in human liver cancer cells
Previous reports have shown that tumorspheres, drug-resistant cells and Nanogpos cells have more stem cell potential than their counterparts. Therefore, we next measured miR-449a expression in tumorspheres, drug-resistant cells, Nanogpos cells and their counterparts. The results indicated that miR-449a is upregulated in stem-like cells (Figure 2A). To further characterize how miR-449a affects the stemness of liver cancer cells, the following lentiviral vectors were constructed: 1) Lv-miR-449a, which induced the expression of hsa-miR-449a, and Lv-NC, the corresponding scrambled control; and 2) Lv-sh-miR-449a, which induced the short hairpin RNA (shRNA) targeting the 3’UTR of miR-449a, and Lv-sh-NC, the corresponding scrambled control.
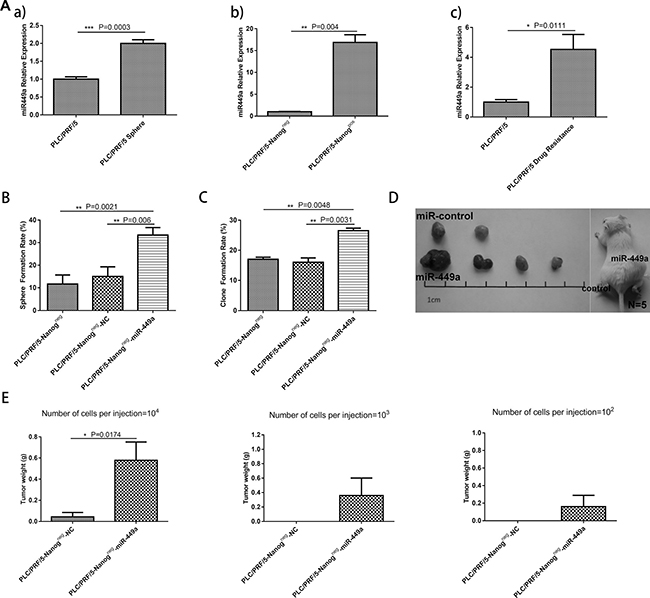
Figure 2: Overexpression of miR-449a promotes self-renewal and tumorigenesis in human liver cancer cells in vitro and in vivo. (A) Relative expression of miR-449a in normal cultured cells or cancer stem-like cells was quantified using qRT-PCR. a), Relative expression of miR-449a in PLC/PRF/5 and PLC/PRF/5 sphere cells. miR-449a expression was remarkably increased in the PLC/PRF/5 sphere cells. b), Relative expression of miR-449a in PLC/PRF/5 Nanogneg and Nanogpos cells. miR-449a expression was dramatically increased in the PLC/PRF/5 Nanogpos cells. c), Relative expression of miR-449a in PLC/PRF/5 and PLC/PRF/5 drug-resistant cells. miR-449a expression was significantly increased in the PLC/PRF/5 drug-resistant cells. (The data are presented as the mean ± SD of three independent experiments; ***P < 0.001; **P < 0.01; *P < 0.05). (B) Sphere formation rate of PLC/PRF/5 Nanogneg cells, scrambled control-expressing PLC/PRF/5 Nanogneg cells (Nanogneg-NC) and miR-449a-expressing PLC/PRF/5 Nanogneg cells (Nanogneg-miR-449a) grown in suspension culture conditions for 14 days. The sphere formation rate was significantly increased in the Nanogneg-miR-449a group. (The data are presented as the mean ± SD of three independent experiments; **P < 0.01). (C) Clone formation rate of PLC/PRF/5 Nanogneg cells, scrambled control-expressing PLC/PRF/5 Nanogneg cells (Nanogneg-NC) and miR-449a-expressing PLC/PRF/5 Nanogneg cells (Nanogneg-miR-449a) grown in conventional culture conditions for 14 days. The clone formation rate was significantly increased in the Nanogneg-miR-449a group. (The data are presented as the mean ± SD of three independent experiments; **P < 0.01). (D) Effects of miR-449a on tumor formation in vivo. A total of 1 × 10⁴ control or miR-449a-overexpressing PLC/PRF/5 Nanogneg cells were injected into NOD-SCID mice (5 mice per group). Representative xenografts from each of the five mice are shown. Lentivirus-mediated overexpression of miR-449a significantly increased tumor formation. (E) Average weight of tumors formed from control or miR-449a-overexpressing PLC/PRF/5 Nanogneg cells initiated by implantation of 1 × 10², 1 × 10³, or 1 × 10⁴ cells. Overexpression of miR-449a significantly increased tumor weight. (5 mice per group, and the data are presented as the mean ± SD; *P < 0.05).
After verifying that Nanogneg liver cancer cells have low stemness potential, we investigated whether miR-449a can enhance the self-renewal and tumorigenesis of these cells. To accomplish this, we infected Nanogneg cancer cells with Lv-miR-449a and Lv-NC. The cells overexpressing miR-449a exhibited markedly increased stemness, as indicated by increased sphere formation and colony formation ability and enhanced in vivo tumorigenic ability, compared with the Lv-NC-infected cells (Figure 2B–2E, Table 2, Supplementary Figure 1A). In complement to the above, Nanogpos liver cancer cells have been reported to possess high stemness potential. We verified these effects by infecting Nanogpos CSCs with Lv-sh-miR-449a or Lv-sh-NC virus to knock down miR-449a in the cells. The results showed that miR-449a shRNA remarkably inhibited the self-renewal ability of liver CSCs (Figure 3A–3D, Table 2, Supplementary Figure 1B), highlighting the important role of this miRNA in maintaining stemness.
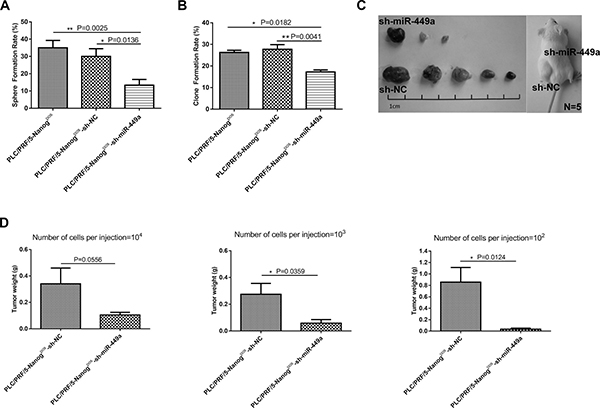
Figure 3: Downregulation of miR-449a inhibited self-renewal and tumorigenesis in human liver cancer cells in vitro and in vivo. (A) Sphere formation rate of PLC/PRF/5 Nanogpos cells, scrambled control shRNA-expressing PLC/PRF/5 Nanogpos cells (Nanogpos-sh-NC) and miR-449a shRNA-expressing PLC/PRF/5 Nanogpos cells (Nanogpos-sh-miR-449a) grown in suspension culture conditions for 14 days. The sphere formation rate significantly decreased in the Nanogpos-sh-miR-449a group. (The data are presented as the mean ± SD of three independent experiments; **P < 0.01; *P < 0.05). (B) Clone formation rate of PLC/PRF/5 Nanogpos cells, scrambled control shRNA-expressing PLC/PRF/5 Nanogpos cells (Nanogpos-sh-NC) and miR-449a shRNA-expressing PLC/PRF/5 Nanogpos cells (Nanogpos-sh-miR-449a) grown in conventional culture conditions for 14 days. The clone formation rate significantly decreased in the Nanogpos-sh-miR-449a group. (The data are presented as the mean ± SD of three independent experiments; **P < 0.01; *P < 0.05). (C) Effects of miR-449a on tumor formation in vivo. A total of 1 × 10² control shRNA-expressing or miR-449a shRNA-expressing PLC/PRF/5 Nanogpos cells were injected into NOD-SCID mice (5 mice per group). Representative xenografts from each of the five mice are shown. Lentivirus-mediated downregulation of miR-449a significantly decreased the tumor formation of PLC/PRF/5 Nanogpos cells. (D) Average weight of tumors formed from control shRNA-expressing or miR-449a shRNA-expressing PLC/PRF/5 Nanogpos cells initiated by implantation of 1 × 10², 1 × 10³, or 1 × 10⁴ cells. Downregulation of miR-449a significantly reduced tumor weight. (5 mice per group, and the data are presented as the mean ± SD; **P < 0.01; *P < 0.05).
Table 2: Regulation of tumorigenesis in subcutaneous xenografts by miR-449a
Cells |
Number of cells per injection |
||
|---|---|---|---|
104 |
103 |
102 |
|
PLC/PRF/5 Nanogneg-NC |
2/5 |
0/5 |
0/5 |
PLC/PRF/5 Nanogneg-449a |
4/5 |
3/5 |
2/5 |
PLC/PRF/5 Nanogpos-sh-NC |
5/5 |
5/5 |
5/5 |
PLC/PRF/5 Nanogpos-sh-miR-449a |
5/5 |
4/5 |
3/5 |
Note: Efficiency of tumor formation of scrambled control-expressing PLC/PRF/5 Nanogneg cells (PLC/PRF/5 Nanogneg-NC), miR-449a-expressing PLC/PRF/5 Nanogneg cells (PLC/PRF/5 Nanogneg-449a), scrambled control shRNA-expressing PLC/PRF/5 Nanogpos cells (PLC/PRF/5 Nanogpos-sh-NC) and miR-449a shRNA-expressing PLC/PRF/5 Nanogpos cells (PLC/PRF/5 Nanogpos-sh-miR-449a). Varying numbers of cells were subcutaneously injected into NOD-SCID mice (5 mice per group). Tumor formation was observed for 8 weeks after implantation.
TCF3 is a direct target of miR-449a
To investigate the molecular mechanism driving miR-449a-mediated promotion of stemness in liver cancer cells, bioinformatic algorithms were used to identify potential targets of miR-449a in humans. TCF3 (also known as TCF7L1) was predicted as a target of miR-449a according to RNA22 [23], with three conserved binding sites for miR-449a being identified in the 3’UTR region of the Tcf3 gene (Figure 4A). To verify the prediction, we constructed three luciferase reporter plasmids containing the predicted miR-449a-binding sites in the 3’UTR of Tcf3 and three luciferase reporter plasmids containing mutated versions of the binding sites. To further examine whether miR-449a affects TCF3 expression, we infected Huh7 and PLC/PRF/5 cells with Lv-miR-449a and Lv-NC. The targeting activity of miR-449a to the 3’UTRs of the TCF3 mRNA constructs containing the predicted binding sites was examined using luciferase constructs cloned into a pGL3-control vector. For wild-type TCF3 3’UTR, luciferase activity decreased following ectopic expression of miR-449a, but this was not observed in the mutant constructs (Figure 4B).
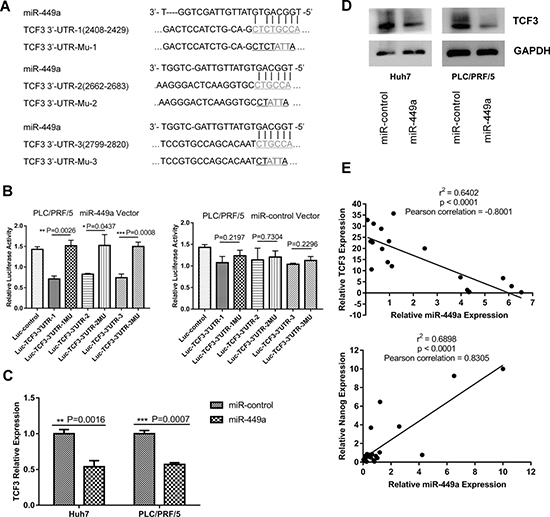
Figure 4: miR-449a targeted Tcf3 by binding to its 3’UTR. (A) Three predicted miR-449a target sequences in the 3’UTR of Tcf3 and a mutant sequence (TCF3-3’UTR-Mu) were cloned into pGL3-control vectors. (B) Luciferase reporter activity of the Tcf3 3’UTR was measured in PLC/PRF/5 cells. PLC/PRF/5 cells were cotransfected with miR-449a or scrambled control and luciferase reporters containing either the predicted miRNA target site in the TCF3 3’UTR or its corresponding mutant form, TCF3-3’UTR-Mu, which was used as a positive control. (The data are presented as the mean ± SD; ***P < 0.001; **P < 0.01; *P < 0.05). (C, D) TCF3 mRNA and protein levels were reduced compared with that in control cells after the infection of Huh7 and PLC/PRF/5 cells with miR-449a-expressing viruses. (E) Correlation between miR-449a and TCF3 (upper panel) or Nanog (lower panel) mRNA levels in 25 fresh HCC tissue samples and paired adjacent normal tissues.
To verify these results in cells, qRT-PCR and western blotting were used to detect Tcf3 expression in two HCC cell lines infected with Lv-miR-449a or Lv-NC. As shown in Figure 4C and 4D, TCF3 RNA and protein levels were both significantly reduced in the miR-449a overexpression group. These results indicate that miR-449a can regulate the expression of TCF3 at both the mRNA and protein levels.
In the above data, miR-449a was shown to be upregulated in cancer tissue compared to adjacent normal tissue. To determine how this upregulation affects TCF3 expression in HCC tissues, we measured levels of miR-449a and TCF3 mRNA in 25 HCC tissue samples paired with adjacent normal tissues. As expected, TCF3 expression was increased in the paired miR-449a-low-expression adjacent normal tissues. Additionally, miR-449a expression was negatively correlated with TCF3 expression (Figure 4E, upper panel). These results indicate that an inverse correlation exists between miR-449a and TCF3 expression in HCC tissue.
TCF3 can offset the stem cell-like features and tumorigenicity of miR-449a-overexpressing cells
It has been reported that TCF3 can bind to a promoter regulatory region of the Nanog gene and repress its transcriptional activity in embryonic stem cells (ESCs) through a Groucho interaction, which is a domain-dependent process. As a result, TCF3 can limit ESC self-renewal ability [24]. Therefore, to investigate whether TCF3 represses Nanog transcription in CSCs, we examined the mRNA expression of the Nanog gene in Nanogpos PLC/PRF/5 cells after TCF3 overexpression. As shown in Figure 5A, TCF3 overexpression downregulated the expression of Nanog mRNA and reduced tumor sphere formation and clone formation (Figure 5B, 5C).
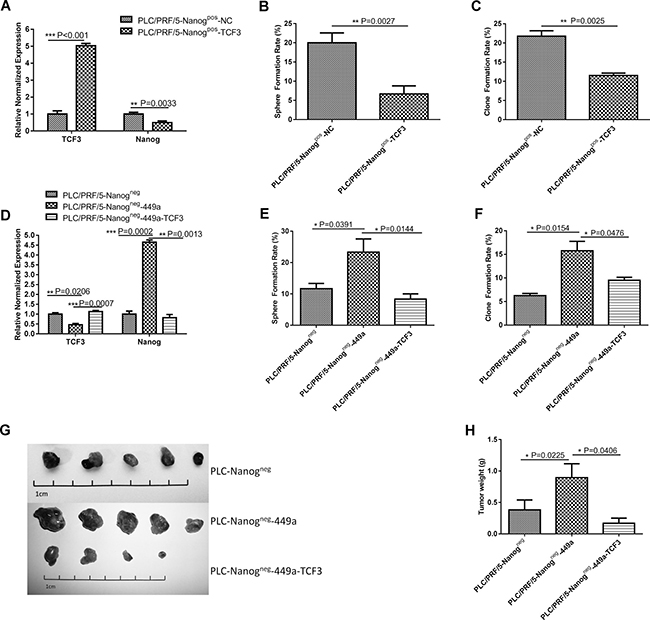
Figure 5: TCF3 can offset the stem cell-like features and tumorigenicity of miR-449a-overexpressing cells. (A) TCF3 and Nanog mRNA expression in scrambled control-expressing PLC/PRF/5 Nanogpos cells (Nanogpos-NC) and TCF3-expressing cells (Nanogpos-TCF3) were detected using qRT-PCR. (The data are presented as the mean ± SD of three independent experiments; ***P < 0.001; **P < 0.01). (B, C) Sphere formation rate and clone formation rate of scrambled control-expressing PLC/PRF/5 Nanogpos cells (Nanogpos-NC) and TCF3-expressing PLC/PRF/5 Nanogpos cells (Nanogpos-TCF3) grown in suspension or in conventional culture conditions for 14 days. (The data are presented as the mean ± SD of three independent experiments; **P < 0.01). (D) Expression of TCF3 and Nanog mRNA in PLC/PRF/5 Nanogneg cells (Nanogneg), miR-449a-expressing PLC/PRF/5 Nanogneg cells (Nanogneg-449a) and TCF3-expressing Nanogneg-449a cells (Nanogneg-449a-TCF3) detected using qRT-PCR. (The data are presented as the mean ± SD of three independent experiments; ***P < 0.001; **P < 0.01). (E, F) Sphere formation rate and clone formation rate of Nanogneg, Nanogneg-449a and Nanogneg-449a-TCF3 cells grown in suspension or in conventional culture conditions for 14 days. (The data are presented as the mean ± SD of three independent experiments; *P < 0.05). (G) In vivo tumor formation of Nanogneg, Nanogneg-449a and Nanogneg-449a-TCF3 cells. A total of 1 × 10⁵ cells were injected into NOD-SCID mice (5 mice per group). Representative xenografts from each of the five mice are shown. Lentivirus-mediated upregulation of TCF3 significantly decreased tumor formation by PLC/PRF/5 Nanogneg-449a cells. (H) Average weight of tumors formed from Nanogneg, Nanogneg-449a or Nanogneg-449a-TCF3 cells initiated by implantation of 1 × 10⁵ cells. Downregulation of miR-449a by TCF3 overexpression significantly reduced tumor weight. (5 mice per group, and the data are presented as the mean ± SD; *P < 0.05).
To determine the function of TCF3 in miR-449a-induced CSCs, we overexpressed TCF3 using lentivirus. As shown in Figure 5D, restoration of TCF3 markedly reduced the level of Nanog mRNA and the sphere formation and clone formation ability of miR-449a-overexpressing Nanogneg PLC/PRF/5 cells (Figure 5E, 5F). Meanwhile, restoration of TCF3 markedly reduced the miR-449a expression (Supplementary Figure 2). Furthermore, a tumorigenicity test in NOD-SCID mice showed that restoration of TCF3 reduced the number and weight of tumors formed from miR-449a-overexpressing Nanogneg PLC/PRF/5 cells (Figure 5G, 5H, Table 3).
Table 3: Regulation of tumorigenesis in subcutaneous xenografts by miR-449a and TCF3
Cells |
Number of cells per injection |
|---|---|
105 |
|
PLC/PRF/5 Nanogneg |
5/5 |
PLC/PRF/5 Nanogneg-449a |
5/5 |
PLC/PRF/5 Nanogneg-449a-TCF3 |
4/5 |
Note: Efficiency of tumor formation of PLC/PRF/5 Nanogneg cells (PLC/PRF/5 Nanogneg), miR-449a-expressing PLC/PRF/5 Nanogneg cells (PLC/PRF/5 Nanogneg-449a), and TCF3-expressing PLC-Nanogneg-449a cells (PLC/PRF/5 Nanogneg-449a-TCF3). Approximately 1 × 10⁵ cells were subcutaneously injected into NOD-SCID mice (5 mice per group). Tumor formation was observed for 4 weeks after implantation.
miR-449a promotes the self-renewal capacity of hcc stem cells by downregulating TCF3 expression
In addition to being a direct target of miR-449a, TCF3 is also a core regulator that governs the expression of genes related to stemness as well as stem cell self-renewal, differentiation, and proliferation. Therefore, we next examined the correlation between miR-449a expression and stemness markers such as Oct4, Sox2, and Nanog. To accomplish this, we overexpressed miR-449a in PLC/PRF/5 Nanogneg cells and inhibited miR-449a expression in PLC/PRF/5 Nanogpos cells. Then, we detected the expression of Oct4, Sox2, and Nanog using qRT-PCR and western blotting. The results showed that overexpression of miR-449a in Nanogneg cells promoted the expression of the stem cell markers such as Nanog and Oct4 (Figure 6A). Conversely, inhibiting miR-449a expression in Nanogpos stem cells reduced the expression of Nanog relative to that in control cells (Figure 6B). In addition, we measured the levels of miR-449a and Nanog mRNA in 25 HCC tissue samples and paired adjacent normal tissues. miR-449a expression was positively correlated with Nanog expression (Figure 4E, lower panel). These results suggest that miR-449a can increase the expression of the stemness-associated gene Nanog.
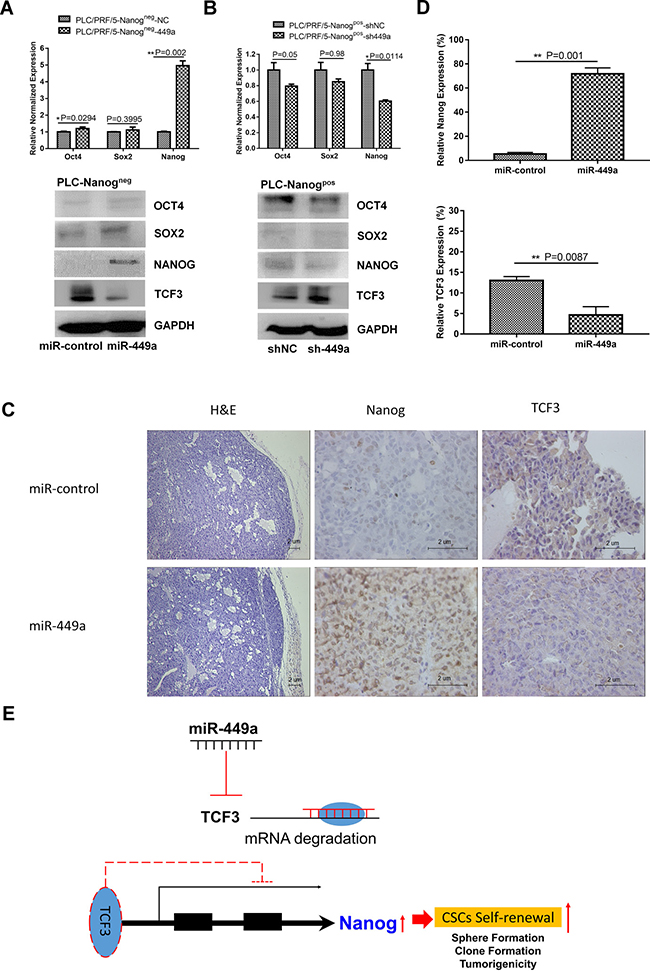
Figure 6: miR-449a promotes the self-renewal capacity of HCC stem cells by downregulating TCF3 expression. (A) qRT-PCR and western blotting analysis of the expression levels of stem cell markers in PLC/PRF/5 Nanogneg cells after infection with Lv-miR449a or scrambled miRNA control lentivirus. (B) qRT-PCR and western blotting analysis of stem cell markers in PLC/PRF/5 Nanogpos cells after infection with Lv-sh-miR-449a or scrambled shRNA control lentivirus. (C) Histological and IHC analysis of xenografted tumors formed from miR-449a-overexpressing PLC/PRF/5 Nanogneg cells or scrambled control-expressing cells. Hematoxylin and eosin staining and IHC staining with anti-Nanog or anti-TCF3 antibodies were used to examine the subcutaneous tumors (Scale bars: 2 μm). (D) Quantification of Nanog and TCF3 expression by cell counting in 5 randomly selected areas. (Data are presented as the mean ± SD of three independent experiments; **P < 0.01). (E) Schema of the miR-449a-TCF3-Nanog pathway. miR-449a inhibits TCF3 expression, thereby increasing Nanog expression to maintain self- renewal in liver CSCs.
Immunohistochemical staining showed decreased expression of TCF3 and increased expression of Nanog in PLC/PRF/5 miR-449a-overexpressing xenografted tumors compared with control xenografted tumors, suggesting that miR-449a can also regulate HCC stemness in vivo (Figure 6C, 6D). Taken together, these data indicate that miR-449a improves the self-renewal capacity of HCC stem-like cells.
DISCUSSION
Although liver CSCs and specific stem cell markers have been identified in previous studies [6, 10, 25], the molecular mechanisms by which cells acquire CSC properties such as self-renewal, drug resistance and tumor-seeding ability are not fully understood. We previously showed that Nanog plays a crucial role in maintaining the self-renewal ability of liver CSCs [10]; however, how CSCs maintain Nanog gene expression has not been elucidated. miRNAs have been implicated in the regulation of CSC properties; therefore, a better understanding of the modulation of gene expression in CSCs by miRNAs could aid in the identification of promising biomarkers and therapeutic targets [13, 26, 27]. In the present study, we demonstrated that miR-449a is overexpressed in HCC, especially poorly differentiated HCC, and is associated with vascular invasion and correlated with poor patient prognosis. Notably, poor differentiation, high invasion and metastasis, and poor prognosis are the characteristics of CSCs, but whether miR-449a plays a critical role in liver CSC behavior is unknown. To help address this question, we measured the expression of miR-449a in stem-like/enriched cells (tumorspheres and drug-resistant cells) and found that miR-449a was significantly upregulated in these stem-like cells. We also examined the relationship between miRNA-449a and Nanog. The transcription factor Nanog not only maintains the pluripotency and self-renewal of ESCs [28] but also helps maintain CSC stemness and promotes tumor initiation [10, 29, 30]. To better understand how miRNA-449a and Nanog are related, we detected the expression of miRNA-449a in Nanogpos and Nanogneg HCC cells. As expected, miRNA-449a was upregulated in the Nanogpos cells.
To further investigate the function of miR-449a in stemness regulation, we artificially regulated miR-449a expression using miR-449a-expressing or anti-miR449a-expressing lentivirus in a previously described CSC Nanog reporter system [10]. In this system, Nanogpos and Nanogneg cells can be separated based on GFP expression, as they are all infected with a lentiviral vector containing the human Nanog promoter driving the expression of the GFP reporter gene. Nanog-positive HCC cells exhibited CSC-like characteristics, whereas Nanog-negative HCC cells exhibited characteristics of differentiated cells. Furthermore, after infection with the miR-449a-expression virus, Nanogneg cells showed upregulated Nanog expression and exhibited restored sphere formation, enhanced clone formation and increased tumorigenicity. In contrast, after infection with the anti-miR-449a-expression virus, Nanogpos cells lost their stem cell characteristics.
miR-449 and miR-34 belong to an evolutionarily conserved miRNA family [31, 32]. Previous data have demonstrated that miR-34 can induce apoptosis, cell cycle arrest and senescence in some types of cancer cells [33, 34] and can suppress the formation of gastric cancer tumorspheres [35]. However, most of the data have been derived from studies using cell culture models, and further studies should thus be conducted to investigate the potential role of miR-34 in tumors in vivo.
Although miR-449 miRNAs have been shown to cause cell cycle arrest or promote apoptosis in liver cancer [36, 37], the function of miR-449 in the regulation of CSCs is still unknown. Here, we showed that Nanog is not a direct target of miR-449a, which led us to search for a target gene that could regulate Nanog expression. We analyzed the 3’UTRs of significantly differentially expressed genes in a complementary DNA microarray and identified TCF3 as an ideal candidate. TCF3, a member of the Tcf/Lef family, is a negative regulator of the ESC pluripotency network and has also been found to inhibit pluripotency and repress Nanog gene expression in ESCs [24, 38]. In cancer, TCF3 inhibits embryonal carcinoma malignancy by regulating Oct4 expression [39]. In glioblastoma, downregulation of TCF3 by ASCL1 is essential for the maintenance and in vivo tumorigenicity of glioblastoma CSCs [40]. To demonstrate that TCF3 is a key intermediate in the upregulation of Nanog through miR-449a, we restored TCF3 expression in miR-449a-expressing Nanogpos cells. The restoration of TCF3 abrogated the cells’ stemness features, including sphere formation, clone formation, and tumorigenicity. In addition, we demonstrated that Nanogpos liver cancer cells have low expression of TCF3. Moreover, when we overexpressed TCF3 in Nanogpos cells, the stemness features of these cells were reduced. Furthermore, miR-449a expression was negatively correlated with TCF3 expression and positively correlated with Nanog expression in liver cancer tissues. In contrast, the overexpression of miR-449a in Nanogneg cancer cells promoted stemness-associated features (self-renewal ability and tumorigenicity), and restoring TCF3 expression in these cells negated the enhanced stemness. Finally, we verified that three predicted miR-449a target sequences exist in the 3’UTR of TCF3 using a luciferase assay.
Taken together, these results demonstrate that miR-449a is upregulated in HCC patients and leads to poor prognosis and could therefore be used as a prognostic marker for HCC. miR-449a promoted self-renewal and tumorigenesis in human HCC cells by targeting the stemness suppressor gene Tcf3. Furthermore, our data established the role of the miR449a-TCF3-Nanog axis in the maintenance of stemness in liver CSCs.
MATERIALS AND METHODS
Ethics statement
The study was approved by the Institutional Review Board of Southwest Hospital, Third Military Medical University (Chongqing, China). All patients provided written informed consent.
Tissue samples
Fresh human hepatocarcinoma samples and paired adjacent tissues were obtained after receiving written informed consent from all patients. All patients underwent surgical resection of primary HCC at the Institute of Hepatobiliary Surgery, Southwest Hospital, Third Military Medical University.
Cells and cell culture
The human hepatoma PLC/PRF/5 cell line was purchased from the American Type Culture Collection (Manassas, VA, http://www.atcc.org), and the Huh7 cell line was purchased from the Shanghai Cell Collection (Shanghai, China). All cells were cultured in Dulbecco’s modified Eagle’s medium (Gibco Invitrogen, Carlsbad, CA) supplemented with 10% fetal bovine serum (HyClone, Logan, UT), 100 U/mL penicillin, and 100 U/mL streptomycin and were maintained under 5% CO2 in a humidified incubator at 37℃.
Cell sorting and flow cytometry
Flow cytometry was used to sort HCC cell lines after infection with Lv-PNanog-GFP at an MOI of 10 as described previously [10]. The samples were analyzed and sorted on a BD FACS Aria II cell sorter (BD Biosciences, CA). Cell viability was assessed using 7-amino-actinomycin D (7AAD) staining to exclude dead cells. The top high (< 5%) expressing and top low (< 5%) expressing cells were sorted as Nanogpos and Nanogneg cells. The results were analyzed using FlowJo software (Tree Star, San Carlos, CA). The purity of the sorted cells was over 99%.
Vector construction and reporter assays
The 3’ untranslated regions (UTRs) of different TCF3 constructs containing miR-449a-binding sites were cloned downstream of the luciferase reporter in the pMIR-REPORT vector system (Thermo Fisher Scientific, Waltham, MA). A QuikChange site-directed mutagenesis kit (Agilent Technologies, Santa Clara, CA) was used to create two point mutations in the seed region. The 3’UTRs of the TCF3 constructs and the mutated primer sequences are listed in Additional file 1, Supplementary Table 1.
PLC/PRF/5 human hepatoma cells overexpressing miR-449a or a scrambled miRNA control were cultured in 6-well plates and cotransfected with 1 μg of firefly luciferase reporter (pMIR-report) and 500 ng of Renilla luciferase reporter using Effectene transfection reagent (Qiagen, Hilden, Germany). Twenty-four hours post-transfection, firefly luciferase activity was measured using a Dual-Luciferase Assay (Promega Corporation, Madison, WI), and the results were normalized to Renilla luciferase activity according to the manufacturer’s protocol.
RNA extraction and quantitative real-time PCR
Total RNA was extracted from fresh tissues and cells using TRIzol (TaKaRa Bio Inc., Shiga, Japan) according to the manufacturer’s instructions. miRNA quantification from extracted RNA was performed using TaqMan MicroRNA Assays (Applied Biosystems Inc., Waltham, MA). RT primers and TaqMan probes for miR-449a (Applied Biosystems Inc., Waltham, MA) were used for PCR, which was performed on an ABI 7900HT Fast Real-Time PCR System (Applied Biosystems Inc., Waltham, MA). miRNA levels were normalized to U6 levels. Three independent experiments were performed for each qRT-PCR analysis using three independent samples. Relative expression of miR-449 family members in tissues and hepatoma cell lines was compared to the mean expression of 10 normal liver samples using the equation RQ = 2–DDCT.
qRT-PCR analysis of the miR-449a target gene
Total RNA was extracted from cells, and cDNA synthesis was performed with a PrimeScript RT reagent kit (TaKaRa Bio Inc., Shiga, Japan). The resulting cDNA was amplified using TCF3 primers with SYBR Premix Ex Taq II (TaKaRa Bio Inc., Shiga, Japan) with the parameters 95°C for 30 s, followed by 40 cycles of 95°C for 5 s and 60°C for 30 s. The primers for TCF3 were (forward) TCAAGGACACGAGGTCACCATC and (reverse) GGAGAAGTGGTCATTGCTGTAGG, and the primers for endogenous GAPDH were (forward) CACCCACTCCTCCACCTTTG and (reverse) CCACCACCCTGTTGCTGTAG. Melting curve analysis was performed at the end of the cycles to ensure product specificity. The relative quantity of TCF3, normalized to GAPDH, was calculated based on the equation RQ = 2–DDCT.
Oligonucleotide synthesis and transfection
miR-449a inhibitor and scrambled control oligonucleotides were synthesized and purified by RiboBio Co. (Guangzhou, China) and had the following sequences: miR-449a inhibitor, 5′-ACCAGCUAACAAUACACUGCCA-3’ and scrambled control, 5′-UUCUCCGAACGUGUCACGUTT-3’. The oligonucleotides were transfected into cultured cells using Effectene transfection reagent (Qiagen, Hilden, Germany) following the manufacturer’s instructions. Transfection efficiency was determined using TaqMan-based qRT-PCR (Applied Biosystems Inc., Waltham, MA).
Immunohistochemical staining
Formalin-fixed, paraffin-embedded tumor tissues and xenografts were cut into 5-μm-thick sections and subjected to standard immunohistochemistry (IHC) using a Dako REAL EnVision Detection System (Dako Denmark A/S, Glostrup, Denmark) according to the manufacturer’s guidelines. The following primary antibodies were used in this study: a rabbit polyclonal anti-Nanog antibody (Abcam, Cambridge, MA) and a mouse monoclonal anti-TCF3 antibody (R&D systems, Minneapolis, MN). Qualitative analysis of Nanog and TCF3 expression was performed independently by two pathologists as described previously.
Sphere formation assay
To assay sphere formation efficiency, single cells were sorted and plated at 10 cells/well into ultra-low-attachment 96-well plates (Corning Inc., NY). The cells were cultured in DMEM/F12 medium (Sigma-Aldrich, St. Louis, MO) with B27 supplement (Gibco, Grand Island, NY), antibiotics, 20 ng/mL epidermal growth factor (PeproTech Inc., Rocky Hill, NJ), 20 ng/mL basic fibroblast growth factor (PeproTech Inc., Rocky Hill, NJ), and 10 ng/mL hepatocyte growth factor (PeproTech Inc., Rocky Hill, NJ). Next, 1% methylcellulose (Sigma-Aldrich, St. Louis, MO) was added to prevent cell aggregation, and individual spheres derived from a single cell were confirmed. After 4–5 days, equal volumes of fresh medium were added. The cells were incubated for 2 weeks, and spheres with a diameter > 75 μm were counted.
Colony formation assays
Briefly, 100 cells were seeded into 24-well plates and cultured for 14 days. Colonies were fixed with 4% formaldehyde and stained with 0.1% crystal violet (Sigma-Aldrich, St. Louis, MO), and the colonies were counted.
Tumor xenografts
Four-week-old male non-obese diabetic severe combined immunodeficient (NOD-SCID) mice were maintained in pathogen-free conditions at the animal facility of the Third Military Medical University and received humane care according to the criteria outlined in the “Guide for the Care and Use of Laboratory Animals” prepared by the National Academy of Sciences. Different numbers of cells overexpressing the scrambled miRNA control or miR-449a were resuspended in serum-free medium and mixed with Matrigel at a ratio of 1:1. The cells were then injected subcutaneously into NOD-SCID mice. The subcutaneous tumor-bearing mice were killed 8 weeks after implantation. The weight of the subcutaneous tumors was calculated, and the tumors were collected, fixed in formalin, paraffin-embedded, sectioned and stained with hematoxylin and eosin.
Statistical analysis
All data are presented as the mean ± standard deviation. Student’s t-test was used for comparisons of two groups. Analysis of variance was used for analysis of clinical variables. Kaplan-Meier’s method was used for survival analysis. P < 0.05 was considered significant and is marked with an asterisk. P < 0.01 was considered highly significant and is marked with a double asterisk. P < 0.001 was considered highly significant and is marked with three asterisks.
Abbreviations
CSCs, cancer stem cells; HCC, hepatocellular carcinoma; ESCs, embryonic stem cells; miRNAs, microRNAs; miR-449, microRNA-449; Nanog, Nanog homeobox; TCF3, transcription factor 3; DMEM, Dulbecco’s modified Eagle’s medium; FBS, fetal bovine serum; FACS, fluorescence-associated cell sorting; 7AAD, 7-amino-actinomycin D; GFP, green fluorescent protein; qRT-PCR, quantitative real-time polymerase chain reaction; IHC, immunohistochemistry; OCT4, octamer-binding transcription factor 4; Sox2, sex determining region Y (SRY)-box 2; UTR, untranslated region; shRNA, short hairpin RNA;
Author contributions
Q.Z. and Z.Y.: study conception and design acquisition, analysis and interpretation of data, drafting of the manuscript, and statistical analysis; J.S., J.S., C.L., X.C., Y.X., J.C., and Q.M.: acquisition of data and technical and material support; L.L.: pathological analysis; L.Y. and C.Q.: study conception, analysis and interpretation of data, critical revision of the manuscript, obtaining funding, and study supervision.
ACKNOWLEDGMENTS
We thank the members of the Biological Therapy Center for assisting to collect pathological information in this study.
CONFLICTS OF INTEREST
The authors have no conflicts of interest to declare.
FUNDING
This work was supported by funds from the National Natural Sciences Foundation of China 81330048 awarded to C. Qian.
REFERENCES
1. Chun JM, Kwon HJ, Sohn J, Kim SG, Park JY, Bae HI, Yun YK, Hwang YJ. Prognostic factors after early recurrence in patients who underwent curative resection for hepatocellular carcinoma. J Surg Oncol. 2011; 103:148–151. https://doi.org/10.1002/jso.21786.
2. Belghiti J, Panis Y, Farges O, Benhamou JP, Fekete F. Intrahepatic recurrence after resection of hepatocellular carcinoma complicating cirrhosis. Ann Surg. 1991; 214:114–117.
3. Kishi Y, Hasegawa K, Sugawara Y, Kokudo N. Hepatocellular carcinoma: current management and future development-improved outcomes with surgical resection. Int J Hepatol. 2011; 2011:728103. https://doi.org/10.4061/2011/728103.
4. Roayaie S, Schwartz JD, Sung MW, Emre SH, Miller CM, Gondolesi GE, Krieger NR, Schwartz ME. Recurrence of hepatocellular carcinoma after liver transplant: patterns and prognosis. Liver Transpl. 2004; 10:534–540. https://doi.org/10.1002/lt.20128.
5. Visvader JE, Lindeman GJ. Cancer stem cells in solid tumours: accumulating evidence and unresolved questions. Nat Rev Cancer. 2008; 8:755–768. https://doi.org/10.1038/nrc2499.
6. Yamashita T, Wang XW. Cancer stem cells in the development of liver cancer. J Clin Invest. 2013; 123:1911–1918. https://doi.org/10.1172/JCI66024.
7. Rosen JM, Jordan CT. The increasing complexity of the cancer stem cell paradigm. Science. 2009; 324:1670–1673. https://doi.org/10.1126/science.1171837.
8. Chen K, Huang YH, Chen JL. Understanding and targeting cancer stem cells: therapeutic implications and challenges. Acta Pharmacol Sin. 2013; 34:732–740. https://doi.org/10.1038/aps.2013.27.
9. Kim H, Park YN. Hepatocellular carcinomas expressing ‘stemness’-related markers: clinicopathological characteristics. Dig Dis. 2014; 32:778–785. https://doi.org/10.1159/000368021.
10. Shan J, Shen J, Liu L, Xia F, Xu C, Duan G, Xu Y, Ma Q, Yang Z, Zhang Q, Ma L, Liu J, Xu S, et al. Nanog regulates self-renewal of cancer stem cells through the insulin-like growth factor pathway in human hepatocellular carcinoma. Hepatology. 2012; 56:1004–1014. https://doi.org/10.1002/hep.25745.
11. Croce CM, Calin GA. miRNAs, cancer, and stem cell division. Cell. 2005; 122:6–7. https://doi.org/10.1016/j.cell.2005.06.036.
12. Shivdasani RA. MicroRNAs: regulators of gene expression and cell differentiation. Blood. 2006; 108:3646–3653. https://doi.org/10.1182/blood-2006-01-030015.
13. Takahashi RU, Miyazaki H, Ochiya T. The role of microRNAs in the regulation of cancer stem cells. Front Genet. 2014; 4:295. https://doi.org/10.3389/fgene.2013.00295.
14. Shimono Y, Zabala M, Cho RW, Lobo N, Dalerba P, Qian D, Diehn M, Liu H, Panula SP, Chiao E, Dirbas FM, Somlo G, Pera RA, et al. Downregulation of miRNA-200c links breast cancer stem cells with normal stem cells. Cell. 2009; 138:592–603. https://doi.org/10.1016/j.cell.2009.07.011.
15. Garg M. Emerging role of microRNAs in cancer stem cells: implications in cancer therapy. World J Stem Cells. 2015; 7:1078–1089. https://doi.org/10.4252/wjsc.v7.i8.1078.
16. Park EY, Chang E, Lee EJ, Lee HW, Kang HG, Chun KH, Woo YM, Kong HK, Ko JY, Suzuki H, Song E, Park JH. Targeting of miR34a-NOTCH1 axis reduced breast cancer stemness and chemoresistance. Cancer Res. 2014; 74:7573–7582. https://doi.org/10.1158/0008-5472.CAN-14-1140.
17. Lize M, Klimke A, Dobbelstein M. MicroRNA-449 in cell fate determination. Cell Cycle. 2011; 10:2874–2882. https://doi.org/10.4161/cc.10.17.17181.
18. Feng M, Yu Q. miR-449 regulates CDK-Rb-E2F1 through an auto-regulatory feedback circuit. Cell Cycle. 2010; 9:213–214. https://doi.org/10.4161/cc.9.2.10502.
19. Bou Kheir T, Futoma-Kazmierczak E, Jacobsen A, Krogh A, Bardram L, Hother C, Gronbaek K, Federspiel B, Lund AH, Friis-Hansen L. miR-449 inhibits cell proliferation and is down-regulated in gastric cancer. Mol Cancer. 2011; 10:29. https://doi.org/10.1186/1476-4598-10-29.
20. Yang X, Feng M, Jiang X, Wu Z, Li Z, Aau M, Yu Q. miR-449a and miR-449b are direct transcriptional targets of E2F1 and negatively regulate pRb-E2F1 activity through a feedback loop by targeting CDK6 and CDC25A. Gene Dev. 2009; 23:2388–2393. https://doi.org/10.1101/gad.1819009.
21. Buurman R, Gurlevik E, Schaffer V, Eilers M, Sandbothe M, Kreipe H, Wilkens L, Schlegelberger B, Kuhnel F, Skawran B. Histone deacetylases activate hepatocyte growth factor signaling by repressing microRNA-449 in hepatocellular carcinoma cells. Gastroenterology. 2012; 143:811–820 e811–815. https://doi.org/10.1053/j.gastro.2012.05.033.
22. Mao A, Zhao Q, Zhou X, Sun C, Si J, Zhou R, Gan L, Zhang H. MicroRNA-449a enhances radiosensitivity by downregulation of c-Myc in prostate cancer cells. Sci Rep. 2016; 6:27346. https://doi.org/10.1038/srep27346.
23. Miranda KC, Huynh T, Tay Y, Ang YS, Tam WL, Thomson AM, Lim B, Rigoutsos I. A pattern-based method for the identification of MicroRNA binding sites and their corresponding heteroduplexes. Cell. 2006; 126:1203–1217. https://doi.org/10.1016/j.cell.2006.07.031.
24. Pereira L, Yi F, Merrill BJ. Repression of Nanog gene transcription by Tcf3 limits embryonic stem cell self-renewal. Mol Cell Biol. 2006; 26:7479–7491. https://doi.org/10.1128/MCB.00368-06.
25. Yang ZF, Ho DW, Ng MN, Lau CK, Yu WC, Ngai P, Chu PW, Lam CT, Poon RT, Fan ST. Significance of CD90+ cancer stem cells in human liver cancer. Cancer Cell. 2008; 13:153–166. https://doi.org/10.1016/j.ccr.2008.01.013.
26. Shimono Y, Mukohyama J, Nakamura S, Minami H. MicroRNA regulation of human breast cancer stem cells. J Clin Med. 2015; 5. https://doi.org/10.3390/jcm5010002.
27. Fan T, Wang W, Zhang B, Xu Y, Chen L, Pan S, Hu H, Geng Q. Regulatory mechanisms of microRNAs in lung cancer stem cells. Springerplus. 2016; 5:1762. https://doi.org/10.1186/s40064-016-3425-5.
28. Loh YH, Wu Q, Chew JL, Vega VB, Zhang W, Chen X, Bourque G, George J, Leong B, Liu J, Wong KY, Sung KW, Lee CW, et al. The Oct4 and Nanog transcription network regulates pluripotency in mouse embryonic stem cells. Nat Genet. 2006; 38:431–440. https://doi.org/10.1038/ng1760.
29. Yin X, Zhang BH, Zheng SS, Gao DM, Qiu SJ, Wu WZ, Ren ZG. Coexpression of gene Oct4 and Nanog initiates stem cell characteristics in hepatocellular carcinoma and promotes epithelial-mesenchymal transition through activation of Stat3/Snail signaling. J Hematol Oncol. 2015; 8:23. https://doi.org/10.1186/s13045-015-0119-3.
30. Lu X, Mazur SJ, Lin T, Appella E, Xu Y. The pluripotency factor nanog promotes breast cancer tumorigenesis and metastasis. Oncogene. 2014; 33:2655–2664. https://doi.org/10.1038/onc.2013.209.
31. He L, He X, Lim LP, de Stanchina E, Xuan Z, Liang Y, Xue W, Zender L, Magnus J, Ridzon D, Jackson AL, Linsley PS, Chen C, et al. A microRNA component of the p53 tumour suppressor network. Nature. 2007; 447:1130–1134. https://doi.org/10.1038/nature05939.
32. Chang TC, Wentzel EA, Kent OA, Ramachandran K, Mullendore M, Lee KH, Feldmann G, Yamakuchi M, Ferlito M, Lowenstein CJ, Arking DE, Beer MA, Maitra A, et al. Transactivation of miR-34a by p53 broadly influences gene expression and promotes apoptosis. Mol Cell. 2007; 26:745–752. https://doi.org/10.1016/j.molcel.2007.05.010.
33. Li C, Lee CJ, Simeone DM. Identification of human pancreatic cancer stem cells. Methods Mol Biol. 2009; 568:161–173. https://doi.org/10.1007/978-1-59745-280-9_10.
34. Lodygin D, Tarasov V, Epanchintsev A, Berking C, Knyazeva T, Korner H, Knyazev P, Diebold J, Hermeking H. Inactivation of miR-34a by aberrant CpG methylation in multiple types of cancer. Cell Cycle. 2008; 7:2591–2600. https://doi.org/10.4161/cc.7.16.6533.
35. Ji Q, Hao X, Meng Y, Zhang M, Desano J, Fan D, Xu L. Restoration of tumor suppressor miR-34 inhibits human p53-mutant gastric cancer tumorspheres. BMC Cancer. 2008; 8:266. https://doi.org/10.1186/1471-2407-8-266.
36. Liu Y, Wang Y, Sun X, Mei C, Wang L, Li Z, Zha X. miR-449a promotes liver cancer cell apoptosis by downregulation of Calpain 6 and POU2F1. Oncotarget. 2016; 7:13491–13501. https://doi.org/10.18632/oncotarget.4821.
37. Zhang H, Feng Z, Huang R, Xia Z, Xiang G, Zhang J. MicroRNA-449 suppresses proliferation of hepatoma cell lines through blockade lipid metabolic pathway related to SIRT1. Int J Oncol. 2014; 45:2143–2152. https://doi.org/10.3892/ijo.2014.2596.
38. Schaniel C, Ang YS, Ratnakumar K, Cormier C, James T, Bernstein E, Lemischka IR, Paddison PJ. Smarcc1/Baf155 couples self-renewal gene repression with changes in chromatin structure in mouse embryonic stem cells. Stem Cells. 2009; 27:2979–2991. https://doi.org/10.1002/stem.223.
39. Lin G, Zhao L, Yin F, Lan R, Li L, Zhang X, Zhang H, Yang B. TCF3 inhibits F9 embryonal carcinoma growth by the down-regulation of Oct4. Oncol Rep. 2011; 26:893–899. https://doi.org/10.3892/or.2011.1376.
40. Rheinbay E, Suva ML, Gillespie SM, Wakimoto H, Patel AP, Shahid M, Oksuz O, Rabkin SD, Martuza RL, Rivera MN, Louis DN, Kasif S, Chi AS, et al. An aberrant transcription factor network essential for Wnt signaling and stem cell maintenance in glioblastoma. Cell Rep. 2013; 3:1567–1579. https://doi.org/10.1016/j.celrep.2013.04.021.