
INTRODUCTION
Although environmental factors explain most of cancer cases, inherited risk factors contribute to a various degree in development of different cancers [1]. Cancer syndromes are rare and typically involve families with early onset of disease. Most known cancer syndromes were first found to be associated with an increased risk of one tumor type such as breast cancer (BRCA1 and BRCA2) or colorectal cancer (APC and the DNA mismatch repair genes) [2–6]. The BRCA1 and BRCA2 genes were first reported as breast cancer predisposing genes [2, 3]. However, it was soon clear that ovarian cancer and pancreatic cancer were also associated with the syndromes [7, 8]. Lynch Syndrome was first defined as a syndrome of hereditary non-polyposis colorectal cancer [5, 6]. It is today known to involve a broad spectrum of tumors [9]. In general, cancer syndromes confer an increased risk of not just one tumor type but rather constitute an inherited predisposition to many different types of cancer.
Recently, different approaches have been used to find new cancer syndromes. The Utah Population Database, including the record of cancer data for 190,000 individuals diagnosed with cancer in Utah from 1958, proved that many cancer sites showed a heritable contribution, which was associated with other cancer sites [10]. The Swedish Family-Cancer Database (FCD), first created in the 1990s, contains more than one million cancers. Studies using this database, reported that lung cancer had a significant association with 13 other cancer types and most of them were smoking related, such as bladder-, esophagus-, liver-, cervical- and kidney cancer [11]. Using the network of case and control studies from Italy and Switzerland, it was reported that several potential cancer syndromes appear among close relatives in an early age [12]. Based on the Icelandic Cancer Society (ICR) database, it was found that genetic factors are involved in several cancers and also play an important role in the familial clustering of cancer [13]. Stomach and prostate cancers were involved in most pairs of the tested cancer sites [13]. This is consistent with our finding in a recent study of colorectal cancer families [14].
The global analysis of genome-wide association studies (GWAS) have primarily focused on single diseases [15–17]. However, combining large-scale GWA meta-analysis, new loci have been found to be associated with an increased risk of hormone-related cancers such as breast-, ovarian- and prostate cancer [18]. We have already shown that familial colorectal cancer is associated with higher risk for other cancers and thus these families seem to segregate genetic risk factors for many different cancers [14]. To define a new cancer risk alleles predisposing to a variety of cancer types, we conducted a GWAS in 3,555 cancer cases and 15,581 controls. Sweden has a fairly homogenous population and Swedish founder mutations are known in disease genes. Thus, we hypothesized that novel loci with a founder mutation could be possible to detect using a Swedish GWAS. The definition for a founder mutation is that it occurs on the same specific haplotype in a population and thus we used haplotype analysis rather than single SNP analysis for more power to detect a founder effect.
RESULTS
Haplotypes describe the linear relationship of a series of loci along the chromosome strand and in PLINK defined by a certain number of single SNP markers. Two haplotype analyses on sliding windows of 10 and 25 SNPs using 3,555 cancer cases and 15,581 healthy controls were conducted. The statistical analysis suggested seven loci associated with cancer risk and with a p-value <1.1×10⁻⁷ (Figure 1). Four risk haplotypes were found using window 10, on chromosomes 1, 11, 14, and 17 while three risk haplotypes were found using window 25, on chromosomes 7, 16 and 21 (Figure 1).
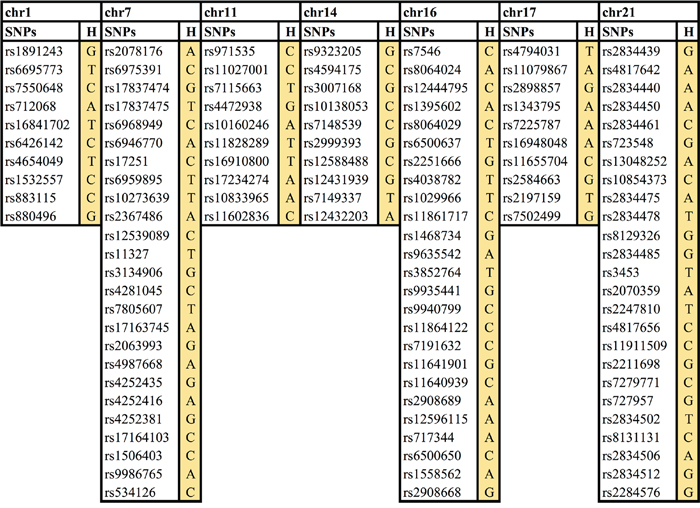
Figure 1: Seven novel cancer risk loci/haplotypes. Chr, chromosome, H, haplotype.
Further analysis was performed around each of these seven haplotypes to find out which exact haplotype at each locus had the best p-value. For the loci on chromosomes 7, 11, 16 and 17 the first identified haplotypes were the most statistically significant, while for the loci on chromosomes 1, 14 and 21, a slightly shorter or longer haplotype were even more statistically significant (Table 1).
Table 1: Haplotype frequency and odds ratio for the seven loci
Chr |
WS |
HFA |
HFC |
OR |
P Value |
BWS |
HFA |
HFC |
OR |
P Value |
|---|---|---|---|---|---|---|---|---|---|---|
1 |
10 |
0.012 |
0.007 |
1.67 |
8.49E-07 |
7 |
0.014 |
0.008 |
1.68 |
6.29E-07 |
7 |
25 |
0.010 |
0.005 |
1.9 |
3.03E-07 |
25 |
0.01 |
0.005 |
1.90 |
3.03E-07 |
11 |
10 |
0.021 |
0.013 |
1.61 |
6.13E-07 |
10 |
0.021 |
0.013 |
1.61 |
6.13E-07 |
14 |
10 |
0.029 |
0.020 |
1.45 |
4.52E-07 |
8 |
0.021 |
0.013 |
1.56 |
2.25E-07 |
16 |
25 |
0.011 |
0.006 |
1.83 |
3.01E-07 |
25 |
0.011 |
0.006 |
1.83 |
3.01E-07 |
17 |
10 |
0.041 |
0.030 |
1.35 |
7.27E-07 |
10 |
0.041 |
0.030 |
1.35 |
7.27E-07 |
21 |
25 |
0.013 |
0.030 |
0.41 |
4.73E-07 |
31 |
0.013 |
0.031 |
0.41 |
3.04E-07 |
Chr, chromosome; HFA, haplotype frequency in affected; HFC, haplotype frequency in controls; OR, odds ratio; WS, window size; BWS, best window size.
All risk haplotypes had odds ratio (ORs) of 1.3-1.9, except the locus on chromosome 21, which had an OR of 0.4, thus the minor allele was associated with a decreased cancer risk. The 6 risk haplotypes were searched for among 104 familial cancer patients (from 58 breast cancer families and 46 colorectal cancer (CRC) families). Seven families had family members with the haplotypes on chromosomes 7, 14, 16 and 17 (Figure 2). Family 242 (Co-666) and family 397 (Co-1123) had the suggested haplotype on chromosome 7, family 87 (Co-1179) and family 1275 (Al-77) the haplotype on chromosome 14, family 134 (Co-276) the haplotype on chromosome 16, and family 288 (Co-1141) and family 2606 (Al-161) the haplotype on chromosome 17. Several other family members could have the haplotypes but were not fully informative for all markers (Supplementary Table 1). Some of the patients had more than one complete or incomplete haplotype.
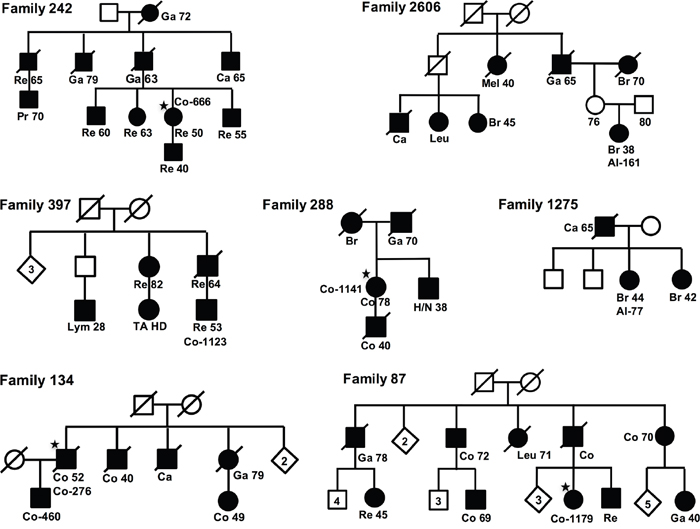
Figure 2: Pedigrees. Pedigrees for the seven families, fulfilling one (of four) risk-haplotypes. For each family the case with the risk haplotype is indicated with sample-ID (★), and for all cases are shown diagnoses, Re, Rectal Cancer; Ga, Gastric Cancer; Br, Breast Cancer; Ca, Cancer; Co, Colon Cancer; Leu, Leukemia; Lym, Lymphoma; H/N, Head and Neck Cancer; Mel, Melanoma; Pr, Prostate Cancer.
Exome sequencing data were available for one patient with a full haplotype for the loci on chromosome 7, 14, 16 and 17 (Co-666 from family 242, Co-1179 from family 87, Co-460 from family 134 and Co-1141 from family 288). All non-exonic and synonymous variants, and those with a Minor Allele Frequency (MAF) >20% in 1000Genomes (1000G) or ExAC Non-Finnish European (NFE) were excluded.
For the locus on chromosome 7, three variants in the PRSS1 gene, were found in the sample with the complete haplotype (Co-666). The first one, rs145867820 was also found in one other sample (Co-1053) with incomplete haplotype for this region. It was considered pathogenic by seven of nine bioinformatics functional tools. The frequency of the minor SNP allele (T) in ExAC and 1000G was 0.007 and 0.03, respectively, and in our 294 unrelated familial cases 0.05. This SNP was tested using TaqMan assay in 378 unrelated familial cancer cases and 379 controls and the result did not suggest any risk associated to this SNP (OR<1, frequency in cases 2% and in controls 3%). The second variant, rs200070487, was predicted to be pathogenic by all nine bioinformatics functional tools, the frequency of G allele was 0.01 in both ExAC and 1000G. None of the three patients (Co-1053, Co-851 and Co-700) with incomplete haplotypes had it. The frequency of the G allele among 294 unrelated familial cases was 0.20. It was not possible to generate a probe for this SNP for TaqMan assay. The third variant, rs200902389, was predicted pathogenic by one of the nine bioinformatics functional tools. Two patients from three other families with incomplete haplotypes also bore this variant (Co-700 and Co-1053). The frequency of the A allele in ExAC was 0.003 and in 1000G <0.01. The frequency of the A allele among 294 familial cases was 0.12. The TaqMan assay for this SNP failed. Thus, it could not be ruled out that rs200070487, or even rs200902389, could be associated with an increased risk.
The patient (Co-1179) with the chromosome 14 haplotype had no exonic variant. The patient (Co-460) with the chromosome 16 haplotype, had one variant in the PPL gene, which was considered too common (MAF=0.53) since the frequency of the risk haplotype was estimated to 1%. One patient with the chromosome 17 haplotype (Co-1141) had one variant in the ZNF652 gene, the frequency of which in ExAC was 0.00002, and thus it was considered too rare to explain a risk haplotype with a frequency of 4%.
Next, analyses were undertaken to find out what haplotypes and possible loci were missed by our approach using only window sizes 10 and 25. A sliding window analysis consists of different sets of contiguous loci at various sliding positions [19]. The whole genome was searched with a sliding window strategy testing windows ranging from 1 to 25 markers. In total, nineteen additional loci showed a p-value less than 10-6 in different window sizes, and one haplotype on chromosome 13 even reached 6.45×10⁻⁸(window size 21, rs912593-rs9599474, OR=2) (Supplementary Table 2). None of these loci were considered statistically significant due to multiple testing.
Using the sliding window information within the seven suggested loci, including all windows with OR >1 and p <0.05, the analysis suggested that four of the risk loci could be attributed by more than one risk variant within the haplotype, such as for the loci on chromosomes 7, 16, 17 and 21, while the haplotypes on chromosomes 1, 11, and 14 suggested only one risk variant (Supplementary Figures 1-4).
DISCUSSION
Our genome-wide haplotype association study using Swedish Twin Registry for 3,555 cancer cases and 15,581 healthy controls suggested seven loci associated with cancer risk (Table 1). All were rare (allele frequency 1-2%), and minor alleles of six of them were associated with increased cancer risks, while one was associated with a lower risk of cancer.
Comparing the six cancer risk haplotypes with our familial breast and colorectal cancer patients, seven families showed well-matched haplotypes for four of those risk loci, on chromosomes 7, 14, 16 and 17 (Figure 2 and Supplementary Table 1). By studying exome sequencing data from family members, we searched genes for those four haplotype regions. Although no clear disease-causing mutation was found, the data still supported the loci as risk susceptibility regions since at least four of the haplotypes were present in known cancer families. The causal variants may be located within regulatory regions. In fact, most risk loci identified from earlier GWASes have risk-associated SNPs far from genes, which were still considered relevant and potentially targeting adjacent genes or genetic elements such as RNAs or enhancer regions [15–18].
There are many genes located in the candidate regions on chromosome 7, such as PRSS1, EPHB6, TRPV6, TRPV5 and PIP. The genes PRSS1, TRPV5 and PIP have so far been implicated in a few cancer types (pancreatic-, non-small cell lung- and breast cancer), while EphB6 and TRPV6 have been studied in relation to numerous cancer types. In this study, we found three missense variants in the PRSS1 gene. One did not show any significant difference in allele frequency between cases and controls in subsequent validation, whereas the other two could not be ruled out, and need to be tested in further studies for conclusive results. EphB6 overexpression together with APC gene mutations was suggested to promote the development of colorectal tumors [20]. A germline missense mutation in EphB6 has been suggested to possibly predispose to familial CRC [21]. The same gene has been suggested to harbor driver mutations in melanoma [22], and the Eph family receptors have been implicated in tumor progression and clinical outcome in several malignancies including tongue squamous cell-, ovarian-, gastric-, breast-, non-small cell lung cancer, melanoma and neuroblastoma [23–29]. The EphB6 has also been studied in thyroid-, and prostate cancer [30, 31]. Up-regulation of the TRPV6 Ca2+ channel in prostate cancer cells was suggested to promote cell proliferation rate, and to increase survival and apoptosis resistance in prostate cancer cells [32]. TRPV6 was highly expressed in estrogen receptor-negative breast cancer cells, regulating their proliferation, suggesting that TRPV6 can be a potential therapeutic target in these cancers [33]. Studies in candidate cancer genes including EPHB6/TRPV6 found two SNPs in EPHB6/TRPV6 marginally associated with survival in CRC [34]. The TRPV6 gene has also been suggested to influence prognosis in cervical- and esophagus squamous cell cancer, as well as in non-small cell lung cancer [35–37]. Sliding window analysis suggested that more than one gene in this risk haplotype could contribute to the increased risk. (Supplementary Figure 1).
The TMX1 gene, located in the risk region on chromosome 14, has been reported to be widely expressed in normal human tissues, and has been suggested to act as a tumor suppressor [38]. For this locus, the sliding window analysis suggested one contributing risk locus, involving the TMX1 gene (Supplementary Figure 2).
The risk region on chromosome 16 contains candidate genes such as PPL and GLYR1. Primarily the PPL gene has been suggested to play a role in many cancers. The gene has an important role in skin tumor-protection [39]. PPL has also been reported to be relevant in prognosis in urothelial carcinoma of the urinary bladder-, colorectal -, esophageal-, endometrial cancer and triple-negative breast cancer [40–44]. Somatic mutations in the GLYR1 have been suggested to drive tumorigenesis in microsatellite unstable tumors [45]. For this risk haplotype, sliding window analysis suggested at least two possible risk loci on the haplotype, involving the PPL and other genes (Supplementary Figure 3).
The region on chromosome 17 harbors two strong candidate cancer genes, ZNF652, and PHB. ZNF652 is a known prostate cancer candidate gene. The protein expression in androgen receptor positive prostate cancer cells is associated with prostate cancer outcome and relapse [46]. It has also been suggested that ZNF652 plays a role in the development of breast cancer [47] and vulvar squamous cell carcinoma [48]. PHB is evolutionarily conserved and plays an important role in human cellular senescence and tumor suppression [49]. A single nucleotide polymorphism has been suggested to increase the risk of breast cancer [50–52]. It has also been suggested to be implicated in prognosis in colorectal-, and bladder cancer [53, 54]. The PHB has also been suggested as a potential biomarker for gastric cancer and to be involved in prostate-, and papillary thyroid cancer [55–57]. For this candidate haplotype, the sliding window analysis suggested three, non-overlapping, possible risk loci contributing to the increased risk (Supplementary Figure 4).
The locus on chromosome 1 holds the gene CNIH3, not known to be involved in any type of cancer, and the locus on chromosome 11 harbors the non-coding RNA gene RP11-266A24.1. The chromosome 21 locus involves potentially interesting genes for cancer development/protection. KCNE2 encodes a voltage-gated potassium channel ancillary subunit and is highly expressed in gastric parietal cells, and was suggested to suppress the proliferation of gastric cancer [58]. The RCAN1 gene was up-regulated in cancer cells, resulting in inhibition of the cell motility, and RCAN1 knockdown was suggested to promote thyroid cancer tumor growth [59].
This study design used only two window-sizes, 10 and 25, to explore possible novel cancer risk loci in a Swedish population. Analysis with window size ranging from 1 to 25 could demonstrate that another nineteen haplotypes could be of interest. Importantly, these analyses suggested that for some haplotypes (loci), the genetic risk could result from mutations related to more than one gene. Thus, it is possible that some of the candidate haplotypes hold mutations in two or even more of the candidate genes discussed above. If we had searched all windows up to 25 for the first study, only one would have been statistically significant because of multiple testing.
In conclusion, the strategy of haplotype analysis was facilitated by the fact that Sweden has a relatively homogenous population and identified seven novel candidate risk loci, with specific Swedish haplotypes to be associated with an increased risk of cancer. The result showed ORs higher than most previous GWASes, performed in mostly single cancer types, and using single SNP-analysis. However, these genetic risk loci should be relevant in all populations. It was also suggested that one haplotype could consist of more than one contributing cancer risk allele, possibly involving multiple genes. This could also be one reason why these loci have higher ORs compared to what is seen in many other, single-SNP related, GWASes. Further studies will be necessary to confirm these loci and risk association, and to find out what tumor spectrum is associated with these loci.
MATERIALS AND METHODS
Haplotype GWAS in 3,555 cancer cases and 15,581 healthy controls
The GWAS was based on two datasets (TwinGene and PsychArray) from the population-based Swedish Twin Registry [60]. Phenotypic data on cancer were obtained through linking the twins to the Swedish Cancer Registry using the unique person identification number available for all Swedish citizens. In this study, cases were cancer patients selected from twin pairs where at least one twin was affected by any type of cancer, and controls were selected from twin pairs where none was affected. Only one twin from each twin pair was included in the analysis.
Familial cancer cases
Patients from families undergoing genetic counseling in the department of Clinical Genetics, Karolinska University Hospital have been recruited for genetic studies to find predisposing genes. Families with mutations in known cancer genes were excluded. Familial cancer cases were defined as coming from families where at least two first or second-degree relatives were affected with colorectal- or breast cancer. To be able to study haplotypes in familial cancer patients, a sample from at least on child or parent to each patient had been obtained.
Samples used in Taqman experiment
TaqMan experiment test candidate variants used 378 familial cases described above and 379 controls from the Swedish Colorectal Cancer Low-Risk Study [14], which recruited consecutive colorectal cancer cases and their spouses as controls.
Genotyping and quality control (QC) of twins
Genome DNA was extracted from peripheral blood samples for both the cases and the controls using standard procedures. In the TwinGene study, DNA from 9,836 individual subjects was genotyped with Illumina OmniExpress bead chip; whereas in PsychArray, 18,560 twins were genotyped using the Illumina Infinium PsychArray-24 BeadChip. Both studies include all available dizygotic twins and one twin in each pair of monozygotic twins.
For the quality control (QC) of the TwinGene study, variants were excluded from analysis if call rate was <=0.97, minor allele frequency was <1% or if the variant deviated significantly from Hardy-Weinberg equilibrium (p <=1×10⁻⁷). Samples were removed in case of genotyping success rate <97%, gender discrepancy between reported and X-chromosome heterozygosity-predicted, abnormal heterozygosity (>3 standard deviations from mean) or detection of cryptic relatedness. In total, 9617 individuals and 644556 SNPs remained after the QC. And in the PsychArray study, variants were excluded from analysis if call rate was <0.98, cross-batch discordance >10%, more than one discordant genotype within monozygotic twin pairs, deviated significantly from Hardy-Weinberg equilibrium (p <1×10⁻⁷), significantly associated with more than one genotyping batch (at p <5×10⁻⁸), the variant calling was poor (Y-chromosomal or mitochondrial) or the allele frequency differed by >10% (absolute difference) from that of 1000 Genomes European samples and mean GenCall scores are <0.5. Samples were excluded in case of genotyping success rate <98%, gender discrepancy between reported and X-chromosome heterozygosity-predicted, abnormal heterozygosity (autosomal inbreeding coefficient F outside ±0.2), possible sample contamination (relatedness with other samples >6 standard deviations from mean in a random set of 1000 samples) or evidence of non-European ancestry (>6 standard deviations from the mean values of the first two principal components in 1000 Genomes European population). 17,898 individuals and 561,187 markers passed the QC.
Quality control of the merged data set
To be used in this association study on cancer risk, the TwinGene study (2,457 cancer cases and 4,441 controls) were merged with the PsychArray study (1,099 cancer cases and 11,239 controls) and analyzed for the 237,799 markers existing in both datasets using PLINK [61]. In the analysis, 59 markers were removed due to inconsistent strand coding. Therefore, a total of 19,236 individuals (3,556 cases and 15,680 controls) and 237,740 markers were included in the analysis. Next, heterozygous haploid genotypes were excluded as well as samples with gender inconsistency and same position variants. In the next stage, 237,740 SNPs and 19,236 individuals (3,556 cases and 15,680 controls) were merged and SNPs with <98% call rate, <5% minor allele frequency (MAF), and those inconsistent with Hardy–Weinberg equilibrium in controls, were removed. In the final stage, 226,883 SNPs and 19,236 individuals (3,556 cases and 15,680 controls) remained and a multidimensional scaling (MDS) analysis was conducted on all the remaining markers for the purpose of population stratification and to identifying ethnic outliers. These outliers were excluded from the dataset while the remaining were plotted in an MDS plot (Supplementary Figure 5). In the end, 226,883 SNPs and 19,136 individuals (3,555 cases and 15,581 controls) remained for further downstream analyses.
Genotyping of familial samples for testing of haplotypes
Genomic DNA was extracted from peripheral blood using standard procedures. Genotyping of a total of 587 individuals, familial CRC cases and their relatives, was performed by the Illumina Infinium assay using the Illumina HumanOmniExpress-12v1_H BeadChip. The results on 730,525 SNPs, were analyzed using the software GenomeStudio 2011.1 from Illumina Inc. Average sample call rate per SNP with sample call rate >0 was >99% and the overall reproducibility >99.99%. Arrays were processed according to manufactures’ protocol at the SNP&SEQ Technology Platform at Uppsala University and is available on request (www.genotyping.se).
Exome sequencing
Genome DNA extracted from peripheral blood was quantified using the Qubit Flurometer (Life Technologies). Sequencing libraries were prepared according to the TruSeq DNA Sample Preparation Kit EUC 15005180 or EUC 15026489 (Illumina). 1-1.5 μg of genomic DNA was fragmented using a Covaris sonicator (Covaris, Inc.). Thirty-seven of the DNA samples were fragmented according to the Covaris 400bp protocol and sixty-one samples were fragmented according to the SureSelect Protocol. After the fragmentation, all samples were subjected to end-repair, A-tailing, and adaptor ligation of Illumina Multiplexing PE adaptors. An additional gel-based size selection step was performed for the 37 samples. The adapter-ligated fragments were subsequently enriched by PCR followed by purification using Agencourt AMPure Beads (Beckman Coulter). Exome capture was performed by pre-pooling equimolar amounts and performing enrichment in 5- or 6-plex reactions according to the TruSeq Exome Enrichment Kit Protocol (EUC 15013230). The library size was checked on a Bioanalyzer High Sensitivity DNA chip (Agilent Technologies) while concentration was calculated by quantitative PCR. Pooled DNA libraries were clustered on a cBot instrument (Illumina) using the TruSeq PE Cluster Kit v3. Paired-end sequencing was performed for 100 cycles using a HiSeq 2000 instrument (Illumina) with TruSeq SBS Chemistry v3, according to the manufacturer’s protocol. Base calling was performed with RTA (1.12.4.2 or 1.13.48) and the resulting BCL files were filtered, de-multiplexed, and converted to FASTQ format using CASAVA 1.7 or 1.8 (Illumina). Data were analyzed using the bcbb package (https://github.com/chapmanb/bcbb). After sequencing, the reads were aligned to the reference genome hg19 (GRCh37) using BWA, sorted and PCR duplicates were removed with Picard. The calculation of mapping and enrichment statistics were done with Picard and GATK. Variants were called using GATK and followed by a best practice procedure implemented at the Broad Institute [62].
Mutation annotation
The output mutations in variant call format (vcf) were annotated using ANNOVAR [63], which generated an Excel-compatible file with gene annotation, amino acid change annotation, dbSNP identifiers [64], and 1000 Genomes Project allele frequencies [65].
Functional prediction
Pathogenicity of variants was predicted by nine bioinformatics functional tools which were: SIFT, Polyphen2_HDIV (Polymorphism Phenotyping v2), Polyphen2_HVAR, LRT, Mutation Taster, Mutation Assessor, FATHMM (Functional Analysis through Hidden Markov Models), RadialSVM, LR (Likelihood Ratio test).
TaqMan assay
A total of 378 cancer cases and 379 controls were genotyped using TaqMan genotyping Assay (Applied Biosystems, Foster City, CA, USA). Primer of rs145867820’s context sequence[VIC/FAM]:CACCATGCCTGCCCTGCCCATCAGC[C/T]GCATCCAGGTGAGA CTGGGAGAGCA. Primer of rs200902389’s context sequence [VIC/FAM]: CCCTGTGGTCTGCAATGGACA GCTCCAAGGA[G/A]TTGTCTCCTGGGGTGATGGCT GTGCCCAGA.
Statistical analysis
A logistic regression model was employed to examine the association between one single SNP or a haplotype and cancer risk. Corresponding OR, standard errors, 95% confidence intervals and P values were calculated accordingly using PLINK v1.07 [61]. An MDS plot showing P values sorted by chromosomal position was generated to provide a visual illustration of top association findings across the genome. Bonferroni-adjusted P value criteria for genome-wide statistical significance of SNP was p < 1.1×10⁻⁷.
Author contributions
Wen Liu contributed to conception, quality control of the merged datasets, data analysis, and writing the manuscript. Xiang Jiao contributed to data analysis. Jessada Thutkawkorapin contributed to bioinformatics analysis. Hovsep Mahdessian was involved in the design of analysis and quality control of datasets. Annika Lindblom contributed to conception, analysis and writing the manuscript. All authors were involved in writing of the manuscript and approved the final manuscript before submission.
ACKNOWLEDGMENTs
We thank all patients for their contribution. We acknowledge the possibilities to perform this study provided by the Swedish Twin Registry. Genotyping was performed by the SNP&SEQ Technology Platform in Uppsala, which is supported by Uppsala University, Uppsala University Hospital, Science for Life Laboratory – Uppsala and the Swedish Research Council (Contracts 80576801 and70374401).
CONFLICTS OF INTEREST
The authors declare that they have no competing of interests.
FUNDING
The study was supported by grants from the Swedish research council; K2015-55X-22674-01-4, K2008-55X-20157-03-3, K2006-72X-20157-01- 2, The Swedish Cancer Society 160458, The Stockholm Cancer Society 161183, and the Stockholm County Council (ALF projects).
REFERENCES
1. Lichtenstein P, Holm NV, Verkasalo PK, Iliadou A, Kaprio J, Koskenvuo M, Pukkala E, Skytthe A, Hemminki K. Environmental and heritable factors in the causation of cancer—analyses of cohorts of twins from Sweden, Denmark, and Finland. N Engl J Med. 2000; 343: 78-85. https://doi.org/10.1056/NEJM200007133430201.
2. Miki Y, Swensen J, Shattuck-Eidens D, Futreal PA, Harshman K, Tavtigian S, Liu Q, Cochran C, Bennett LM, Ding W, Bell R, Rosenthal J, Hussey C, et al. A strong candidate for the breast and ovarian cancer susceptibility gene BRCA1. Science. 1994; 266: 66-71.
3. Wooster R, Neuhausen SL, Mangion J, Quirk Y, Ford D, Collins N, Nguyen K, Seal S, Tran T, Averill D, Fields P, Marshall G, Narod S, et al. Localization of a breast cancer susceptibility gene, BRCA2, to chromosome 13q12-13. Science. 1994; 265: 2088-90.
4. Groden J, Thliveris A, Samowitz W, Carlson M, Gelbert L, Albertsen H, Joslyn G, Stevens J, Spirio L, Robertson M, Sargeant L, Krapcho K, Wolff E, et al. Identification and characterization of the familial adenomatous polyposis coli gene. Cell. 1991; 66: 589-600.
5. Leach FS, Nicolaides NC, Papadopoulos N, Liu B, Jen J, Parsons R, Peltomaki P, Sistonen P, Aaltonen LA, Nystrom-Lahti M, Guan XY, Zhang J, Meltzer PS, et al. Mutations of a mutS homolog in hereditary nonpolyposis colorectal cancer. Cell. 1993; 75: 1215-25.
6. Bronner CE, Baker SM, Morrison PT, Warren G, Smith LG, Lescoe MK, Kane M, Earabino C, Lipford J, Lindblom A, Tannergard P, Bollag RJ, Godwin AR, et al. Mutation in the DNA mismatch repair gene homologue hMLH1 is associated with hereditary non-polyposis colon cancer. Nature. 1994; 368: 258-61. https://doi.org/10.1038/368258a0.
7. Ford D, Easton DF, Bishop DT, Narod SA, Goldgar DE. Risks of cancer in BRCA1-mutation carriers. Breast Cancer Linkage Consortium. Lancet. 1994; 343: 692-5.
8. Breast Cancer Linkage Consortium. Cancer risks in BRCA2 mutation carriers. J Natl Cancer Inst. 1999; 91: 1310-6.
9. Moller P, Seppala T, Bernstein I, Holinski-Feder E, Sala P, Evans DG, Lindblom A, Macrae F, Blanco I, Sijmons R, Jeffries J, Vasen H, Burn J, et al. Cancer incidence and survival in Lynch syndrome patients receiving colonoscopic and gynaecological surveillance: first report from the prospective Lynch syndrome database. Gut. 2017; 66: 464-72. https://doi.org/10.1136/gutjnl-2015-309675.
10. Teerlink CC, Albright FS, Lins L, Cannon-Albright LA. A comprehensive survey of cancer risks in extended families. Genet Med. 2012; 14: 107-14. https://doi.org/10.1038/gim.2011.2.
11. Hemminki K, Sundquist J, Brandt A. Do discordant cancers share familial susceptibility? Eur J Cancer. 2012; 48: 1200-7. https://doi.org/10.1016/j.ejca.2011.09.017.
12. Turati F, Edefonti V, Bosetti C, Ferraroni M, Malvezzi M, Franceschi S, Talamini R, Montella M, Levi F, Dal Maso L, Serraino D, Polesel J, Negri E, et al. Family history of cancer and the risk of cancer: a network of case-control studies. Ann Oncol. 2013; 24: 2651-6. https://doi.org/10.1093/annonc/mdt280.
13. Amundadottir LT, Thorvaldsson S, Gudbjartsson DF, Sulem P, Kristjansson K, Arnason S, Gulcher JR, Bjornsson J, Kong A, Thorsteinsdottir U, Stefansson K. Cancer as a complex phenotype: pattern of cancer distribution within and beyond the nuclear family. PLoS Med. 2004; 1: e65. https://doi.org/10.1371/journal.pmed.0010065.
14. Forsberg A, Keranen A, von Holst S, Picelli S, Papadogiannakis N, Ghazi S, Lindblom A. Defining new colorectal cancer syndromes in a population-based cohort of the disease. Anticancer Res. 2017; 37: 1831-5. https://doi.org/10.21873/anticanres.11518.
15. Michailidou K, Hall P, Gonzalez-Neira A, Ghoussaini M, Dennis J, Milne RL, Schmidt MK, Chang-Claude J, Bojesen SE, Bolla MK, Wang Q, Dicks E, Lee A, et al. Large-scale genotyping identifies 41 new loci associated with breast cancer risk. Nat Genet. 2013; 45: 353-61, 61e1-2. https://doi.org/10.1038/ng.2563.
16. Goode EL, Chenevix-Trench G, Song H, Ramus SJ, Notaridou M, Lawrenson K, Widschwendter M, Vierkant RA, Larson MC, Kjaer SK, Birrer MJ, Berchuck A, Schildkraut J, et al. A genome-wide association study identifies susceptibility loci for ovarian cancer at 2q31 and 8q24. Nat Genet. 2010; 42: 874-9. https://doi.org/10.1038/ng.668.
17. Cheng TH, Thompson DJ, O'Mara TA, Painter JN, Glubb DM, Flach S, Lewis A, French JD, Freeman-Mills L, Church D, Gorman M, Martin L; National Study of Endometrial Cancer Genetics Group, et al. Five endometrial cancer risk loci identified through genome-wide association analysis. Nat Genet. 2016; 48: 667-74. https://doi.org/10.1038/ng.3562.
18. Kar SP, Beesley J, Amin Al Olama A, Michailidou K, Tyrer J, Kote-Jarai Z, Lawrenson K, Lindstrom S, Ramus SJ, Thompson DJ, Investigators A, Kibel AS, Dansonka-Mieszkowska A, et al. Genome-wide meta-analyses of breast, ovarian, and prostate cancer association studies identify multiple new susceptibility loci shared by at least two cancer types. Cancer Discov. 2016; 6: 1052-67. https://doi.org/10.1158/2159-8290.CD-15-1227.
19. Mishima H, Lidral AC, Ni J. Application of the Linux cluster for exhaustive window haplotype analysis using the FBAT and Unphased programs. BMC Bioinformatics. 2008; 9: S10. https://doi.org/10.1186/1471-2105-9-S6-S10.
20. Xu D, Yuan L, Liu X, Li M, Zhang F, Gu XY, Zhang D, Yang Y, Cui B, Tong J, Zhou J, Yu Z. EphB6 overexpression and Apc mutation together promote colorectal cancer. Oncotarget. 2016; 7: 31111-21. https://doi.org/10.18632/oncotarget.9080.
21. Gylfe AE, Sirkia J, Ahlsten M, Jarvinen H, Mecklin JP, Karhu A, Aaltonen LA. Somatic mutations and germline sequence variants in patients with familial colorectal cancer. Int J Cancer. 2010; 127: 2974-80. https://doi.org/10.1002/ijc.25529.
22. Kaji T, Yamasaki O, Takata M, Otsuka M, Hamada T, Morizane S, Asagoe K, Yanai H, Hirai Y, Umemura H, Iwatsuki K. Comparative study on driver mutations in primary and metastatic melanomas at a single Japanese institute: a clue for intra- and inter-tumor heterogeneity. J Dermatol Sci. 2017; 85: 51-7. https://doi.org/10.1016/j.jdermsci.2016.10.006.
23. Mateo-Lozano S, Bazzocco S, Rodrigues P, Mazzolini R, Andretta E, Dopeso H, Fernandez Y, Del Llano E, Bilic J, Suarez-Lopez L, Macaya I, Carton-Garcia F, Nieto R, et al. Loss of the EPH receptor B6 contributes to colorectal cancer metastasis. Sci Rep. 2017; 7: 43702. https://doi.org/10.1038/srep43702.
24. Dong Y, Pan J, Ni Y, Huang X, Chen X, Wang J. High expression of EphB6 protein in tongue squamous cell carcinoma is associated with a poor outcome. Int J Clin Exp Pathol. 2015; 8: 11428-33.
25. Gu Y, Li F, Qian N, Chen X, Wang H, Wang J. Expression of EphB6 in ovarian serous carcinoma is associated with grade, TNM stage and survival. J Clin Pathol. 2016; 69: 448-53. https://doi.org/10.1136/jclinpath-2015-203160.
26. Nakagawa M, Inokuchi M, Takagi Y, Kato K, Sugita H, Otsuki S, Kojima K, Uetake H, Sugihara K. Erythropoietin-producing hepatocellular A1 is an independent prognostic factor for gastric cancer. Ann Surg Oncol. 2015; 22: 2329-35. https://doi.org/10.1245/s10434-014-4231-3.
27. Yu J, Bulk E, Ji P, Hascher A, Tang M, Metzger R, Marra A, Serve H, Berdel WE, Wiewroth R, Koschmieder S, Muller-Tidow C. The EPHB6 receptor tyrosine kinase is a metastasis suppressor that is frequently silenced by promoter DNA hypermethylation in non-small cell lung cancer. Clin Cancer Res. 2010; 16: 2275-83. https://doi.org/10.1158/1078-0432.CCR-09-2000.
28. Hafner C, Bataille F, Meyer S, Becker B, Roesch A, Landthaler M, Vogt T. Loss of EphB6 expression in metastatic melanoma. Int J Oncol. 2003; 23: 1553-9.
29. Tang XX, Evans AE, Zhao H, Cnaan A, London W, Cohn SL, Brodeur GM, Ikegaki N. High-level expression of EPHB6, EFNB2, and EFNB3 is associated with low tumor stage and high TrkA expression in human neuroblastomas. Clin Cancer Res. 1999; 5: 1491-6.
30. Giaginis C, Alexandrou P, Poulaki E, Delladetsima I, Troungos C, Patsouris E, Theocharis S. Clinical significance of EphB4 and EphB6 expression in human malignant and benign thyroid lesions. Pathol Oncol Res. 2016; 22: 269-75. https://doi.org/10.1007/s12253-014-9879-2.
31. Mohamed ER, Noguchi M, Hamed AR, Eldahshoury MZ, Hammady AR, Salem EE, Itoh K. Reduced expression of erythropoietin-producing hepatocyte B6 receptor tyrosine kinase in prostate cancer. Oncol Lett. 2015; 9: 1672-6. https://doi.org/10.3892/ol.2015.2925.
32. Gkika D, Prevarskaya N. TRP channels in prostate cancer: the good, the bad and the ugly? Asian J Androl. 2011; 13: 673-6. https://doi.org/10.1038/aja.2011.18.
33. Peters AA, Simpson PT, Bassett JJ, Lee JM, Da Silva L, Reid LE, Song S, Parat MO, Lakhani SR, Kenny PA, Roberts-Thomson SJ, Monteith GR. Calcium channel TRPV6 as a potential therapeutic target in estrogen receptor-negative breast cancer. Mol Cancer Ther. 2012; 11: 2158-68. https://doi.org/10.1158/1535-7163.MCT-11-0965.
34. Huhn S, Bevier M, Pardini B, Naccarati A, Vodickova L, Novotny J, Vodicka P, Hemminki K, Forsti A. Colorectal cancer risk and patients' survival: influence of polymorphisms in genes somatically mutated in colorectal tumors. Cancer Causes Control. 2014; 25: 759-69. https://doi.org/10.1007/s10552-014-0379-1.
35. Sun F, Xiao L, Jang XX, Xiong Y, Li Q, Yue XJ, Wei YJ, Wei YX, Ma YL, Yu YH. TRPV6 is a prognostic marker in early-stage cervical squamous cell carcinoma. Tumour Biol. 2016. https://doi.org/10.1007/s13277-016-5368-4.
36. Zhang SS, Xie X, Wen J, Luo KJ, Liu QW, Yang H, Hu Y, Fu JH. TRPV6 plays a new role in predicting survival of patients with esophageal squamous cell carcinoma. Diagn Pathol. 2016; 11: 14. https://doi.org/10.1186/s13000-016-0457-7.
37. Fan H, Shen YX, Yuan YF. Expression and prognostic roles of TRPV5 and TRPV6 in non-small cell lung cancer after curative resection. Asian Pac J Cancer Prev. 2014; 15: 2559-63.
38. Raturi A, Gutierrez T, Ortiz-Sandoval C, Ruangkittisakul A, Herrera-Cruz MS, Rockley JP, Gesson K, Ourdev D, Lou PH, Lucchinetti E, Tahbaz N, Zaugg M, Baksh S, et al. TMX1 determines cancer cell metabolism as a thiol-based modulator of ER-mitochondria Ca2+ flux. J Cell Biol. 2016; 214: 433-44. https://doi.org/10.1083/jcb.201512077.
39. Natsuga K, Cipolat S, Watt FM. Increased bacterial load and expression of antimicrobial peptides in skin of barrier-deficient mice with reduced cancer susceptibility. J Invest Dermatol. 2016; 136: 99-106. https://doi.org/10.1038/JID.2015.383.
40. Matsumoto K, Ikeda M, Sato Y, Kuruma H, Kamata Y, Nishimori T, Tomonaga T, Nomura F, Egawa S, Iwamura M. Loss of periplakin expression is associated with pathological stage and cancer-specific survival in patients with urothelial carcinoma of the urinary bladder. Biomed Res. 2014; 35: 201-6.
41. Li X, Zhang G, Wang Y, Elgehama A, Sun Y, Li L, Gu Y, Guo W, Xu Q. Loss of periplakin expression is associated with the tumorigenesis of colorectal carcinoma. Biomed Pharmacother. 2017; 87: 366-74. https://doi.org/10.1016/j.biopha.2016.12.103.
42. Otsubo T, Hagiwara T, Tamura-Nakano M, Sezaki T, Miyake O, Hinohara C, Shimizu T, Yamada K, Dohi T, Kawamura YI. Aberrant DNA hypermethylation reduces the expression of the desmosome-related molecule periplakin in esophageal squamous cell carcinoma. Cancer Med. 2015; 4: 415-25. https://doi.org/10.1002/cam4.369.
43. Suzuki A, Horiuchi A, Ashida T, Miyamoto T, Kashima H, Nikaido T, Konishi I, Shiozawa T. Cyclin A2 confers cisplatin resistance to endometrial carcinoma cells via up-regulation of an Akt-binding protein, periplakin. J Cell Mol Med. 2010; 14: 2305-17. https://doi.org/10.1111/j.1582-4934.2009.00839.x.
44. Choi YK, Woo SM, Cho SG, Moon HE, Yun YJ, Kim JW, Noh DY, Jang BH, Shin YC, Kim JH, Shin HD, Paek SH, Ko SG. Brain-metastatic triple-negative breast cancer cells regain growth ability by altering gene expression patterns. Cancer Genomics Proteomics. 2013; 10: 265-75.
45. Alhopuro P, Sammalkorpi H, Niittymaki I, Bistrom M, Raitila A, Saharinen J, Nousiainen K, Lehtonen HJ, Heliovaara E, Puhakka J, Tuupanen S, Sousa S, Seruca R, et al. Candidate driver genes in microsatellite-unstable colorectal cancer. Int J Cancer. 2012; 130: 1558-66. https://doi.org/10.1002/ijc.26167.
46. Callen DF, Ricciardelli C, Butler M, Stapleton A, Stahl J, Kench JG, Horsfall DJ, Tilley WD, Schulz R, Nesland JM, Neilsen PM, Kumar R, Holm R. Co-expression of the androgen receptor and the transcription factor ZNF652 is related to prostate cancer outcome. Oncol Rep. 2010; 23: 1045-52.
47. Kumar R, Manning J, Spendlove HE, Kremmidiotis G, McKirdy R, Lee J, Millband DN, Cheney KM, Stampfer MR, Dwivedi PP, Morris HA, Callen DF. ZNF652, a novel zinc finger protein, interacts with the putative breast tumor suppressor CBFA2T3 to repress transcription. Mol Cancer Res. 2006; 4: 655-65. https://doi.org/10.1158/1541-7786.MCR-05-0249.
48. Holm R, Knopp S, Kumar R, Lee J, Nesland JM, Trope C, Callen DF. Expression of ZNF652, a novel zinc finger protein, in vulvar carcinomas and its relation to prognosis. J Clin Pathol. 2008; 61: 59-63. https://doi.org/10.1136/jcp.2006.045864.
49. Zhou TB, Qin YH. Signaling pathways of prohibitin and its role in diseases. J Recept Signal Transduct Res. 2013; 33: 28-36. https://doi.org/10.3109/10799893.2012.752006.
50. Jupe ER, Badgett AA, Neas BR, Craft MA, Mitchell DS, Resta R, Mulvihill JJ, Aston CE, Thompson LF. Single nucleotide polymorphism in prohibitin 3' untranslated region and breast-cancer susceptibility. Lancet. 2001; 357: 1588-9.
51. Spurdle AB, Hopper JL, Chen X, McCredie MR, Giles GG, Newman B, Chenevix-Trench G. Prohibitin 3' untranslated region polymorphism and breast cancer risk in Australian women. Lancet. 2002; 360: 925-6. https://doi.org/10.1016/S0140-6736(02)11043-9.
52. Jakubowska A, Gronwald J, Gorski B, Huzarski T, Byrski T, Benner A, Lubinski J, Scott RJ, Hamann U. The 3' untranslated region C > T polymorphism of prohibitin is a breast cancer risk modifier in Polish women carrying a BRCA1 mutation. Breast Cancer Res Treat. 2007; 104: 67-74. https://doi.org/10.1007/s10549-006-9389-3.
53. Chen D, Chen F, Lu X, Yang X, Xu Z, Pan J, Huang Y, Lin H, Chi P. Identification of prohibitin as a potential biomarker for colorectal carcinoma based on proteomics technology. Int J Oncol. 2010; 37: 355-65.
54. Wu TF, Wu H, Wang YW, Chang TY, Chan SH, Lin YP, Liu HS, Chow NH. Prohibitin in the pathogenesis of transitional cell bladder cancer. Anticancer Res. 2007; 27: 895-900.
55. Kang X, Zhang L, Sun J, Ni Z, Ma Y, Chen X, Sheng X, Chen T. Prohibitin: a potential biomarker for tissue-based detection of gastric cancer. J Gastroenterol. 2008; 43: 618-25. https://doi.org/10.1007/s00535-008-2208-3.
56. Gamble SC, Odontiadis M, Waxman J, Westbrook JA, Dunn MJ, Wait R, Lam EW, Bevan CL. Androgens target prohibitin to regulate proliferation of prostate cancer cells. Oncogene. 2004; 23: 2996-3004. https://doi.org/10.1038/sj.onc.1207444.
57. Franzoni A, Dima M, D'Agostino M, Puppin C, Fabbro D, Loreto CD, Pandolfi M, Puxeddu E, Moretti S, Celano M, Bruno R, Filetti S, Russo D, et al. Prohibitin is overexpressed in papillary thyroid carcinomas bearing the BRAF(V600E) mutation. Thyroid. 2009; 19: 247-55. https://doi.org/10.1089/thy.2008.0235.
58. Abbott GW, Roepke TK. KCNE2 and gastric cancer: bench to bedside. Oncotarget. 2016; 7: 17286-7. https://doi.org/10.18632/oncotarget.7921.
59. Wang C, Saji M, Justiniano SE, Yusof AM, Zhang X, Yu L, Fernandez S, Wakely P Jr, La Perle K, Nakanishi H, Pohlman N, Ringel MD. RCAN1-4 is a thyroid cancer growth and metastasis suppressor. JCI Insight. 2017; 2: e90651. https://doi.org/10.1172/jci.insight.90651.
60. Magnusson PK, Almqvist C, Rahman I, Ganna A, Viktorin A, Walum H, Halldner L, Lundström S, Ullén F, Långström N, Larsson H, Nyman A, Gumpert CH, et al. The Swedish Twin Registry: establishment of a biobank and other recent developments. Twin Res Hum Genet. 2013; 16:317-29.
61. Purcell S, Neale B, Todd-Brown K, Thomas L, Ferreira MA, Bender D, Maller J, Sklar P, de Bakker PI, Daly MJ, Sham PC. PLINK: a tool set for whole-genome association and population-based linkage analyses. Am J Hum Genet. 2007; 81: 559-75.
62. DePristo MA, Banks E, Poplin R, Garimella KV, Maguire JR, Hartl C, Philippakis AA, del Angel G, Rivas MA, Hanna M, McKenna A, Fennell TJ, Kernytsky AM, et al. A framework for variation discovery and genotyping using next-generation DNA sequencing data. Nat Genet. 2011; 43: 491-8. https://doi.org/10.1038/ng.806.
63. Wang K, Li M, Hakonarson H. ANNOVAR: functional annotation of genetic variants from high-throughput sequencing data. Nucleic Acids Res. 2010; 38: e164. https://doi.org/10.1093/nar/gkq603.
64. Sherry ST, Ward MH, Kholodov M, Baker J, Phan L, Smigielski EM, Sirotkin K. dbSNP: the NCBI database of genetic variation. Nucleic Acids Res. 2001; 29: 308-11.
65. Abecasis GR, Auton A, Brooks LD, DePristo MA, Durbin RM, Handsaker RE, Kang HM, Marth GT, McVean GA; Genomes Project Consortium. An integrated map of genetic variation from 1,092 human genomes. Nature. 2012; 491: 56-65. https://doi.org/10.1038/nature11632.