
Introduction
Ranked as the fifth common type of cancer worldwide, hepatocellular carcinoma (HCC) ranks as the third cause of cancer-related deaths [1]. In particular, given the wide spread of hepatic virus, people in developing country are more susceptible to HCC [2]. HCC is characterized by its early invasion and diffuse metastases characteristics [3]. Depressingly, the lack of ideal biomarkers consistently leads to HCC diagnostic delay. For example, alpha-fetoprotein (AFP) assessment lacks adequate sensitivity and specificity for diagnosis [1, 4]. Thus, a majority of patients suffering from HCC are unable to obtain a definite diagnosis until advanced stage disease, making HCC one of the most frequent cancers worldwide [5]. Moreover, given its characteristics of toxicity and resistance to chemotherapy and radiotherapy, the prognosis of HCC remains poor to date [6-8]. The mortality rate of HCC is increasing despite significant progress in diagnosis and treatment obtained over the last few years. However, the 5-year survival rate of HCC is only 5% [9]. Therefore, the identification of a target gene strongly associated with HCC is of great value for HCC prevention and diagnosis.
As one of the members of the CDK family, CDK5 acts as an important regulator of cell division cycle and was first discovered and reported in 1992 [10, 11]. In addition to its role in brain tissues, CDK5 plays a key role in various types of cancer, including gastric cancer, prostate cancer, and lung cancer [12-15]. Recently, several publications also reported high CDK5 expression levels in hepatocellular carcinoma [15, 16]. As previously reported, CDK5 is highly expressed in HCC tissues and regulates the DNA damage response to influence its downstream cascade [15]. Herzog J et al. demonstrated that CDK5 promotes angiogenesis in hepatocellular carcinoma by its interaction with the transcription factor HIF-1α [16]. However, the sample size of the study was small. Only 157 HCC samples were included in the study by Ehrlich SM et al. More are needed to support the finding. Moreover, the relationship between CDK5 and the clinical variables of HCC remain unclear. Thus, using immunohistochemistry (IHC) in combination with high-throughput RNA-sequencing (RNA-seq) or microarray data from The Cancer Genome Atlas (TCGA), Gene Expression Omnibus (GEO), ArrayExpress and Oncomine databases, our study seeks to confirm the relationship among CDK5 expression levels and HCC development and progression. Subsequently, the role of CDK5 in cell cycle pathways was discovered using bioinformatics methods. Given that siRNA is widely used to interfere with gene expression, we used CDK5 siRNA to transfect HCC cells in vitro and assessed HCC cell proliferation and apoptosis.
Results
Differential CDK5 protein expression from our institution and from Protein Atlas detected by immunohistochemistry
An increasing tendency for CDK5 positive rates was observed from normal liver tissues (n=33), cirrhotic tissues (n=37), adjacent non-HCC liver tissues (n=171) to HCC tissues (n=171) (χ2=53.450, P<0.001) (Table 1, Figure 1, Figure 2). Additionally, the area under the curve (AUC) of receiver operator characteristic curves (ROC) was 0.678 (95% CI: 0.625-0.730, P<0.001) for CDK5 protein to diagnose HCC, which indicated a certain value for clinical diagnosis of HCC. HCC patients with metastasis (n=81), portal vein tumor (n=45), vascular invasion (n=52) and advanced TNM stage (n=123) exhibited prominently increased CDK5 expression (P<0.01) (Table 1). Moreover, remarkable overexpression of CDK5 protein was confirmed by the independent cases from Protein Atlas, which revealed the absence of CDK5 in normal livers and moderate-strong CDK5 staining in HCC (Figure 3).
Table 1: Relationship between CDK5 levels and clinicopathological variables in HCC from our institution
Variables |
n |
Expression of CDK5 (%) |
χ2 value |
P value |
||
Negative |
Positive |
|||||
Tissue types |
Normal liver |
33 |
23 (69.7) |
10 (30.3) |
53.450 |
<0.001 |
Cirrhosis |
37 |
23 (62.2) |
14 (37.8) |
|||
Adjacent non-cancerous liver |
171 |
96 (56.1) |
75 (43.9) |
|||
HCC |
171 |
40 (23.4) |
131 (76.6) |
|||
Gender |
Male |
153 |
35 (22.9) |
118 (77.1) |
0.216 |
0.768 |
Female |
18 |
5 (27.8) |
13 (72.2) |
|||
Differentiation |
High |
20 |
12 (60.0) |
8 (40.0) |
17.161 |
<0.001 |
Moderate |
98 |
17 (17.3) |
81 (82.7) |
|||
Low |
53 |
11 (20.8) |
42 (79.2) |
|||
Size |
<5 cm |
58 |
19 (32.8) |
39 (67.2) |
4.297 |
0.055 |
≥5 cm |
113 |
21 (18.6) |
92 (81.4) |
|||
Tumor nodes |
Single |
68 |
13 (19.1) |
55 (80.9) |
0.163 |
0.819 |
Multiple |
61 |
10 (16.4) |
51 (83.6) |
|||
Metastasis |
- |
90 |
38 (42.2) |
52 (57.8) |
37.595 |
<0.001 |
+ |
81 |
2 (2.5) |
79 (97.5) |
|||
Clinical TNM stage |
I-II |
48 |
22 (45.8) |
26 (54.2) |
18.754 |
<0.001 |
III-IV |
123 |
18 (14.6) |
105 (85.4) |
|||
Portal vein tumor embolus |
- |
84 |
21 (25.0) |
63 (75.0) |
8.451 |
0.003 |
+ |
45 |
2 (4.4) |
43 (95.6) |
|||
Vaso-invasion |
- |
77 |
20 (26.0) |
57 (74.0) |
8.649 |
0.004 |
+ |
52 |
3 (5.8) |
49 (94.2) |
|||
Tumor capsular infiltration |
With complete capsule |
61 |
12 (19.7) |
49 (80.3) |
0.268 |
0.650 |
Infiltration or no capsule |
68 |
11 (16.2) |
57 (83.8) |
|||
AFP |
- |
56 |
12 (21.4) |
44 (78.6) |
0.146 |
0.813 |
+ |
54 |
10 (18.5) |
44 (81.5) |
|||
Cirrhosis |
- |
74 |
13 (17.6) |
61 (82.4) |
2.469 |
0.145 |
+ |
97 |
27 (27.8) |
70 (72.2) |
|||
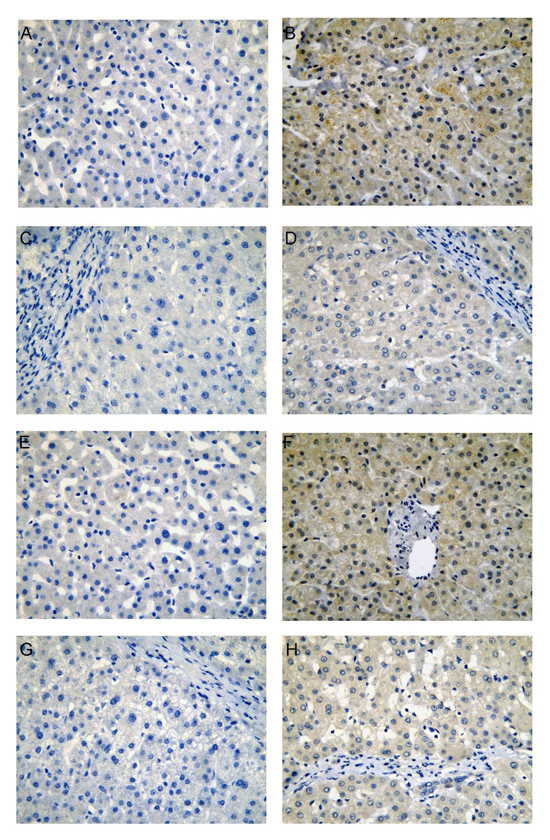
Figure 1: CDK5 protein expression in non-HCC liver tissues from our institution. Normal liver (A, negative; B, positive), cirrhotic liver (C, negative; D, positive), para-tumorous normal liver (E, negative; F, positive), para-tumorous cirrhotic liver (G, negative; H, positive), immunohistochemistry, ×400.
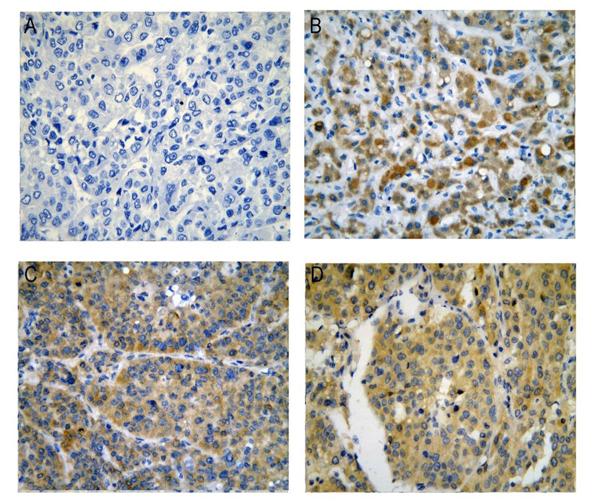
Figure 2: CDK5 protein expression in HCC tissues from our institution. (A) Negative; (B), (C), (D) Positive, immunohistochemistry, ×400.
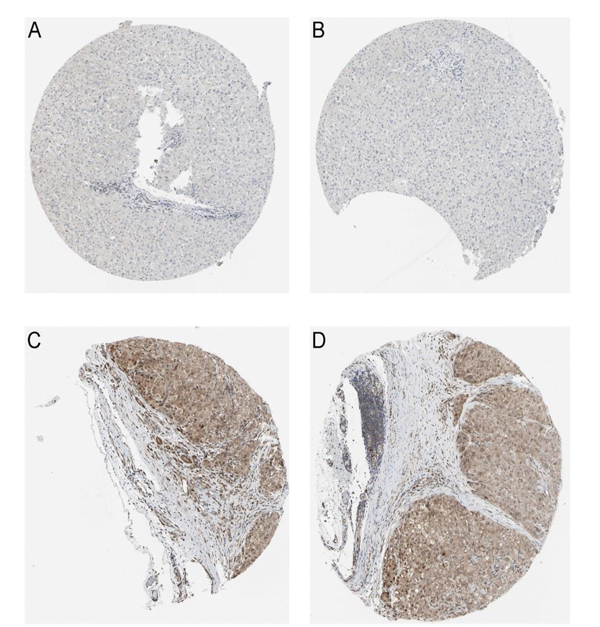
Figure 3: CDK5 protein in normal liver and HCC tissues from Protein Atlas. (A, B), Normal liver tissues stain negative for CDK5, immunohistochemistry, ×100; (C, D), HCC tissues stain positive for CDK5, immunohistochemistry, ×100.
Verification of CDK5 mRNA expression based on TCGA data
First, we observed the CDK5 expression pattern in 33 types of tumors based on TCGA data. CDK5 was significantly increased in 14 cancers, including liver HCC (Figure 4A). In total, 374 HCC patients and 50 patients without hepatic cancer from the TCGA database were included in this study. CDK5 expression levels were increased in HCC tissues compared with paired normal liver tissues (9.6443±0.7757 vs. 8.3711±0.4678, P<0.0001) (Figure 5A, Table 2). The ROC curve was performed to evaluate the significance of CDK5 expression in the diagnosis of HCC, and the area under curve (AUC) was 0.921 (Figure 5B). CDK5 expression increased in patients older than 60 years (n=201) compared with patients less than 60 years of age (n=169) (9.7650±0.7477 vs. 9.4965±0.7752, P<0.001), increased in males (n=250) compared with females (n=121) (9.7079±0.7568 vs. 9.5024±0.7833, P=0.016), increased in pathologic stages III-IV (n=90) compared with pathologic stages I-II (n=257) (9.8117±0.8200 vs. 9.5675±0.7513, P=0.010), and increased in T3-T4 stage (n=93) compared with T1-T2 stage (n=275) (9.8115±0.7956 vs. 9.5905±0.7491, P=0.016). Nevertheless, there are no significant differences between CDK5 expression level and other related pathological subgroups, such as race, relative family cancer history, tumor status, histological grade, N stage, M stage, and vascular tumor cell type (Table 2). We also generated plots to provide a visual representation of CDK5 expression in different pathological stages and histological grades (Figure 5C, Figure 5D).
Table 2: Relationship between CDK5 level and clinicopathological parameters in HCC based on TCGA data
Parameters |
n |
Mean value |
t value |
P value |
|
Tissues |
HCC |
374 |
9.6443±0.7757 |
16.457 |
<0.001 |
Normal |
50 |
8.3711±0.4678 |
|||
Age |
≥60 |
201 |
9.7650±0.7477 |
3.383 |
0.001 |
<60 |
169 |
9.4965±0.7752 |
|||
Gender |
Male |
250 |
9.7079±0.7568 |
2.424 |
0.016 |
Female |
121 |
9.5024±0.7833 |
|||
Race |
White |
184 |
9.7074±0.7072 |
1.921 |
0.056 |
Asian |
158 |
9.5428±0.8551 |
|||
Relative family cancer history |
Yes |
112 |
9.7301±0.7253 |
1.754 |
0.080 |
No |
208 |
9.5709±0.7993 |
|||
Tumor status |
With tumor |
151 |
9.6705±0.7830 |
0.859 |
0.391 |
Tumor free |
201 |
9.5985±0.7733 |
|||
Histological grade |
G3~G4 |
134 |
9.6562±0.7759 |
0.423 |
0.672 |
G1~G2 |
232 |
9.6208±0.7692 |
|||
Pathologic stage |
III~IV |
90 |
9.8117±0.8200 |
2.591 |
0.010 |
I~II |
257 |
9.5675±0.7513 |
|||
T stage |
T3-T4 |
93 |
9.8115±0.7956 |
2.42 |
0.016 |
T1-T2 |
275 |
9.5905±0.7491 |
|||
N stage |
N1-3 |
4 |
9.9694±1.0897 |
0.842 |
0.401 |
N0 |
252 |
9.6372±0.7787 |
|||
M stage |
M1 |
4 |
9.3233±0.2386 |
-0.807 |
0.420 |
M0 |
266 |
9.6451±0.7953 |
|||
Vascular tumor cell type |
Micro/Macro |
109 |
9.6338±0.7354 |
0.326 |
0.745 |
None |
205 |
9.6045±0.7681 |
|||
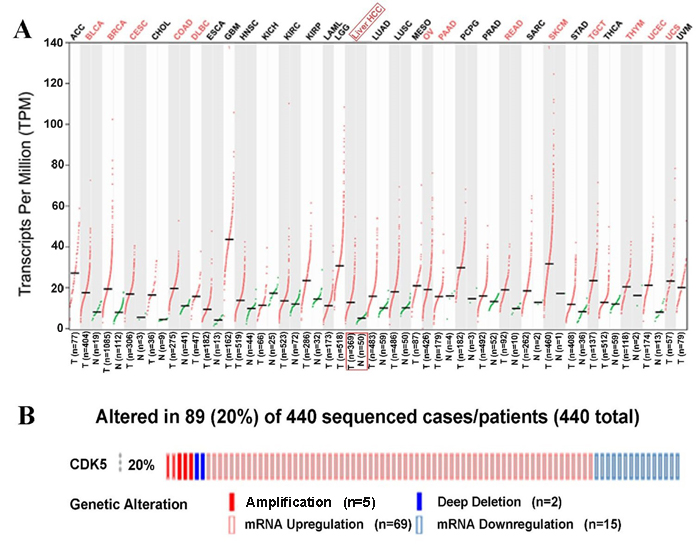
Figure 4: CDK5 expression pattern from The Cancer Genome Atlas and genetic alteration from cBioPortal. (A) Transcripts Per Million (TPM) data of CDK5 expression are presented based on Gene Expression Profiling Interactive Analysis (GEPIA). (B) Genetic alteration of CDK5 in 440 HCC patients from cBioPortal. CDK5 was altered in a total of 89 HCC patients. CDK5 amplificated in 5 patients and deep deleted in 2 patients. Meanwhile, CDK5 upregulated in 69 cases but downregulated in 15 cases.
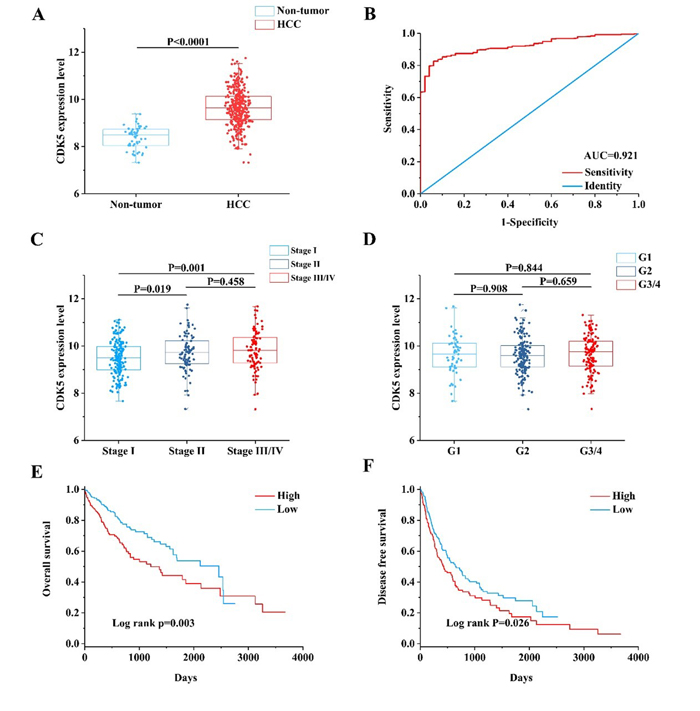
Figure 5: Clinical value of CDK5 in HCC based on TCGA data. (A) Scatter plot of CDK5 expression in HCC and cancer-free normal liver tissues. (B) Receiver operating characteristic (ROC) curve of CDK5 in HCC. (C) Scatter plot of CDK5 expression at different pathological stages. (D) Scatter plot of CDK5 expression at different histological grades. (E) Kaplan-Meier plots revealed an association between increased CDK5 levels and reduced overall survival. (F) Kaplan-Meier plots revealed an association between increased CDK5 levels and reduced disease-free survival.
Examination of the CDK5 expression pattern in HCC based on other open databases
We finally obtained 35 RNA-seq or microarray datasets, which provided CDK5 expression value in HCC tissues (n=1864) and adjacent non-tumor tissues (n=1995), from online databases (GEO, ArrayExpress and Oncomine databases). All included datasets are summarized in Table 3. CDK5 expression was significantly increased in HCC tissues (n=1630) compared with non-tumor tissues (n=1688) based on 26 of these datasets. In addition, CDK5 expression did not differ between HCC tissues (n=234) and non-tumor tissues (n=307) in the other 9 datasets. Scatter plots and ROC curve plots were drawn to visually represent the results (Figure 6, Figure 7). A comprehensive integrated approach was deemed to be more credible than single-dataset analysis. The pooled SMD reached 1.23 (95% CI: 1.00-1.45, P<0.001) by the random-effects model (Figure 8), certifying that CDK5 is overexpressed in HCC. Furthermore, the meta-analysis results for testing the diagnostic value of CDK5 revealed that the AUC of SROC was 0.88 (95% CI: 0.84-0.90) (Figure 9) Interestingly, as shown in Figure 4B, CDK5 also has a higher percentage (77.52%, n=69) in mRNA upregulation in genetic alteration from cBioPortal.
Table 3: Characteristics of datasets collected from public databases
First author (publication year) |
Country |
Dataset |
Platform |
Cancer |
Non-tumor |
||||
N |
Mean |
SD |
N |
Mean |
SD |
||||
| Hoshida Y et al. (2008) | USA | GEO: GSE10143 | Illumina GPL5474 |
80 | 11.56476 | 1.234071 | 307 | 9.681402 | 1.612077 |
| Yamada T et al. (2010) | Japan | GEO: GSE12941 | Affymetrix GPL5175 |
10 | 7.742833 | 0.451358 | 10 | 6.916281 | 0.289366 |
| Ozturk M et al. (2013) | Turkey | GEO: GSE17548 | Affymetrix GPL570 |
17 | 7.689396 | 0.534538 | 20 | 7.010264 | 0.419098 |
| Archer KJ et al. (2009) | USA | GEO: GSE17967 | Affymetrix GPL571 |
16 | 5.457902 | 0.224498 | 47 | 5.432252 | 0.335892 |
| Zhang HH et al. (2014) | USA | GEO: GSE22405 | Affymetrix GPL10553 |
24 | 6.385462 | 0.363429 | 24 | 6.316088 | 0.292544 |
| Zhang C et al. (2011) | USA | GEO: GSE25097 | Rosetta GPL10687 |
268 | 0.838214 | 0.378756 | 289 | 0.416037 | 0.122694 |
| Xing J et al. (2013) | China | GEO: GSE25599 | Illumina GPL9052 |
10 | 3.244943 | 0.671844 | 10 | 2.143752 | 0.319294 |
| Yang F et al. (2011) | China | GEO: GSE27462 | Arraystar GPL11269 |
5 | 7.140901 | 0.933327 | 5 | 6.30459 | 0.751626 |
| Lim HY et al.(2012) | South Korea | GEO: GSE36376 | Illumina GPL10558 |
240 | 7.574646 | 0.378203 | 193 | 7.045063 | 0.201359 |
| Kim J et al. (2014) | USA | GEO: GSE39791 | Illumina GPL10558 |
72 | 7.443333 | 0.361277 | 72 | 7.144306 | 0.235347 |
| Ueda T et al. (2013) | Japan | GEO: GSE44074 | Kanazawa GPL13536 |
33 | 1.27919 | 0.383991 | 70 | 1.182476 | 0.812676 |
| Wei L et al. (2013) | China | GEO: GSE45114 | CapitalBio GPL5918 |
24 | 1.325073 | 0.268345 | 25 | 0.967549 | 0.128934 |
| Jeng Y et al. (2013) | Taiwan | GEO: GSE46408 | Agilent GPL4133 |
6 | 9.579482 | 0.587683 | 6 | 8.377478 | 0.449755 |
| Chen X et al. (2014) | USA | GEO: GSE46444 | Illumina GPL13369 |
88 | 7.143259 | 1.327809 | 48 | 6.98491 | 1.454663 |
| Wang K et al. (2013) | China | GEO: GSE49713 | Arraystar GPL11269 |
5 | 7.124351 | 0.441245 | 5 | 5.535282 | 0.400369 |
| Geffers R et al. (2013) | Germany | GEO: GSE50579 | Agilent GPL14550 |
67 | 9.499062 | 0.624212 | 10 | 8.586041 | 0.373536 |
| Villa E et al. (2014) | Italy | GEO: GSE54236 | Agilent GPL6480 |
81 | 9.92021 | 0.665807 | 80 | 9.4993 | 0.546339 |
| Melis M et al. (2014) | USA | GEO: GSE55092 | Affymetrix GPL570 |
49 | 7.458387 | 0.616179 | 91 | 6.286526 | 0.60129 |
| Hoshida Y et al. (2014) | USA | GEO: GSE56140 | Illumina GPL18461 |
35 | 8.10847 | 0.32 | 34 | 7.678189 | 0.217079 |
| Mah W et al. (2014) | Singapore | GEO: GSE57957 | Illumina GPL10558 |
39 | 8.869112 | 0.369617 | 39 | 8.37716 | 0.257911 |
| Udali S et al. (2015) | Italy | GEO: GSE59259 | NimbleGen GPL18451 |
8 | 13.22883 | 0.281264 | 8 | 12.55599 | 0.279291 |
| Kao KJ et al. (2015) | Taiwan | GEO: GSE60502 | Affymetrix GPL96 |
18 | 7.425576 | 1.055023 | 18 | 5.531417 | 0.995259 |
| Zucman-Rossi J et al. (2014) | France | GEO: GSE62232 | Affymetrix GPL570 |
81 | 7.008307 | 0.476591 | 10 | 6.227086 | 0.257979 |
| Sorenson EC et al. (2017) | USA | GEO: GSE63018 | Illumina GPL16791 |
10 | 11.29778 | 0.353735 | 9 | 11.33185 | 0.316222 |
| Makowska Z et al. (2016) | Switzerland | GEO: GSE64041 | Affymetrix GPL6244 |
60 | 8.627706 | 0.445288 | 65 | 8.042826 | 0.255531 |
| Tao Y et al. (2015) | China | GEO: GSE74656 | Affymetrix GPL16043 |
5 | 6.26234 | 0.491062 | 5 | 5.410328 | 0.223788 |
| Grinchuk OV et al. (2017) | Singapore | GEO: GSE76427 | Illumina GPL10558 |
115 | 8.325151 | 0.398464 | 52 | 7.843747 | 0.317144 |
| Jin G et al. (2017) | China | GEO: GSE77509 | Illumina GPL16791 |
20 | 9.487431 | 0.532998 | 20 | 8.588088 | 0.320587 |
| Wijetunga NA et al. (2016) | USA | GEO: GSE82177 | Illumina GPL11154 |
5 | 1.467352 | 0.301874 | 12 | 1.933381 | 0.931835 |
| Tu X et al. (2017) | China | GEO: GSE84005 | Affymetrix GPL5175 |
38 | 7.528008 | 0.610855 | 38 | 6.635592 | 0.355587 |
| Wurmbach E et al. (2007) | USA | Oncomine: Wurmbach Liver |
Affymetrix GPL570 |
35 | 5.919037 | 0.545655 | 40 | 5.059372 | 0.269329 |
| Mas VR et al. (2009) | USA | Oncomine: Mas Liver |
Affymetrix GPL571 |
38 | 5.842322 | 0.548437 | 77 | 5.777008 | 0.347634 |
| Roessler S et al.1 (2010) | USA | Oncomine: Roessler liver 1 |
Affymetrix GPL571 |
22 | 5.611227 | 0.566651 | 21 | 4.954476 | 0.287342 |
| Roessler S et al.2 (2010) | USA | Oncomine: Roessler liver 2 |
Affymetrix GPL3921 |
225 | 5.4402 | 0.703646 | 220 | 4.819882 | 0.365017 |
| Nojima M et al. (2017) | Japan | Arrayexpress: E-MTAB-4171 |
Agilent A-MEXP-2320 |
15 | 5.237674 | 1.130954 | 15 | 6.042401 | 1.132882 |
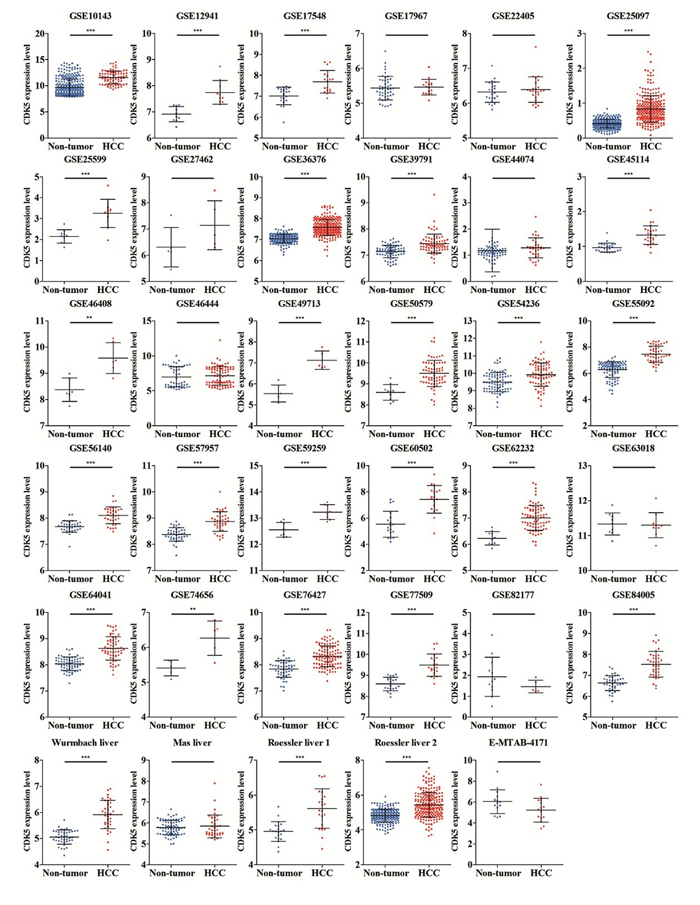
Figure 6: Different levels of CDK5 expression in HCC and non-tumor gastric tissues based on 35 datasets.
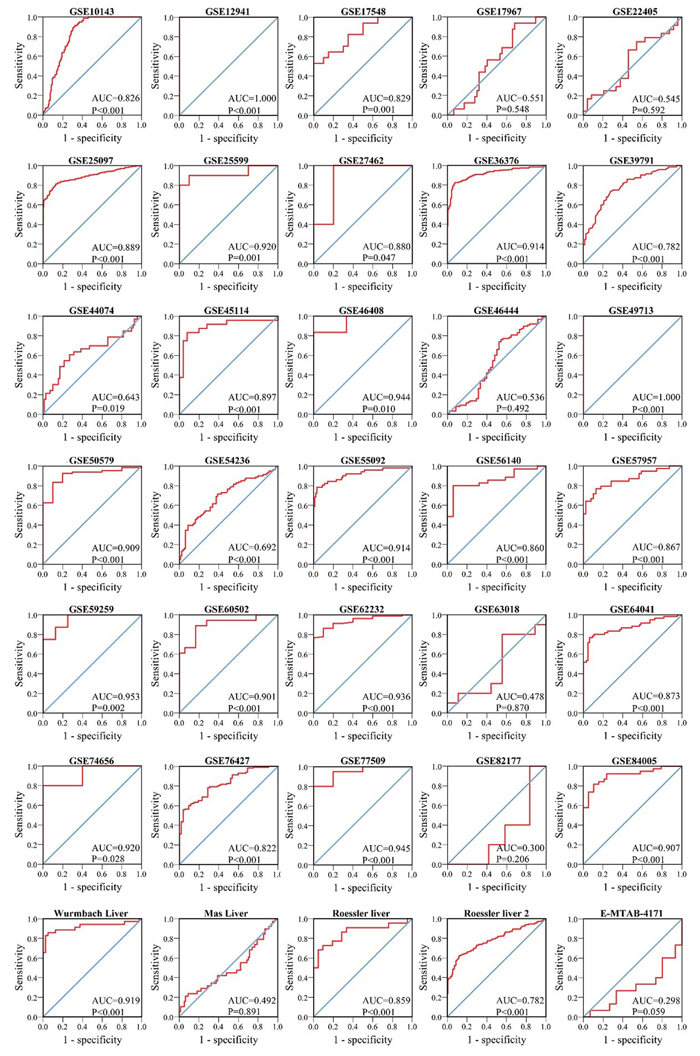
Figure 7: ROC curves of CDK5 expression for the differentiation of HCC from non-tumor tissues based on 35 datasets.
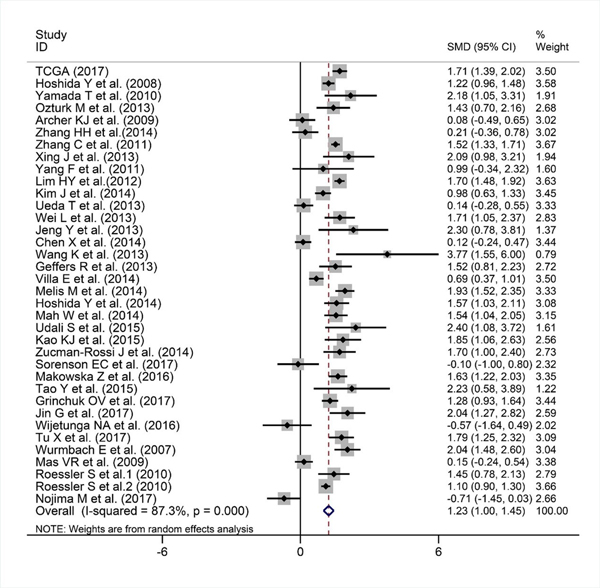
Figure 8: Forest plot evaluating CDK5 expression between HCC and non-tumor tissues. When SMD > 0 and its 95% CI do not cross, 0 indicates increased CDK5 expression in HCC compared with noncancerous samples.
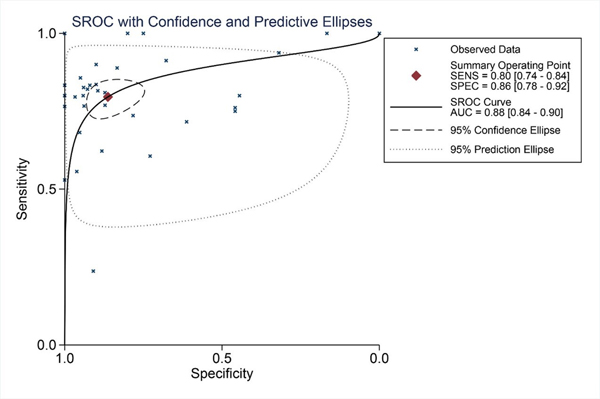
Figure 9: SROC curves for the differentiation of HCC patients from non-tumor tissues based on CDK5 expression.
Impact of CDK5 expression on survival outcomes in hepatic cancer
Kaplan-Meier plots were adopted to analyze the survival differences between low and high CDK5 expression levels with the cutoff value defined by the median CDK5 expression level (Figure 5E, Figure 5F). The plots indicated that the HCC patients with a high expression of CDK5 had an inferior overall survival (OS; HR=1.697, 95% CI: 1.195-2.410, P=0.003) and disease-free survival (DFS; HR=1.351, 95% CI: 1.036-1.763, P=0.026) than those patients with a downregulated expression of CDK5.
Bioinformatic analysis suggests that CDK5 is associated with the proliferative signaling pathway
After the calculation described above, 4824 differently expressed genes (DEGs) were obtained when considering a stringent threshold of |log2FC|>1 and Padj<0.05 (Figure 10A). Then, the Weighted Gene Co-Expression Network Analysis (WGCNA) integrated function was used to calculate a set of genes related to CDK5. As shown in Figure 10B, the visualized heatmap indicated that 542 genes clustered in turquoise were most significant correlated with CDK5 and several clinicopathological parameters. To further investigate the functional associations of CDK5-related genes, we performed GO and KEGG pathway annotation analysis and displayed the top 10 pathways of Oncology (GO) and the Kyoto Encyclopedia of Genes and Genomes (KEGG) in Table 4. As shown in Figure 11, the majority of the CDK5-relevant genes were significantly represented by the GO biological categories of “cell division”, “DNA replication” and “mitotic nuclear division”. Regarding the cellular component, “nucleoplasm”, “nucleus” and “chromosome, centromeric region” represent the three most significantly enriched terms. Regarding molecular function, the genes were markedly represented by “protein binding”, “DNA binding” and “ATP binding”. KEGG pathway analysis revealed that “Cell cycle” was the most significant pathway related with CDK5-related genes (Figure 12).
Table 4: Top 10 significant pathways of GO and KEGG terms
Category |
ID |
Term |
Counts |
Genes |
P-Value |
Biological process |
GO:0051301 |
cell division |
77 |
KIFC1, STOX1, BORA, KNTC1, CUZD1, AURKA, PTTG1, FAM83D, CCNE2, KIF2C etc. |
8.38E-46 |
Biological process |
GO:0006260 |
DNA replication |
48 |
CLSPN, BLM, TICRR, KIAA0101, CHEK1, POLA2, MCM10, CDT1, CDC45, MCM8 etc. |
1.30E-35 |
Biological process |
GO:0007067 |
mitotic nuclear division |
53 |
STOX1, BORA, KNTC1, PKMYT1, AURKA, AURKB, PTTG1, FAM83D, KIF2C, OIP5 etc. |
1.33E-30 |
Biological process |
GO:0007062 |
sister chromatid cohesion |
36 |
KNTC1, AURKB, SPC24, SPC25, KIF2C, CDCA8, DDX11, CENPA, INCENP, BUB1 etc. |
1.08E-28 |
Biological process |
GO:0000082 |
G1/S transition of mitotic cell |
31 |
IQGAP3, PKMYT1, POLA2, MCM10, CDT1, CCNE2, PRIM1, CCNE1, TYMS, CDC45 etc. |
1.14E-22 |
Biological process |
GO:0006270 |
DNA replication initiation |
19 |
CDC7, CDC6, GINS4, POLA2, MCM2, MCM10, MCM3, MCM4, MCM5, MCM6 etc. |
3.02E-20 |
Biological process |
GO:0006281 |
DNA repair |
39 |
CLSPN, XRCC3, XRCC2, BLM, TICRR, FOXM1, FAAP24, CHEK1, PTTG1, ANKLE1 etc. |
1.66E-18 |
Biological process |
GO:0000086 |
G2/M transition of mitotic cell |
29 |
CEP72, HAUS5, NEK2, FOXM1, BORA, PKMYT1, CHEK1, AURKA, CHEK2, HMMR etc. |
1.13E-16 |
Biological process |
GO:0000070 |
mitotic sister chromatid segreg |
14 |
KIFC1, NEK2, DSN1, NUSAP1, KIF18B, ESPL1, NDC80, KNSTRN, SMC4, MAD2L1 etc. |
2.34E-14 |
Biological process |
GO:0007059 |
chromosome segregation |
19 |
KIF11, NEK2, DSN1, NUF2, CENPF, NDC80, CENPE, KNSTRN, ESCO2, SPC25 etc. |
3.26E-13 |
Cellular component |
GO:0005654 |
nucleoplasm |
187 |
XRCC3, DBF4B, XRCC2, PRC1, NR2C2AP, PKMYT1, CBX2, AURKA, AURKB, MCM10 etc. |
7.93E-34 |
Cellular component |
GO:0005634 |
nucleus |
259 |
KIFC1, XRCC3, DBF4B, RUSC1, PRR11, AURKA, AURKB, PTTG1, ANKLE1, MAMSTR etc. |
7.57E-25 |
Cellular component |
GO:0000775 |
chromosome, centromeric region |
21 |
DNMT3A, CENPL, MKI67, CENPQ, CENPP, NUF2, CENPF, NDC80, BIRC5, CENPE etc. |
2.11E-17 |
Cellular component |
GO:0005813 |
centrosome |
49 |
KIF23, STIL, CEP72, STOX1, HAUS5, XRCC2, NEK2, AURKA, CHEK1, CEP55 etc. |
8.62E-17 |
Cellular component |
GO:0000777 |
condensed chromosome kinetochor |
24 |
CENPO, CENPM, NEK2, NUF2, KNTC1, BIRC5, NDC80, CENPE, KNSTRN, CENPK etc. |
1.02E-16 |
Cellular component |
GO:0000922 |
spindle pole |
25 |
PRC1, NEK2, KNTC1, FBF1, DDX11, GPSM2, CKAP2, CDC6, KIF11, DSN1 etc. |
2.20E-15 |
Cellular component |
GO:0030496 |
midbody |
26 |
KIF23, KIF4A, PRC1, NEK2, AURKA, AURKB, CEP55, CDCA8, DDX11, INCENP etc. |
1.33E-14 |
Cellular component |
GO:0005819 |
spindle |
25 |
KIF23, KIFC1, HAUS5, PRC1, TTK, AURKA, AURKB, ATAT1, SAC3D1, INCENP etc. |
2.63E-14 |
Cellular component |
GO:0000776 |
kinetochore |
21 |
NEK2, KIF18A, TTK, CENPF, NDC80, CENPE, AURKB, KNSTRN, CENPI, CENPH etc. |
4.64E-14 |
Cellular component |
GO:0042555 |
MCM complex |
8 |
MCM7, MMS22L, TONSL, MCM2, MCM3, MCM4, MCM5, MCM6 |
4.08E-10 |
Molecular function |
GO:0005515 |
protein binding |
335 |
XRCC3, XRCC2, DBF4B, RUSC1, ADCY6, NR2C2AP, AURKA, AURKB, PTTG1, ANKLE1 etc. |
6.94E-18 |
Molecular function |
GO:0003677 |
DNA binding |
103 |
XRCC3, CBX2, CDKN2A, DDX11, ZNF300, WDR76, PRIM2, TIGD3, ORC6, H2AFX etc. |
1.33E-14 |
Molecular function |
GO:0005524 |
ATP binding |
94 |
KIF23, KIFC1, XRCC3, KIF24, XRCC2, FIGNL1, ADCY6, DTYMK, TTLL4, PKMYT1 etc. |
7.80E-14 |
Molecular function |
GO:0003697 |
single-stranded DNA binding |
18 |
XRCC3, HMGB2, XRCC2, RAD51AP1, BLM, MSH2, NEIL3, BRCA2, MCM10, MCM4 etc. |
6.70E-10 |
Molecular function |
GO:0003682 |
chromatin binding |
36 |
TICRR, EZH2, KIAA0101, FAAP24, CBX2, ZKSCAN3, CDC45, DDX11, CENPA, POLQ etc. |
1.23E-09 |
Molecular function |
GO:0019901 |
protein kinase binding |
35 |
E2F1, CKS1B, TRAF2, CDK5R1, DBF4B, PRC1, FOXM1, BORA, ADCY6, AURKA etc. |
1.65E-09 |
Molecular function |
GO:0008017 |
microtubule binding |
25 |
GAS2L3, KIF14, KIF23, KIFC1, ARHGEF2, KIF4A, KIF24, KIF11, PRC1, KIF15 etc. |
4.03E-09 |
Molecular function |
GO:0043142 |
single-stranded DNA-dependent A |
7 |
DNA2, RFC3, RFC4, CHTF18, POLQ, RAD51, DSCC1 |
8.62E-08 |
Molecular function |
GO:0003678 |
DNA helicase activity |
9 |
DNA2, MCM7, PIF1, RAD54B, MCM2, MCM3, MCM4, MCM5, MCM6 |
1.69E-07 |
Molecular function |
GO:0003777 |
microtubule motor activity |
13 |
KIF14, KIF23, KIFC1, KIF4A, KIF24, KIF11, KIF15, KIF18A, KIF18B, CENPE etc. |
2.04E-06 |
KEGG_PATHWAY |
hsa04110 |
Cell cycle |
39 |
E2F1, E2F2, PKMYT1, TTK, CHEK1, PTTG1, CHEK2, CCNE2, CCNE1, CDC45 etc. |
2.82E-30 |
KEGG_PATHWAY |
hsa03030 |
DNA replication |
18 |
LIG1, POLA2, MCM2, RNASEH2A, MCM3, MCM4, MCM5, MCM6, PRIM1, DNA2 etc. |
8.95E-17 |
KEGG_PATHWAY |
hsa03460 |
Fanconi anemia pathway |
15 |
BLM, EME1, FAAP24, BRCA2, BRIP1, RMI2, RAD51, FANCI, FANCD2, FANCE etc. |
1.00E-09 |
KEGG_PATHWAY |
hsa03440 |
Homologous recombination |
9 |
XRCC3, XRCC2, BLM, POLD1, EME1, BRCA2, RAD54B, RAD54L, RAD51 |
1.34E-05 |
KEGG_PATHWAY |
hsa04114 |
Oocyte meiosis |
15 |
CDK1, ADCY6, PKMYT1, CDC20, ESPL1, AURKA, PTTG1, CDC25C, CCNE2, CCNE1 etc. |
1.22E-05 |
KEGG_PATHWAY |
hsa04115 |
p53 signaling pathway |
11 |
CCNB1, CCNE2, CCNE1, CDK1, CDKN2A, CCNB2, RRM2, CHEK1, CHEK2, GTSE1 etc. |
1.30E-04 |
KEGG_PATHWAY |
hsa04914 |
Progesterone-mediated oocyte maturation |
12 |
CCNB1, CDK1, MAD2L1, CCNB2, PLK1, ADCY6, BUB1, PKMYT1, CDC25C, CCNA2 etc. |
1.94E-04 |
KEGG_PATHWAY |
hsa03430 |
Mismatch repair |
7 |
EXO1, RFC3, RFC4, MSH2, LIG1, POLD1, PCNA |
3.13E-04 |
KEGG_PATHWAY |
hsa05166 |
HTLV-I infection |
18 |
DVL2, E2F1, E2F2, ADCY6, CHEK1, CDC20, PTTG1, MYBL1, CHEK2, MYBL2 etc. |
0.003175 |
KEGG_PATHWAY |
hsa00240 |
Pyrimidine metabolism |
11 |
PRIM1, TYMS, POLE2, POLD1, RRM2, DTYMK, PRIM2, CAD, UCK2, POLA2 etc. |
0.003769 |
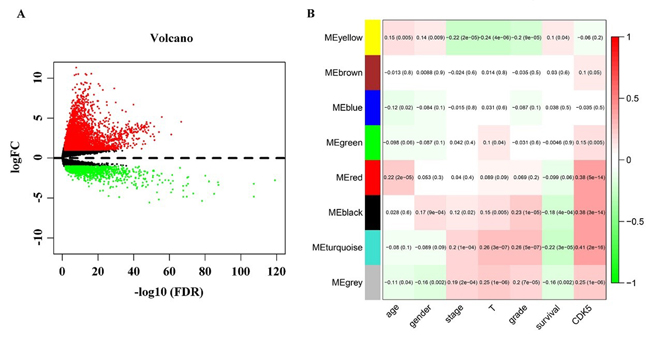
Figure 10: Identification of CDK5-related genes. (A) Volcano plot of the differentially expressed genes between liver HCC and normal liver tissues. Red indicates high expression, whereas green represents low expression. This volcano plot was generated using the ggplot2 package of R language. (B) Network analysis of differently expressed genes identifies a module of genes co-expressed with CDK5. Each row corresponds to a module eigengene, and each column corresponds to a clinicopathological parameter. Each block contains the corresponding correlation coefficient and P value. The heatmap was drawn using the WGCNA package of R language.
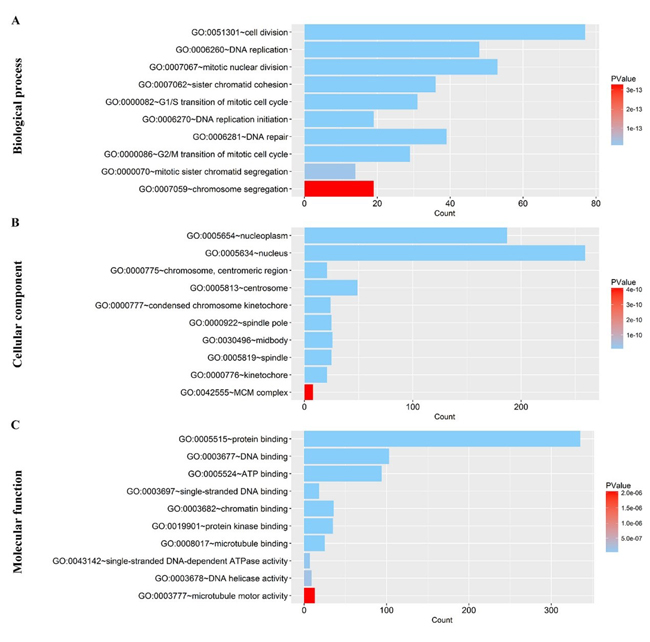
Figure 11: Gene Ontology analysis of the CDK5-related genes in HCC. (A) Biological process; (B) Cellular component; (C) Molecular function. The plot was generated using the ggplot2 package of R language.
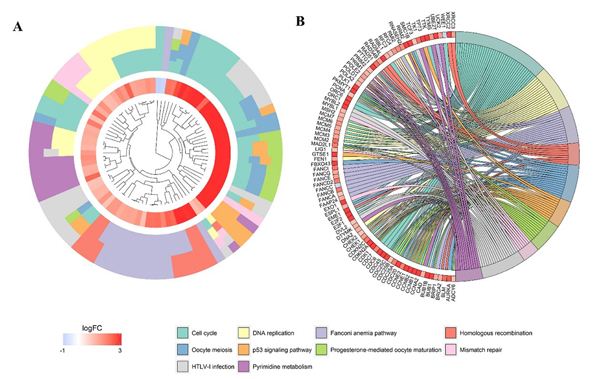
Figure 12: Significantly enriched annotation of the Kyoto Encyclopedia of Genes and Genomes (KEGG) pathway analysis of CDK5-related genes in HCC. (A) Cluster plot displays a circular dendrogram of the clustering of the expression profiles. The inner ring displays the color-coded logFC, whereas the outer ring indicates the assigned functional KEGG pathways. (B) In the Chord plot, related genes are linked to their enriched KEGG pathways via ribbons. Red coding next to the selected genes indicated up-regulation and blue ones indicated down-regulation.
CDK5-siRNA inhibited cell growth and induced apoptosis in vitro
A colorimetric MTS tetrazolium assay was performed to detect HepG2 and HepB3 cell growth. A reduction in cell proliferation in the CDK5-siRNA group was noted compared with the mock control in both cell lines (P=0.001) (Figure 13A, Figure 14A). HepG2 cell growth was reduced by 20% and 40% at 5 days and 10 days after transfection, respectively, whereas the reduction of HepB3 cell growth even reached 25% and 50% at 5 days and 10 days after transfection, respectively. Moreover, fluorimetric resorufin viability assay and Hoe/PI results largely mirrored the MTS tetrazolium assay results (Figure 13B, Figure 14C). A fluorescent caspase-3/7 assay was adopted in this study, revealing an increase in the caspase-3/7 signal in both HepG2 and HepB3 cells transfected with CDK5-siRNA. Caspase-3/7 activity in the CDK5-siRNA group in both HepG2 and HepB3 cells was approximately 2.5-fold increased compared with control and scrambled siRNA control 10 days after transfection (Figure 13D, Figure 14D). To confirm the results, Hoe/PI assays were performed to measure cell apoptosis based on microscopic counting of apoptotic cells. The results were similar to the fluorescent caspase-3/7 assay results, demonstrating that apoptosis activity in the CDK5-siRNA group was approximately two-fold increased compared with the mock control and scrambled siRNA control in both HepG2 and HepB3 cells (Figure 13E, Figure 14E, Figure 15).
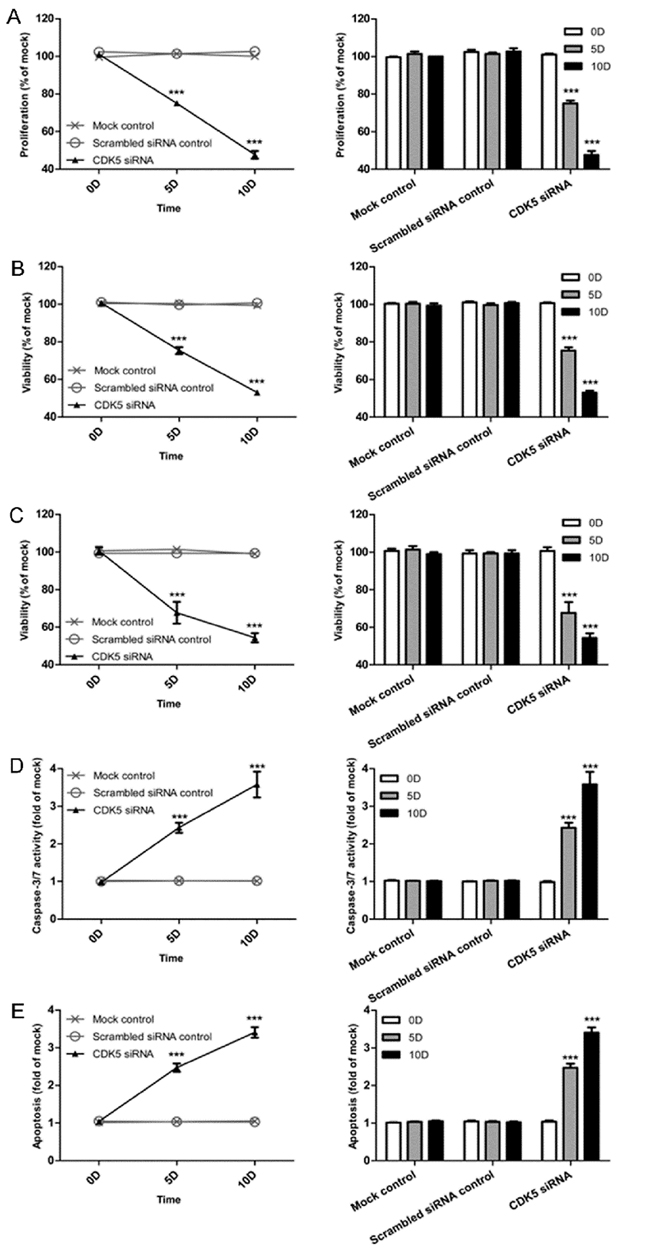
Figure 13: Effects of CDK5-specific-siRNA on cell growth and apoptosis in HCC HepB3 cells. (A) Cell proliferation detected using an MTS assay. (B) Cell viability assessed with a fluorimetric assay. (C) Cell viability assessed with Hoechst33342 and PI double fluorescent staining. (D) Caspase-3/7 activity. (E) Cell apoptosis detected by Hoechst33342 and PI double fluorescent assay. (** P<0.01 and *** P<0.001 compared with mock control).
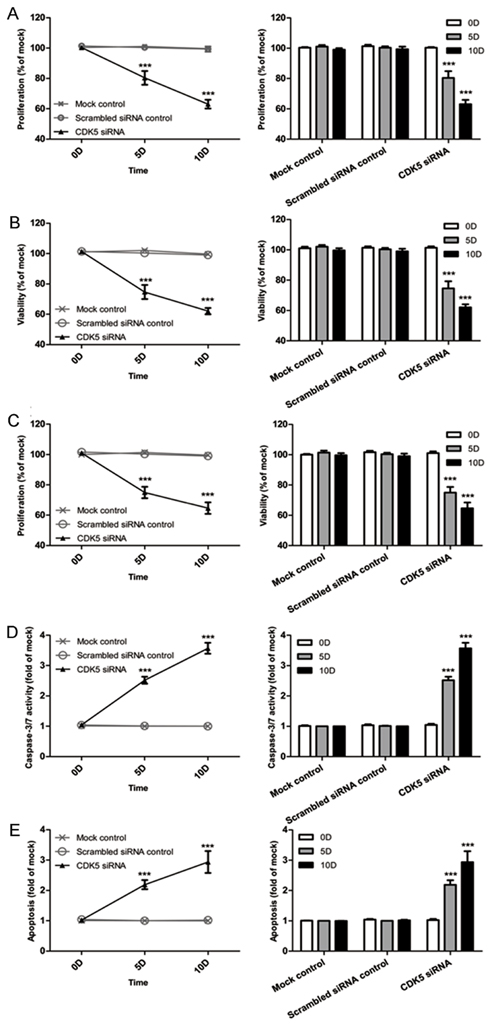
Figure 14: Effects of CDK5-specific-siRNA on cell growth and apoptosis in HCC HepG2 cells. (A) Cell proliferation detected using an MTS assay. (B) Cell viability assessed with a fluorimetric assay. (C) Cell viability assessed with Hoechst33342 and PI double fluorescent staining. (D) Caspase-3/7 activity. (E) Cell apoptosis detected by Hoechst33342 and PI double fluorescent assay. (** P<0.01 and *** P<0.001 compared with mock control).
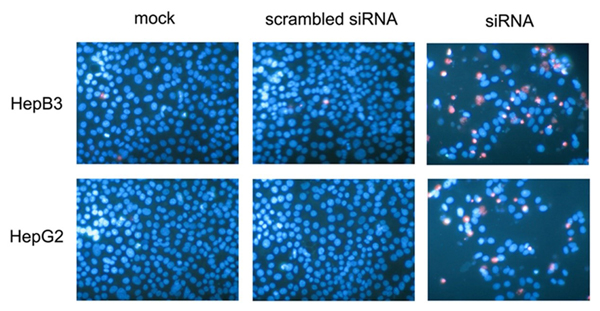
Figure 15: Effects of CDK5-specific-siRNA detected by Hoechst33342 and PI double fluorescent staining. HepB3 and HepG2 cell lines were treated with CDK5-specific-siRNA. Live cells and apoptotic cells were detected with Hoechst33342 and PI double fluorescent staining on the 10th day.
Discussion
The estimated worldwide incidence of liver cancer is 626,000 cases a year. Greater than 50% of cases are from China. Approximately 745,000 people die from HCC yearly worldwide [20, 21]. HCC represents a large portion of primary liver cancer [22]. However, diagnostic methods are limited to date. In addition, HCC progression is associated with various factors, such as alcoholic cirrhosis, hepatitis virus infection, and non-alcoholic steatohepatitis (NASH) [21, 23]. However, cancer genes, including CDK5 and STAT3, represent the most influential factors [24]. Previous studies revealed that CDK5 activity is induced by non-cyclin proteins, including Cdk5R1 (p35) and Cdk5R2 (p39), but CDK5 does not interact with cyclins directly [25]. In addition, CDK5 was mainly investigated as an important regulatory gene in the central nervous system (CNS) and as a potential cause of Alzheimer’s disease (AD) [26]. Recent research revealed that P35 degradation occurs by both ubiquitin-dependent and ubiquitin-independent pathways. P35 degradation leads to the inhibition of P25 expression, which could over-activate CDK5 to induce neuronal cell death [27]. Various experiments demonstrated the significant role of CDK5 in the CNS by broadly disrupting in neuronal layering of various brain structures, such as the cerebral cortex, cerebellum, hippocampus and olfactory bulb [28]. Thus, in our study, we paid more attention to investigating the relationship between CDK5 and clinicopathological parameters, as well as the diagnostic and prognostic value of CDK5. Here, we collected 412 samples (HCC, n=171; adjacent non-HCC liver tissues, n=171; normal liver tissues, n=33; cirrhotic tissues, n=37) from surgically resected samples. Meanwhile, a total of 2238 HCC tissues and 2045 non-cancerous tissues were deeply mined and integrated from various public datasets. Thus, based on large-scale sample size, the results of CDK5 significantly overexpressed in HCC patients would be more reliable and valuable. Furthermore, our in vitro study found that CDK5 could inhibit cell growth and induce apoptosis in HCC cell lines, which might be the mechanism by which CDK5 critically impacted the initiation and development of HCC.
Our study first demonstrated a significant value of CDK5 in the clinical diagnosis of HCC. CDK5 expression is up-regulated in HCC compared with normal tissues based on immunohistochemistry performed in our study. A similar pattern was revealed by the high-throughput RNA-seq analysis. Therefore, CDK5 over-expression is likely associated with the occurrence of HCC, and further studies should be performed regarding the role of CDK5 expression in HCC diagnosis and individualized treatment. Moreover, compared with cirrhotic and para-carcinoma tissues in the liver, CDK5 expression was increased in HCC (P<0.001). However, CDK5 expression exhibited no significant differences between cirrhotic and normal tissues in the liver based on immunohistochemistry, indicating that CDK5 is specifically over-expressed in HCC and providing a new marker to distinguish HCC from other hepatic diseases, such as cirrhosis, thus improving the diagnosis accuracy of HCC. Furthermore, from the meta-analysis results of TCGA and other open databases, CDK5 expression in HCC was significantly increased compared with non-HCC liver cancer. Furthermore, ROC analysis was performed in our immunohistochemistry study and revealed that the CDK5 expression level was most useful in the diagnosis of tumor metastasis followed by tissue types, TNM stage, size, embolus and vaso-invasion. These results provide effective target molecules for an accurate diagnosis of HCC compared with other tissue types and to predict HCC progression. Similarly, ROC analysis results of data from the TCGA database confirmed that CDK5 could play an effective role in distinguishing HCC from normal tissues.
In addition, CDK5 may be an effective biomarker for HCC staging. Our immunohistochemistry results revealed increased CDK5 expression levels in HCC patients with tumor metastasis, vascular invasion, portal vein tumor embolus, moderate differentiation and higher clinical TNM stages. Greater than 97.5% of HCC patients with metastasis exhibited increased CDK5 expression. Therefore, we can easily infer that increased CDK5 expression levels are related to more advanced stages of HCC. These results suggest that the CDK5 expression level detection may represent a good choice to distinguish the stage of HCC. Based on the analysis of data extracted from the TCGA database, CDK5 expression correlated with patient age. Nevertheless, no significant correlation was noted between CDK5 and other clinical parameters, such as pathologic stage, and HCC histological grade and race, revealing a different trend compared with our immunohistochemistry results. All our immunohistochemistry samples were obtained from Chinese individuals, whereas cases from the TCGA database were obtained from various populations worldwide. This difference may explain the different results obtained from our immunohistochemistry analysis and the high-through RNA-seq analysis.
However, whether CDK5 represents a suitable biomarker for the prediction of HCC prognosis remains controversial. The survival analysis based on the TCGA database revealed that the CDK5 expression levels were significantly related to both overall survival (OS) and disease-free survival (DFS). Thus, CDK5 may effectively predict HCC prognosis. However, our RNA-seq results demonstrated that CDK5 could act as a statistically effective HCC prognostic biomarker. Given that the algorithm used in these methods differed, the clinic value of CDK5 in HCC prognosis requires further investigation. In addition to its clinical value, the mechanism by which CDK5 regulates the initiation and development of HCC requires further study.
Based on bioinformatics methods, we hypothesize that CDK5 exercises its functions via several proliferative signaling pathways. We confirmed our hypothesis in a series of in vitro experiments. In our in vitro experiment, cell proliferation was inhibited in the CDK5-siRNA group, suggesting that CDK5 promotes cell proliferation and subsequently triggers HCC progression. In addition, HCC cell apoptosis increased when CDK5 expression was suppressed, indicating that CDK5 down-regulation induces the low apoptosis rates. Of note, three different methods were adopted to detect the proliferation of both HCC cell lines in our in vitro study, revealing the same trend of cell proliferation. In addition, two different methods were performed to measure apoptosis in both HCC cell lines, revealing a similar trend in cell apoptosis. Thus, the results of our in vitro experiment are reliable. Similarly, Liu JL. Et al.’s study on CDK5 and lung cancer revealed a similar CDK5 proliferation and apoptosis trend in lung cancer cell lines when CDK5 activity was suppressed by siRNA [29]. A paradoxical mechanism of CDK5 in HCC was previously reported. Most recently, CDK5 was reported to promote angiogenesis in HCC [16]. As demonstrated by previous CDK5 studies, CDK5 interacts with numerous types of proteins, such as β-catenin, GFAP, and α-actinin [30]. CDK5 activity is dependent on p35/p39 binding. CDK5 and p35 were recently identified as a potent tumor suppressor in HCC. The decreased expression of p39 correlated with a poor overall survival rate [31]. Regulation of CDK5 activity promoted the proliferation of medullary thyroid carcinoma (MTC) [32]. In other studies, CDK5 promoted medullary thyroid carcinoma cell growth by regulating STAT3 activation and cell proliferation [24]. Feldmann et.al concluded that inhibiting CDK5 could suppress Ras-Ral signaling, blocking pancreatic cancer formation and progression [33]. In addition, emerging evidence indicates that CDK5 functions in prostate cancer cells through the control of cell-motility and metastatic potential [34]. Sustaining proliferative signaling has been recognized as a fundamental hallmark of cancers. Cell growth disturbances implicated in the regulation of the progression and migration of cancer cell arguably [35]. Based on bioinformatics methods, we found that co-expressed genes of CDK5 enriched in several pro-proliferative pathways, such as cell cycle and DNA replication. Therefore, we hypothesize that CDK5 exercises its functions in tumorigenesis and progression via disturbing cell growth and apoptosis. Taken together, these findings indicated that CDK5 is involved in numerous steps during cancer progression.
In summary, CDK5 plays an essential role in HCC initiation and progression, most likely via accelerating proliferation and suppressing apoptosis in HCC cells.
Materials and Methods
Immunohistochemical technique
In the present study, 412 surgically resected tissue samples were obtained from the First Affiliated Hospital of Guangxi Medical University (Nanning, Guangxi, China). The 412 tissues included 33 normal liver tissues, 37 cirrhosis tissues, 171 adjacent non-HCC liver tissues and 171 primary HCC tissues. HCC was diagnosed according to WHO classification of tumors of the digestive system (http://www.who.int/en/). The age of all the patients ranged from 28 to 76 years (mean, 51 years). All clinicopathological information was obtained from medical records and summarized in Table 1. The protocol of our study was approved by the Ethical Committee of the First Affiliated Hospital of Guangxi Medical University. Patients and clinicians provided written informed consent permitting the use the samples. All the samples were diagnosed and reviewed by two independent pathologists.
Immunohistochemistry was applied to measure the CDK5 expression level of the samples. Regarding quantification of CDK5 immunopositive staining, the positive cells exhibit yellow to brown color in the nucleus and/or cytoplasm. A total of one hundred cells were evaluated from 10 representative regions from each case. The immunohistochemistry results were analyzed according to staining intensity, immunodetection and the number of positive cells. We evaluated the results of staining individually to achieve a final agreement regarding controversial cases using a multihead microscope.
Based on the following criteria, CDK5 expression was classified semiquantitatively as follows: no staining was recorded as 0; weak staining with focal or fine granular morphology was recorded as 1; linear or cluster, strong staining was recorded as 2; and diffuse, intense staining was recorded as 3. The score ranged from 0 to 3 for the percentage of positive cells in each scenario. A score of 0 was recorded when no staining was observed. A score of 1 indicated that less than 30% of cells were stained. A score of 2 indicated that 30% to 70% of cells were positive. If greater than 70% cells were positive, a score of 3 was recorded. The samples were then categorized as positive or negative based on the sum of the scores as follows: score 0–2 implied negative; 3 implied weakly positive (+); 4 implied moderately positive (++) and 5–6 implied strongly positive (+++). Any score greater than 3 in the present study was considered to indicate positive expression in this study.
TCGA dataset
CDK5 expression was analyzed by file data downloaded from the TCGA database (http://cancergenome.nih.gov/). The CDK5 expression data consist of individual 374 HCC samples and 50 normal controls. Clinicopathological parameters, including age, gender, tumor status, race, relative family cancer history, histological grade, TNM stage, pathological T stage, pathological N stage, pathological M stage and vascular tumor cell type, were also estimated. The data above were used to assess the correlation between CDK5 levels and prognosis as presented in the results.
Other open databases
To further examine the CDK5 expression pattern in HCC, we collected HCC-relevant RNA-seq and microarray datasets from GEO (https://www.ncbi.nlm.nih.gov/geo/), ArrayExpress (http://www.ebi.ac.uk/arrayexpress/), and Oncomine (https://www.oncomine.org/resource/login.html) databases. The following search words were employed: (malignan* OR cancer OR tumour OR tumour OR neoplas* OR carcinoma) AND (hepatocellular OR liver OR hepatic OR HCC).
Bioinformatic analysis
The RNA-Seq data of liver HCC downloaded from TCGA were analyzed using the Limma package of R language (http://www.bioconductor.org/packages/release/bioc/html/limma.html) to identify DEGs between liver HCC and non-tumor tissues. DEGs were selected based on the following criteria: Padj<0.05 and |log2 Fold Change| (|log2FC|) >1. Next, WGCNA, an algorithm for the identification of co-expression gene modules, was performed to compute a set of genes related to CDK5. The process was accomplished using the WGCNA package of the R language (https://labs.genetics.ucla.edu/horvath/CoexpressionNetwork/Rpackages/WGCNA/). For CDK5-related genes, GO and KEGG pathway analyses were performed by the online bioinformatic tool The Database for Annotation, Visualization and Integrated Discovery (DAVID) v6.8 and visualized by the R package ‘GOplot’ and ‘ggplot2’.
Experiment in vitro
The human hepatic cell lines HepG2 and HepB3 were purchased from the American Type Culture Collection (ATCC, Rockville, MD, USA). CDK5-siRNA was obtained from Sangon Biotech (Shanghai, China) [17].
Viability
Cell viability was measured by fluorimetric detection of resorufin. The procedure was performed per the manufacturer’s instructions. After transfecting CDK5-siRNA in HepG2 and HepB3 cell lines, cell viability was assayed at 0, 5, and 10 days and compared with mock controls and scrambled siRNA controls.
Cell proliferation
To further verify the cell viability assay data obtained as described above, cell proliferation was measured using a colorimetric tetrazolium (MTS) assay.
Caspase-3/7 activity detection
A synthetic rhodamine-labeled caspase-3/7 substrate (Apo-ONEW Homogeneous caspase-3/7 Assay, G7790, Promega, Madison, WI, USA) was used to measure caspase-3/7 activity immediately after the detection of the cell viability as described above. The procedure was performed per the instructions of the manufacturer.
Evaluation of cell apoptosis and morphology using fluorescence microscopy
The impact of CDK5 siRNAs on apoptosis in cell lines was assayed using Hoechst 33342 and propidium iodide (PI) double fluorescent chromatin staining as described in our previous study [17-19]. Briefly, HepG2 and HepB3 cells were treated with Hoechst 33342 (5 µg/ml) after centrifugation at 1500 rpm. Then, cells were stained with PI for 15 min in the dark. The apoptotic rate was obtained from the comparison of the number of apoptotic cells from distinct experimental groups/the number of viable cells in the same well.
Statistical analysis
SPSS 22.0 (SPSS Inc., Chicago, IL, USA) was applied for statistical analysis of IHC results. Pearson Chi-Square tests was used to evaluate the significance of the role CDK5 in the HCC pathological categories. Pearson Chi-Square tests were also performed to compare CDK5 expression based on the parameters of age, gender, tumor stage (TNM), lymph node metastasis and distal metastasis. The associations between CDK5 expression levels and the clinicopathological characteristics were evaluated using Spearman’s correlation. The diagnostic value of CDK5 was identified by employing ROC. P-values less than 0.05 indicated a statistically significant difference.
Regarding data from the TCGA and other public databases, SPSS 22.0 was also used for statistical analysis. R, OriginPro 2017 (Northampton, Massachusetts, USA), and GraphPad Prism 5 (San Diego, CA, USA) were used to plot figures. Data were presented as mean±SD in each of the datasets. The independent-samples T test was used to compare the differential CDK5 expression level in different patients (HCC vs. Normal). Similarly, CDK5 expression level in clinicopathological parameters, such as tumor stage (TNM), age, gender, histological stage, and race, were analyzed by independent-samples T test separately. ROC was employed to identify the diagnostic value of CDK5 protein in HCC. Statistical significance was determined at P<0.05.
To obtain a comprehensive perspective on CDK5 expression, we integrated multiple source data in the form of meta-analysis using STATA 12.0 (StataCorp, College Station, TX, USA). The total SMD was computed. When SMD>0 and its 95% CI did not cross, an integer of 0 indicated that CDK5 in tumors is significantly overexpressed compared with adjacent non-tumor tissues. To further study the comprehensive efficiency of CDK5 in distinguishing tumor from non-tumor tissues, we generated SROC curves and calculated the AUC value with 95% CI, sensitivity and specificity.
In vitro experimental data were analyzed by SPSS and graphed using GraphPad Prism 5 (GraphPad Software Inc., La Jolla, CA, USA) directly. Appropriate graphs (category graph, symbols and lines, interleaved bars, and vertical) were generated to represent the relationship between CDK5 and proliferation as well as HCC cell apoptosis.
Conflicts of interest
The authors declare that there is no conflict of interest.
FUNDING
The study was supported by Funds of National Natural Science Foundation of China (NSFC81560386), Guangxi Medical University Training Program for Distinguished Young Scholars (2017) and Guangxi Zhuang Autonomous Region University Student Innovative Plan (No. 201610598091). The funders had no role in the study design, data collection and analysis, the decision to publish, or the preparation of the manuscript.
References
1. Attwa MH, El-Etreby SA. Guide for diagnosis and treatment of hepatocellular carcinoma. World J Hepatol. 2015; 7: 1632-51.
2. Palaniappan K, Borkar VV, Safwan M, Vij M, Govil S, Shanmugam N, Rela M. Pediatric hepatocellular carcinoma in a developing country: Is the etiology changing? Pediatr Transplant. 2016; 20: 898-903.
3. Stotz M, Gerger A, Haybaeck J, Kiesslich T, Bullock MD, Pichler M. Molecular Targeted Therapies in Hepatocellular Carcinoma: Past, Present and Future. Anticancer Res. 2015; 35: 5737-44.
4. Dong X, He H, Zhang W, Yu D, Wang X, Chen Y. Combination of serum RASSF1A methylation and AFP is a promising non-invasive biomarker for HCC patient with chronic HBV infection. Diagn Pathol. 2015; 10: 133.
5. Guo H, Yang S, Xu L, Li D, Tang J, Wang S, Wei B, Liu Z. Association between the p73 gene G4C14-to-A4T14 single nucleotide polymorphism and risk of cervical cancer by high resolution melting and PCR with confronting two-pair primers in a Chinese population. Oncol Lett. 2016; 12:721–26.
6. Fukushi S, Yoshino H, Yoshizawa A, Kashiwakura I. p53-independent structure-activity relationships of 3-ring mesogenic compounds’ activity as cytotoxic effects against human non-small cell lung cancer lines. BMC Cancer. 2016; 16:521.
7. Kinoshita A, Onoda H, Imai N, Nishino H, Tajiri H. C-Reactive Protein as a Prognostic Marker in Patients with Hepatocellular Carcinoma. Hepatogastroenterology. 2015; 62: 966-70.
8. Liao CY, Lee CC, Tsai CC, Hsueh CW, Wang CC, Chen IH, Tsai MK, Liu MY, Hsieh AT, Su KJ, Wu HM, Huang SC, Wang YC, et al. Novel Investigations of Flavonoids as Chemopreventive Agents for Hepatocellular Carcinoma. BioMed Res Int. 2015; 2015:840542.
9. Qiao W, Yu F, Wu L, Li B, Zhou Y. Surgical outcomes of hepatocellular carcinoma with biliary tumor thrombus: a systematic review. BMC Gastroenterol. 2016; 16: 11. doi: 10.1186/s12876-016-0427-2.
10. Gérard C, Tyson JJ, Coudreuse D, Novák B. Cell cycle control by a minimal Cdk network. PLOS Comput Biol. 2015; 11:e1004056.
11. Hellmich MR, Pant HC, Wada E, Battey JF. Neuronal cdc2-like kinase: a cdc2-related protein kinase with predominantly neuronal expression. Proc Natl Acad Sci U S A. 1992; 89: 10867-71.
12. Demelash A, Rudrabhatla P, Pant HC, Wang X, Amin ND, McWhite CD, Naizhen X, Linnoila RI. Achaete-scute homologue-1 (ASH1) stimulates migration of lung cancer cells through Cdk5/p35 pathway. Mol Biol Cell. 2012; 23: 2856-66.
13. Lindqvist J, Imanishi SY, Torvaldson E, Malinen M, Remes M, Orn F, Palvimo JJ, Eriksson JE. Cyclin-dependent kinase 5 acts as a critical determinant of AKT-dependent proliferation and regulates differential gene expression by the androgen receptor in prostate cancer cells. Mol Biol Cell. 2015; 26: 1971-84.
14. Sun YQ, Xie JW, Chen PC, Zheng CH, Li P, Wang JB, Lin JX, Lu J, Chen QY, Cao LL, Lin M, Tu RH, Lin Y, et al. Low Expression of CDK5 and p27 Are Associated with Poor Prognosis in Patients with Gastric Cancer. J Cancer. 2016; 7: 1049-56.
15. Ehrlich SM, Liebl J, Ardelt MA, Lehr T, De Toni EN, Mayr D, Brandl L, Kirchner T, Zahler S, Gerbes AL, Vollmar AM. Targeting cyclin dependent kinase 5 in hepatocellular carcinoma--A novel therapeutic approach. J Hepatol. 2015; 63: 102-13.
16. Herzog J, Ehrlich SM, Pfitzer L, Liebl J, Fröhlich T, Arnold GJ, Mikulits W, Haider C, Vollmar AM, Zahler S. Cyclin-dependent kinase 5 stabilizes hypoxia-inducible factor-1α: a novel approach for inhibiting angiogenesis in hepatocellular carcinoma. Oncotarget. 2016; 7:27108–21. https://doi.org/10.18632/oncotarget.8342.
17. Chen G, Kronenberger P, Teugels E, Umelo IA, De Greve J. Effect of siRNAs targeting the EGFR T790M mutation in a non-small cell lung cancer cell line resistant to EGFR tyrosine kinase inhibitors and combination with various agents. Biochem Biophys Res Commun. 2013; 431: 623-9.
18. Chen G, Kronenberger P, Teugels E, De Greve J. Influence of RT-qPCR primer position on EGFR interference efficacy in lung cancer cells. Biol Proced Online. 2010; 13: 1.
19. Chen G, Kronenberger P, Teugels E, Umelo IA, De Greve J. Targeting the epidermal growth factor receptor in non-small cell lung cancer cells: the effect of combining RNA interference with tyrosine kinase inhibitors or cetuximab. BMC Med. 2012; 10: 28.
20. McGlynn KA, Petrick JL, London WT. Global epidemiology of hepatocellular carcinoma: an emphasis on demographic and regional variability. Clin Liver Dis. 2015; 19: 223-38.
21. Ge S, Huang D. Systemic therapies for hepatocellular carcinoma. Drug Discov Ther. 2015; 9: 352-62.
22. Ferlay J, Soerjomataram I, Dikshit R, Eser S, Mathers C, Rebelo M, Parkin DM, Forman D, Bray F. Cancer incidence and mortality worldwide: sources, methods and major patterns in GLOBOCAN 2012. Int J Cancer. 2015; 136: E359-86.
23. El-Serag HB, Rudolph KL. Hepatocellular carcinoma: epidemiology and molecular carcinogenesis. Gastroenterology. 2007; 132: 2557-76.
24. Lin H, Chen MC, Chiu CY, Song YM, Lin SY. Cdk5 regulates STAT3 activation and cell proliferation in medullary thyroid carcinoma cells. J Biol Chem. 2007; 282: 2776-84.
25. Malumbres M. Cyclin-dependent kinases. Genome Biol. 2014; 15: 122.
26. Angelo M, Plattner F, Irvine EE, Giese KP. Improved reversal learning and altered fear conditioning in transgenic mice with regionally restricted p25 expression. Eur J Neurosci. 2003; 18: 423-31.
27. Takasugi T, Minegishi S, Asada A, Saito T, Kawahara H, Hisanaga S. Two Degradation Pathways of the p35 Cdk5 (Cyclin-dependent Kinase) Activation Subunit, Dependent and Independent of Ubiquitination. J Biol Chem. 2016; 291:4649–57.
28. Dhavan R, Tsai LH. A decade of CDK5. Nat Rev Mol Cell Biol. 2001; 2: 749-59.
29. Liu JL, Gu RX, Zhou XS, Zhou FZ, Wu G. Cyclin-dependent kinase 5 regulates the proliferation, motility and invasiveness of lung cancer cells through its effects on cytoskeletal remodeling. Mol Med Rep. 2015; 12: 3979-85.
30. Honma N, Asada A, Takeshita S, Enomoto M, Yamakawa E, Tsutsumi K, Saito T, Satoh T, Itoh H, Kaziro Y, Kishimoto T, Hisanaga S. Apoptosis-associated tyrosine kinase is a Cdk5 activator p35 binding protein. Biochem Biophys Res Commun. 2003; 310: 398-404.
31. Lu JW, Chang JG, Yeh KT, Chen RM, Tsai JJ, Hu RM. Decreased expression of p39 is associated with a poor prognosis in human hepatocellular carcinoma. Med Oncol. 2011; 28:S239–45.
32. Pozo K, Hillmann A, Augustyn A, Plattner F, Hai T, Singh T, Ramezani S, Sun X, Pfragner R, Minna JD, Cote GJ, Chen H, Bibb JA, Nwariaku FE. Differential expression of cell cycle regulators in CDK5-dependent medullary thyroid carcinoma tumorigenesis. Oncotarget. 2015; 6:12080–93. https://doi.org/10.18632/oncotarget.3813.
33. Feldmann G, Mishra A, Hong SM, Bisht S, Strock CJ, Ball DW, Goggins M, Maitra A, Nelkin BD. Inhibiting the cyclin-dependent kinase CDK5 blocks pancreatic cancer formation and progression through the suppression of Ras-Ral signaling. Cancer Res. 2010; 70: 4460-9.
34. Strock CJ, Park JI, Nakakura EK, Bova GS, Isaacs JT, Ball DW, Nelkin BD. Cyclin-dependent kinase 5 activity controls cell motility and metastatic potential of prostate cancer cells. Cancer Res. 2006; 66: 7509-15.
35. Hanahan D, Weinberg RA. Hallmarks of cancer: the next generation. Cell. 2011; 144: 646-74.