
INTRODUCTION
The manifestation of acquired resistance (AQR) to drug treatment following initial response remains a major obstacle in cancer treatment [1, 2]. Recent evidence has shown that acquisition of DNA mutations in tumors can be a common mechanism for AQR, especially to molecular-targeted therapies [3]. A prominent example is the emergence of EGFR T790M “gatekeeper” mutations in tumors at the time of disease recurrence and following initial response to EGFR tyrosine kinase inhibitors in non-small cell lung cancer (NSCLC) patients. Other examples include the emergence of KIT D186V/D186Y mutations in patients treated with imatinib, and ALK L1196M mutations in patients treated with crizotinib.
One approach to counter AQR has been the use of signal transduction inhibitors that act downstream of the initial target of inhibition [4]. A model for this strategy is the inhibition of phosphoinositide 3-kinase (PI3K) and mammalian target of rapamycin (mTOR) signaling in EGFR inhibitor-refractory disease [5–7]. The PI3K/mTOR pathway is a major mediator of EGFR signaling [8], and the activation of this pathway has been observed in EGFR inhibitor-refractory disease [9]. Application of the PI3K/mTOR inhibitor, BEZ235, has been shown to inhibit both the in-vitro and in-vivo proliferation of cells refractory to EGFR inhibitors [7, 10]. A clinical trial has also been initiated involving the use of BEZ235 in NSCLC patients who experience a recurrence following initial response to treatment with EGFR inhibitors (NCT00620594, www.clinicaltrials.gov).
The present study was undertaken to gain insight into the mechanism by which AQR could arise following the application of PI3K/mTOR inhibitors to EGFR inhibitor-refractory lung cancer.
RESULTS
Generation of H1975 clones with acquired resistance to BEZ235
The IC50 concentration of BEZ235 in H1975 human NSCLC cells harboring EGFR T790M mutations was 0.32 ± 0.13μM, consistent with previous reports [7]. H1975 cells were continuously exposed to IC50 concentrations of BEZ235 (H1975C) or DMSO (H1975DM) in-vitro until stable increased resistance was observed at 8 months. From the H1975C cells, 8 clones were generated through single cell colony selection and tested for sensitivity to BEZ235. Two clones with the greatest resistance to BEZ235, H1975C5 (7.2-fold) and H1975C6 (6.1-fold) (Figure 1A), were selected for further experiments. These clones retained similar levels of resistance to BEZ235 when passaged in drug-free media over 12 months (results not shown), demonstrating the AQR to BEZ235 was not transient.
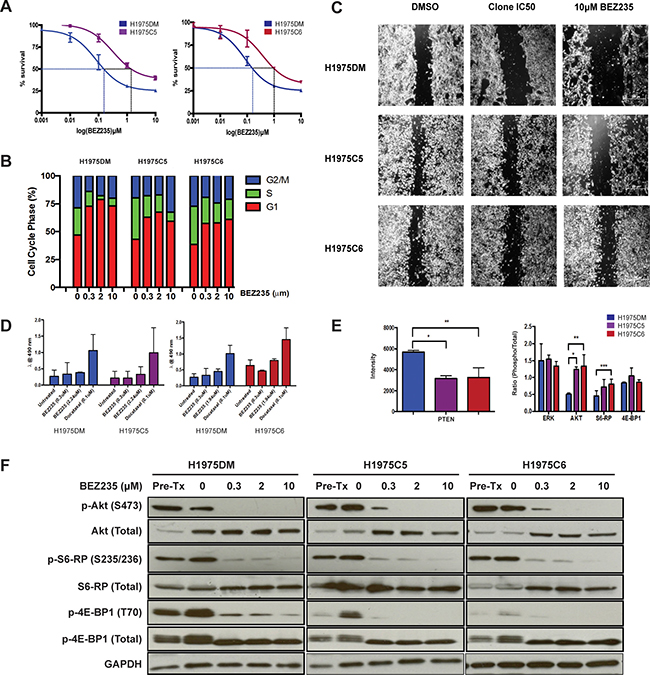
Figure 1: Phenotypes of H1975DM, H1975C5 and H1975C6 cells. (A) Concentration response curves to BEZ235 at 72 h post-treatment. (B) Cell cycle phase distribution following 24h exposure to IC50 concentrations and 10μM BEZ235. (C) Phase contrast images of cells at 20x magnification in migration (wound-healing) assays following 24 h exposure to DMSO and IC50 concentrations or 10 μM BEZ235. (D) Apoptosis levels after 24 h exposure to IC50 concentrations and 10 μM BEZ235, and 0.1μM docetaxel as a positive control. (E) Baseline protein levels of PTEN, and ratios of phosphorylated to total ERK, AKT, S6RP and 4EBP1, determined by western blotting and densitometry. All levels were normalized to GAPDH. (F) Western blots of respective proteins in cells after 24h exposure to DMSO, and IC50 concentrations and 10μM BEZ235. * p < 0.05, paired t-test. All experiments were performed in triplicate.
Cross-resistance to other drugs
All three cell lines retained resistance to gefitinib (IC50 > 10 μM) (Table 1), consistent with previous reports for H1975 cells [11]. H1975C5 and H1975C6 exhibited increased resistance to class IA PI3K inhibitors (GDC0941, BYL719) and a mTOR inhibitor (Ku-0063794) compared to H1975DM cells, indicating the AQR was class-specific rather than just specific to BEZ235. The three cell lines were not differentially sensitive to the MEK inhibitors PD98059 and AZD6244, inferring that the ERK pathway was not activated in AQR to BEZ235, as was hypothesized previously by others [12]. There was also no difference in sensitivity to the cytotoxic agent docetaxel, suggesting that AQR to BEZ235 does not develop through a multidrug resistance mechanism.
Table 1: IC50 concentrations of respective drugs in respective derivatives of H1975 cells
Drug |
Class |
H1975DM |
H1975C5 |
H1975C6 |
|---|---|---|---|---|
BEZ235 |
PI3K/mTOR inhibitor |
0.32 ± 0.13 |
2.29 ± 0.44* |
1.94 ± 0.96* |
GDC0941 |
PI3K inhibitor |
25 ± 12 |
> 100 |
> 100 |
BYL719 |
PI3K inhibitor |
6.0 ± 1.7 |
40 ± 25* |
14 ± 2.5* |
Ku0063794 |
mTOR inhibitor |
0.64 ± 0.78 |
8.7 ± 0.51* |
7.0 ± 1.5* |
Gefitinib |
EGFR inhibitor |
> 10 |
> 10 |
> 10 |
PD98059 |
MEK inhibitor |
> 10 |
> 10 |
> 10 |
AZD6244 |
MEK inhibitor |
15 ± 1.8 |
19 ± 2.8 |
17 ± 3.1 |
Docetaxel |
cytotoxic |
< 0.001 |
< 0.001 |
< 0.001 |
Cell cycle arrest, apoptosis and cell migration
Consistent with previous reports [13, 14], BEZ235 treatment of AQR and H1975DM cells led to G1 cell cycle arrest (Figure 1B) and reduced cell migration (Figure 1C), but had no significant effect on apoptosis levels (Figure 1D). When compared to H1975DM cells, the AQR clones had a reduced G1 block, reduced impedance of cell migration, but no difference in induced apoptosis levels following BEZ235 treatment.
PI3K and mTOR pathway signaling
Compared to H1975DM cells, the AQR clones at baseline had a significantly reduced PTEN expression, increased Akt (S473) and S6RP (S235/236) phosphorylation, but no difference in 4EBP1 (T70) phosphorylation (Figure 1E). Exposure to BEZ235 reduced the phosphorylation of Akt, S6RP and 4EBP1 in H1975DM and the AQR cells (Figure 1F), indicating that altered sensitivity to target inhibition was unlikely to be a mechanism of AQR to BEZ235.
DNA mutation
Targeted next generation sequencing was used to identify likely somatic mutations in regions of high mutation frequency in 50 cancer-related genes. EGFR (L858R, T790M), TP53 (R273H) and CDKN2A (E69X) mutations were detected in all three H1975-derived cell lines, consistent with previous reports [15]. A previously reported G118D mutation in exon 2 of PIK3CA could not be confirmed, as the assay did not interrogate this exon. A previously unreported I391M mutation in exon 6 of PIK3CA was also detected. No other mutations were detected.
Gene expression
Compared to H1975DM cells, 997 genes were differentially expressed with an adjusted p < 0.05 and at least 2-fold difference in AQR clones (Figure 2A, Supplementary Table 1). Of these, the monocarboxylate transporters (MCT), SLC16A7 (MCT2) (adjusted p = 7.82 × 10⁻⁶, 3.2-fold increase) and SLC16A9 (MCT9) (adjusted p = 8.73 × 10⁻⁷, 4.2-fold increase) showed the greatest increase in expression in AQR clones. MCT2 and MCT9 mediate the transport of various metabolic byproducts, including lactate [16] and carnitine [17], respectively. Since lactate is the end product of glycolysis [18], and carnitine is involved in mitochondrial lipid transport [19] and acetyl-CoA equilibrium [20], the observed increase in expression of MCT2 and MCT9 prompted us to investigate the metabolic activity of the cells.
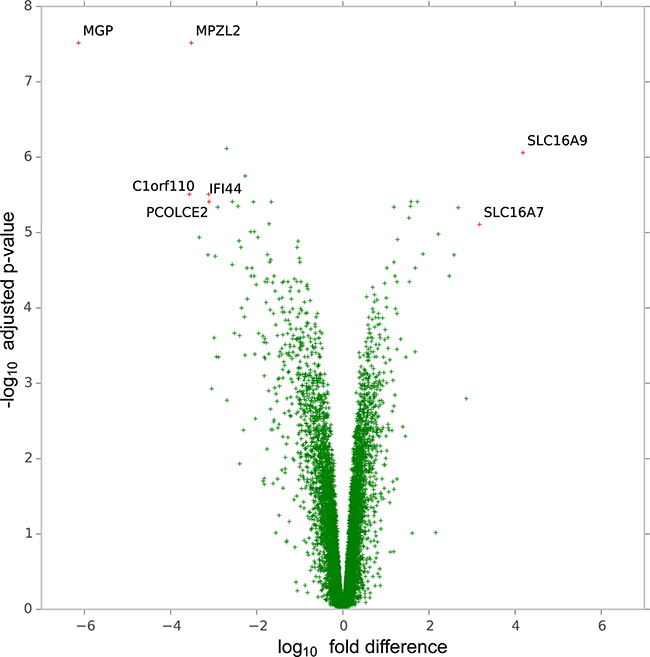
Figure 2: Volcano plot of genes according to the magnitude (fold-difference, x-axis) and significance level (-log10 adjusted p-value, y-axis) of their difference in expression in H1975C5 and H1975C5 cells compared to H1975DM cells from gene expression array analysis.
Glucose metabolism and cellular energetics
Western blot analysis confirmed the increased expression of MCT2 and MCT9 in AQR clones compared to H1975DM cells (Figure 3A). Consistent with increased glycolysis, GLUT1 levels were also higher in AQR clones, although no differences were observed for hexokinase 2 levels. In glucose dependency experiments using crystal violet staining, H1975DM cells were able to grow in the absence of glucose, whereas AQR clones did not (results not shown). Compared to H1975DM cells, the AQR clones also showed increased extracellular lactate levels and reduced reactive oxygen species (Figure 3B), consistent with increased glycolysis.
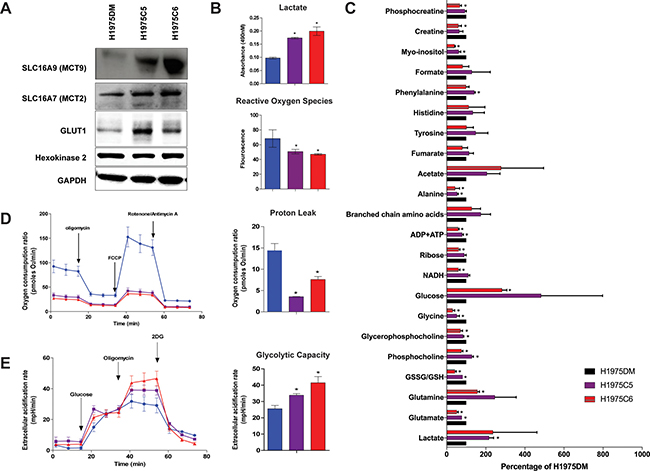
Figure 3: Protein levels and metabolism of H1975DM, H1975C5 and H1975C6 cells. (A) Representative immunoblot of MCT9, MCT2, GLUT1 and Hexokinase 2, and GAPDH as a loading control. (B) Baseline levels of lactate and reactive oxygen species. (C) Baseline metabolite levels according to NMR analysis, relative to levels in H1975DM cells. (D) Kinetic OCR response to oligomycin (for determining ATP coupled respiration), carbonyl cyanide-p-trifluoromethoxy-phenylhydrazone (FCCP) (to establish maximal respiratory capacity) and rotenone (to examine mitochondrial respiration). Proton leak calculation derived from the difference in measurement 12 and measurement 4. (E) Kinetic extracellular acidification rate response to glucose, oligomycin and 2-DG. Glycolytic capacity is the difference between extracellular acidification rate of measurement 9 and that of measurement 3. Displayed are the mean ± SD from triplicate analysis. * indicates p < 0.05, paired t-test.
Analysis of the intracellular levels of 22 metabolites by 1H NMR spectroscopy presented further evidence of increased glycolysis, including significantly increased lactate, glutamine, and glucose levels, and reduced glutamate, glutathione, NADH, and ADP+ATP levels in at least one or both AQR clones compared to H1975DM cells (Figure 3C). Consistent with PI3K/mTOR inhibition [21], reductions in phosphocholine and glycerophosphocholine were observed, although H1975C5 cells also displayed increased phosphocholine. Increased phenylalanine and reduced glycine, ribose, alanine, myo-inositol, creatine and phosphocreatine levels were also observed.
Seahorse XFp extracellular flux analysis showed the AQR clones had lower basal oxygen consumption ratios compared to H1975DM cells (Figure 3D). Assessment of the ratios after mitochondrial uncoupling by carbonyl cyanide-p-trifluoromethoxy-phenylhydrazone revealed the mitochondrial respiratory capacity and proton leak was also lower in AQR clones. The extracellular acidification ratio after glucose addition, representing the glycolytic capacity, was higher in AQR clones compared to H1975DM cells (Figure 3E).
Mitochondrial DNA sequencing
The high glycolysis and low mitochondrial respiration rates of the AQR clones prompted sequencing of mitochondrial DNA (mtDNA). Based on the Cambridge mitochondrial reference sequence, 20 mtDNA variants were identified in all three cell lines (Supplementary Table 2). Two variants were found in both AQR clones but not in H1975DM cells, namely a coding variant in mitochondrial encoded cytochrome c oxidase I (MT-CO1) (ENST00000361624.2: c.1367T>A, G456E) and a non-coding variant in mitochondrial encoded 16S RNA (MT-RNR2) (ENST00000387347: c.819A>C) (Figure 4A). The coding MT-CO1 G456E variant was confirmed by pyrosequencing (Figure 4B).
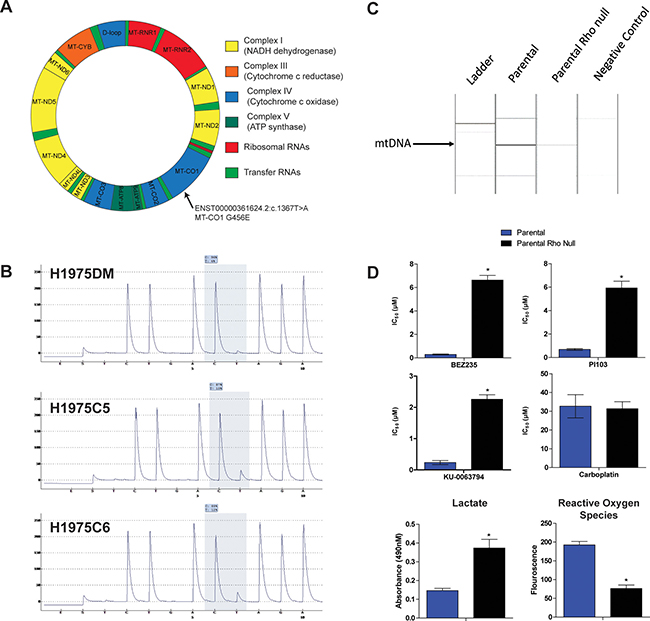
Figure 4: (A) Representation of somatic mitochondrial DNA variants detected only in AQR clones in MT-CO1 gene. (B) Validation of the ENST00000361624.2: c.1367T>A variant by pyrosequencing. (C) PCR verification of ρ(o) status of H1975ρ(o) cells compared with parental H1975 cells. (D) Bar charts showing IC50 values of BEZ235, PI103, KU-0063794 and carboplatin in H1975 (blue columns) and H1975ρ0 (black columns) cells. Also shown are the levels of extracellular lactate and reactive oxygen species in H1975 and H1975ρ0 cells. *p < 0.05, paired t-test.
Drug sensitivity of H1975 Rho null cells
H1975ρ0 cells lacking mtDNA were generated from parental H1975 cells as described in the Methods section and were verified to lack mtDNA by PCR analysis (Figure 4C). H1975 cells cultured in the presence of ethidium bromide but without additional pyruvate and uridine did not grow (results not shown), indicating the preparation process had led to a loss of mitochondrial function. H1975ρ0 cells were less sensitive to PI103, BEZ235 and KU-0063794 compared to parental cells, supporting the notion that mitochondria are a determinant of sensitivity to these drugs (Figure 4D). However, no difference was observed in the sensitivity of H1975ρ0 and parental cells to carboplatin, indicating the influence of mitochondrial function was class-specific. H1975ρ0 cells also had increased lactate and decreased reactive oxygen species levels compared to parental cells, consistent with a shift in energy generation from oxidative phosphorylation to glycolysis in H1975ρ0 cells.
Combination of 3-Bromopryruvate and BEZ235 Treatment
To further investigate the AQR phenotype, sensitivity to the glycolysis inhibitor 3-Bromopyruvate (3BP) was assessed. H1975C5 (IC50= 31 ± 2.8 μM) and H1975C6 (29 ± 3.2 μM) AQR clones were significantly more sensitive to 3BP compared to H1975DM cells (75 ± 6.2 μM) (Supplementary Figure 1A). To examine whether 3BP could re-sensitize AQR clones to BEZ235, a fixed-ratio combination treatment of 3BP and BEZ235 was performed. The combination of 3BP and BEZ235 was synergistic in their effect on cell proliferation in H1975C5 (CI = 0.56 ± 0.01) and H1975C6 (CI = 0.47 ± 0.01) cells, but additive in H1975DM (CI = 1.21 ± 0.02) cells (Supplementary Figure 1B). Further investigation indicated there was no difference in apoptosis levels between the cell lines following combination treatment (Supplementary Figure 1C). Instead, significantly higher LC3B levels, suggestive of increased autophagosomes [22], were observed in the AQR clones compared to H1975DM cells treated with the combination and 3BP alone. Intracellular ATP levels in AQR clones treated with the combination were also decreased compared to baseline levels, although this was also observed in H1975DM cells.
DISCUSSION
This study was aimed at bringing further insight into general mechanisms of AQR in the context of the application of PI3K/mTOR inhibitors to EGFR inhibitor-refractory lung cancer. However, the progress of PI3K/mTOR inhibitors into the clinic has recently slowed due to issues with safety and efficacy [5, 23]. Indeed, the clinical trial involving BEZ235 in EGFR inhibitor-refractory disease closed prematurely due to a high frequency of unanticipated adverse events [24, 25]. Meanwhile, third-generation EGFR inhibitors have since been developed and shown to provide a survival benefit in the refractory setting [26, 27]. The relevance of the clinical indication for which this study was conducted has therefore been somewhat diminished.
Nonetheless, this study has uncovered a new and potentially important mechanism of AQR involving a switch to a glycoytic phenotype associated with mtDNA mutation. It has also provided further information on potential phenotypes of AQR to PI3K/mTOR inhibitors. Significant interest in these agents remains due to reports of clinical activity in certain individuals and indications [28], and to the high frequency of PI3K/mTOR aberrations in cancer [23]. A broader understanding of the activity and isoform specificity of these inhibitors may allow more focused application, and hence a greater realization of their potential [29].
Genome-wide gene expression analysis provided the initial indication for a metabolic switch in AQR cell lines (Figure 2). Sequencing of 50 cancer-related genes determined that no new mutations were acquired in genes such as EGFR, PIK3CA, KRAS and TP53. Evidence for a switch to increased glycolysis and reduced oxidative phosphorylation in the AQR phenotype was subsequently obtained using several experimental approaches. These included an analysis of 22 metabolites by NMR spectroscopy, GLUT1 expression, lactate and reactive oxygen species levels, glucose dependency, rates of oxygen consumption and extracellular acidification (Figure 3), and combination treatment with 3-BP (Supplementary Figure 1).
The finding of mtDNA mutations unique to AQR cells (Figure 4) provides further insight into the development of AQR. Two mtDNA mutations were observed, one of which occurred in the coding region of MT-CO1 (G456E) and was verified by pyrosequencing. MT-CO1 encodes a protein found within complex IV of mitochondrial redox carriers which catalyzes the reduction of oxygen to water [30]. This complex is a major regulator of oxidative phosphorylation [31], and MT-CO1 mutations have previously been associated with weak oxidative phosphorylation in the settings of oxidative stress [32].
A sequence of events resulting from prolonged exposure to BEZ235 and leading to AQR can be hypothesized from the above findings. mTOR can be localized to the mitochondrial membrane, and its inhibition has been shown to influence mitochondrial membrane potential, oxygen consumption and ATP synthesis [33, 34]. Hence, prolonged inhibition of mTOR by BEZ235 could have interfered with mitochondrial potential, leading to mtDNA mutation and mitochondrial dysfunction. In the environment of mitochondrial dysfunction, clones that increased their glycolysis rate to compensate for the impaired oxidative phosphorylation were then able to out-compete other cells for energy production and resources. These changes included the ability to efflux elevated lactate resulting from glycolysis and excess carnitine no longer required for AcetylCoA, as can be inferred from the overexpression of SLC16A4 and SLC17A9 (Figure 2), respectively. These changes also included increased glutamine levels for anaplerosis, as observed by NMR spectroscopy (Figure 3C). The changes in energy requirements and pathways for cell viability, and lower dependence on mitochondrial function may have led to a lower dependence on mTOR in its roles of sensing cellular nutrient, oxygen and energy levels and integrating growth factor signaling with glycolysis and oxidative phosphorylation [35]. Through such events, the AQR clones would have had a reduced reliance on mTOR signaling for their survival, thereby manifesting in their observed AQR to PI3K/mTOR inhibitors. In support of this hypothesis, elimination of mitochondrial function in H1975 cells (H1975ρ0 cells) led to increased glycolysis, reduced oxidative phosphorylation, and increased class-specific resistance to PI3K/mTOR inhibitors (Figure 4).
To our knowledge, only one other study has investigated AQR to PI3K/mTOR inhibitors. Using genome-wide methylation analysis, Qian et al. (2015) [36] observed that AQR to BEZ235 in nasopharyngeal cancer cells was associated with increased DNA hypermethylation and suppression of PTEN and PPP2R2B expression, resulting in activation of the AKT/mTOR and PDK1/MYC pathways. Treatment with inhibitors of DNA methyltransferases increased the sensitivity of the AQR cells to BEZ235, leading the authors to conclude that DNA hypermethylation was a key modulator of AQR. Consistent with this study, reduced PTEN, along with elevated pAKT, pmTOR and pS6 expression, was observed in the current study (Figure 1). Whereas Qian et al. reported an increased G2M cell cycle distribution, a reduced G1 arrest post-BEZ235 treatment was observed in the current study (Figure 1B). A phenotype of increased migration was observed in the current study (Figure 1C), consistent with the increased invasion reported by Qian et al., and possibly related to the invasive properties associated with elevated lactate [18] (Figure 3). In both studies, reductions in pAKT, pS6 and p4EBP expression (Figure 1F) were also observed in AQR cells following BEZ235 treatment, indicating the resistant phenotype did not result from the loss of BEZ235 activity, but rather through alternative mechanisms. Taken together, the present findings and those of Qian et al. appear to be complementary. The current results shed light on how the changes observed in AQR cells may have been initiated, propagated and ultimately manifested, while those of Qian et al. demonstrate how the competitive characteristics of these cells may have developed through hypermethylation.
In conclusion, the results of this study highlight a mechanism by which AQR could develop following a switch in metabolism associated with mtDNA mutation. This expands our understanding of the ways in which AQR can develop, that have included altered drug intake and efflux, altered drug metabolism, alteration of drug targets through mechanisms such as target gene mutation and amplification, activation of redundant pathways, and impaired apoptosis [1]. Such insights provide a rationale for novel approaches to combat AQR, including the use of drugs that manipulate metabolism [37]. Indeed, AQR cells were found here to be sensitive to the glycolysis inhibitor 3-BP, and combination treatment with BEZ235 was synergistic in these cells (Supplementary Figure 1). However, additional work is required to evaluate whether the effects observed here are also valid in other in-vitro, in-vivo and clinical settings, and whether the AQR and corresponding interventional principles apply to other drugs or metabolic inhibitors. The observation of mtDNA mutations also warrants further investigation into their involvement in AQR, and possibly also with intrinsic resistance and tumorigenesis [38].
MATERIALS AND METHODS
Cells
H1975 cells were obtained from American Type Culture Collection (Manassas, VA) and maintained in RPMI 1640 (Thermo Fisher Scientific, Waltham, MA) supplemented with 10% fetal bovine serum (Thermo Fisher Scientific) and 1% antimycotic/antibiotic solution (Gemini Bio-Products, West Sacramento, CA) at 37°C in a humidified atmosphere containing 5% CO2. For the initiation of experiments, cells in the exponential growth phase were used.
Compounds
BEZ235 was kindly provided by Novartis Pharma AG (Basel, Switzerland). Docetaxel was obtained from Sigma Aldrich (St. Louis, MO), gefitinib, and Ku0063794 from Biovision (Milpitas, CA), and PD-98059, GDC-0941, and BYL719 from Cayman Chemicals (Denver, CO). All compounds were diluted to stock solutions and stored according to supplier recommendations.
Drug sensitivity analysis
Approximately 3,000 cells in 90 μl of medium were seeded in individual wells of 96 well plates (Nunc, Rochester, NY). Compounds were diluted to graded concentrations in culture media and 10 μl of respective aliquots were added to respective wells 24 hours after seeding. A total of 20 μl of CellTiter 96 Aqueous One Solution Cell Proliferation reagent (Promega, Madison, WI) was added to each well and incubated for 1.5 hours. Absorbance was measured at 490 nm using Tecan Infinite 200 Pro microplate reader (Tecan, Mannedorf, Switzerland). An IC50 value for each compound, representing the concentration of compound that inhibited cell proliferation to 50% of vehicle controls, was calculated as previously described [39].
Drug combination analysis was evaluated using the median-effect equation and combination index (CI) method of Chou and Talalay [40]. Briefly, two compounds were added at fixed ratios of their respective IC50 concentrations for 72 hours. The CI was then determined using the formula CI = [(D)1/(Df)1 + (D)2/(Df)2] + [(D1)(Df)2/(Df)1(Df)2], where (D)1 and (D)2 are the concentrations of the combination required to produce the fraction unaffected, and (Df)1 and (Df)2 are the concentrations of the individual drugs required to produce the fraction unaffected. Median-effect plots with linear regression coefficients (R2) < 0.95 were excluded. CI values with the non-exclusive assumption were used for reporting. CI values of less than 1, between 1-2 or greater than 2 were considered to indicate synergism, additivity or antagonism, respectively.
Cell cycle distribution analysis
Cells were washed with ice cold phosphate-buffered saline (PBS), trypsinized and fixed with 70% ethanol at 4°C. The cells were incubated in a staining solution (1 × PBS, 100U/mL RNase A, 40U/mL propidium iodide) for 24 hours. Cell counting was then performed using the BD LSRII flow cytometer (BD Biosciences, Franklin Lakes, NJ).
Cell apoptosis analysis
Approximately 3,000 cells were seeded per well in 96-well plates and allowed to adhere for 24 hours. Cells were exposed to appropriate compounds for 24 hours and detection of nucleosomes was then performed using the Roche Cell Death ELISA Detection Kit (Roche, Mannheim, Germany) according to manufacturer recommendations.
Cell migration analysis
Approximately 2 × 10⁵ cells were plated per well in 6-well tissue culture plates and allowed to proliferate to 90% confluence. A scratch in each well was made using a 200μl pipette tip. Concentrations of BEZ235 (equimolar, equitoxic and 5×IC50) and DMSO as a control were added in respective wells. Images of the cells were taken 24 hours after drug exposure using a Axio Vert.A1 microscope (Zeiss, Oberkochen, Germany).
Protein expression analysis
Cells were washed with ice cold PBS, and lysed with cell lysis buffer (Cell Signaling Technology, Beverly, MA). Protein concentrations were determined using the BCA protein estimation assay (Thermo Fisher Scientific). Equal amounts of protein were combined with 5× sample buffer (250mM Tris-HCl pH6.8, 10% SDS, 30% glycerol, 5% β-mecaptoethanol, and 0.02% bromophenol blue) at a 1:4 ratio and separated on a 4–20% Tris-glycine pre-cast gel (Thermo Fisher Scientific). Proteins were transferred to a 0.45μm nitrocellulose membrane before blocking with 5% milk in TBS-T (20mM Tris, 150mM NaCL, 0.01% Tween-20) for 60 mins, and then incubation with specific antibodies. The blots were incubated with a HRP-linked secondary antibody, resolved with the RPN2232 chemiluminescence reagent (GE Healthcare, Little Chalfont, UK) and visualized using X-ray film on the ImageQuant LAS500 (GE Healthcare).
Targeted genomic DNA sequencing
DNA was extracted from cells using the DNeasy Blood and Tissue kit (Qiagen) and analyzed for DNA variants in 50 genes using the Ion AmpliSeq Cancer Hotspot Panel v2 assay on the Ion Torrent PGM (Thermo Fisher Scientific). The genes analyzed were ABL1, AKT1, ALK, APC, ATM, BRAF, CDH1, CDKN2A, CSF1R, CTNNB1, EGFR, ERBB2, ERBB4, EZH2, FBXW7, FGFR1, FGFR2, FGFR3, FLT3, GNA11, GNAS, GNAQ, HNF1A, HRAS, IDH1, IDH2, JAK2, JAK3, KDR, KIT, KRAS, MET, MLH1, MPL, NOTCH1, NPM1, NRAS, PDGFRA, PIK3CA, PTEN, PTPN11, RB1, RET, SMAD4, SMARCB1, SMO, SRC, STK11, TP53, and VHL. Sequencing was performed using the Ion Ampliseq Sequencing 2.0 kit and Ion 318 chips. Data analysis was performed using Ion Torrent Suite V3.6.2 with the IT Variant Caller Plugin, V3.6. DNA variants were filtered for those that had a quality score greater than 200, were non-synonymous, and had a minor allele frequency of less than 5% in the 1000 Genomes Database.
Gene expression analysis
Approximately 5.0 × 10⁵ cells were seeded in T25 flasks in triplicate, incubated for 24 hours and then washed with PBS and trypsinized. RNA was extracted from the cells using the Qiagen RNeasy Blood and Tissue Kit (Qiagen). Amplified cDNA was generated from 200 ng RNA using the Applause WT-Amp ST system (NuGEN, San Carlos, CA) and analysed using Affymetrix Human Gene 1.0ST array on the Genechip Fluidics Station 450 FS450 (Thermo Fisher Scientific). CEL files were loaded into the R Bioconductor environment using the oligo package [41], normalized using the Robust Multi-Array Average method with the default settings [42], and assessed using the Linear Models for Microarray method [43].
Metabolite analysis
Cells were washed in cold saline and mixed with equal volumes of cold methanol, chloroform and water. Lyophilized samples of the water-soluble phase were reconstituted in 540μl of a D2O solution containing 0.075% (w/v) 3-(trimethylsilyl) propionic-2,2,3,3-d4 acid as internal reference for analysis by 1H NMR. The 1H NMR spectra were acquired at room temperature on a 500 MHz Bruker spectrometer (Billerica, MA) using a 30º flip angle, a 1s repetition delay, a spectral width of 13 ppm and 64 K data points under conditions of water signal suppression. Spectra were processed using MestRe-C version 4.9.9.6 (University of Santiago de Compostela, Spain) and the content was determined by peak integration, normalized relative to the internal standard and corrected for cell number per sample.
Mitochondrial respirometry
Mitochondrial oxygen consumption ratio and extracellular acidification rate analysis was performed using Seahorse XFp Extracellular Flux Analyzer (Agilent). Cells were cultured in XFp Miniplates at a concentration of 10,000 cells/well in RPMI medium. After 24 h, cells were washed twice with 180 μl of assay medium and incubated at 37°C for one hour. For oxygen consumption ratio, cells were analyzed using the XFp Mito Stress Test Kit. Measurements were taken at baseline, and following addition of 1μM oligomycin, 0.5 μM carbonyl cyanide-p-trifluoromethoxy-phenylhydrazone and 0.5 μM rotenone/antimycin A. For extracellular acidification rate, cells were analysed using the XFp Glycolysis Stress Test Kit. Measurements were taken after addition of 10 mM Glucose, 1μM oligomycin and 50 mM 2-deoxyglucose.
Mitochondrial DNA sequencing
DNA was extracted from the cells using the DNeasy Blood and Tissue kit (Qiagen). Mitochondrial DNA was amplified from 200ng DNA using the REPLI-g Mitochondrial DNA Kit (Qiagen). Subsequently, 4nM of mitochondrial DNA were sequenced using the Illumina MiSeq Desktop Sequencer (Illumina). Sequencing reads were aligned to the Revised Cambridge Reference Sequence (rCRS) (gi|251831106|ref|NC_012920.1) [44] using BWA v0.7.12 [45]. An additional alignment for insertions and deletions was also performed using the GATK IndelRealigner v3.4-0 (10.1101/gr.107524.110). Genomic variations were identified by referencing the rCRS sequence using the GATK unified genotyper (10.1101/gr.107524.110). Variants were annotated using Variant Effect Predictor (VEP) perl script version 80 [46] that references the Ensembl release 80 database.
For confirmation of variants, 100 ng of mitochondria DNA underwent pyrosequencing using the PyroMark Q24 system (Qiagen). The PCR mix comprised 25 μl of 100 ng DNA, 2.5 μl of PCR buffer with MgCl2, 0.5 μl of dNTP mix, 0.2 μl of Taq Polymerase (Roche), and 2.5 μl of forward and 2.5 μl of reverse primer (IDT, Coralville, IA). Thermal cycling comprised 95°C for 4min, followed by 40 cycles of 30 seconds at 94°C, 30 seconds at 65°C and 30 seconds at 72°C, before incubation at 72°C for 7 min. The primers for MT-CO1 were Forward: 5ʹ-TTC TTC CCA CAA CAC TTT CTC G-3ʹ, Reverse: 5ʹ-GGG CAT CCA TAT AGT CAC TCC A-3ʹ and the pyrosequencing sequence was CTA C/TA GAT GAT AGG ATG TTT CAT GTG GTG. All samples were run in triplicate.
Generation of H1975 cells lacking mitochondrial DNA
H1975ρ0 cells lacking mitochondrial DNA were generated as previously described [47]. Briefly, cells were cultured for 1 month in DMEM media containing 25mmol/L glucose supplemented with 10% fetal bovine serum, 50ng/ml ethidium bromide, 50 ng/ml uridine, 1mM sodium pyruvate and 1× antibiotic antimycotic solution (Sigma-Aldrich, St. Louis, MO). For verification, DNA was extracted from the cells using the DNeasy Blood and Tissue kit (Qiagen) and underwent PCR analysis for nuclear and mitochondrial DNA. The PCR mix comprised 100 ng DNA, 2.5 μl of PCR buffer with MgCl2, 0.5 μl of DNTP mix, 0.2 μl of Taq Polymerase (Roche), and 2.5 μl of forward and reverse primer (IDT) in a total volume of 25μl. The primers were as follows: Nuclear DNA Forward: 5ʹ-CAT TGC TCC TCC TGA GCG CAA-3ʹ, Nuclear DNA Reverse: 5ʹ-GCT GTC ACC TTC ACC GTT CCA-3ʹ, Mitochondrial DNA Forward: 5ʹ-ACA ATA GCT AAG ACC CAA ACT GGG-3ʹ, Mitochondrial DNA Reverse: 5ʹ-CCA TTT CTT GCC ACC TCA TGG GC-3ʹ. Thermal cycling comprised 95°C for 5 min, followed by 40 cycles of 1 min at 94°C, 1 min at 60°C (nuclear DNA) or 63°C (mitochondrial DNA) and 1 min at 72°C, before incubation at 72°C for 10 min. PCR product was analysed using the QIAxcel DNA Screening Kit on the QIAxcel Advanced System (Qiagen).
Abbreviations
3-BP, 3-bromopyruvate; AQR, acquired resistance; mtDNA, mitochondrial DNA
Authors contributions
Conception and Study Design: B Bhattacharya, R Soong, R Soo, Study Supervision: B Bhattacharya, R Soong, B Iacopetta, Experimental Design and Execution: KX Koh, GW Tan, SHL Low, MJ Han, M Feroz, M Beloueche-Babari, B Bhattacharya, Data Analysis and Interpretation: B Bhattacharya, R Soong, M Feroz, M Beloueche-Babari, KX Koh, Writing and Review of Manuscript: R Soong, B Bhattacharya, B Iacopetta, R Soo, M Beloueche-Babari.
ACKNOWLEDGMENTS
None.
CONFLICTS OF INTEREST
None.
FUNDING
This study was supported by the National Research Foundation Singapore and the Singapore Ministry of Education under its Research Centres of Excellence initiative, and a grant for the National University Cancer Institute of Singapore from the National Medical Research Council, Singapore. We also acknowledge support from CRUK Centre for Cancer Imaging grant C1090/A16464 and grant C1060/A10334 from CRUK and EPSRC Cancer Imaging Centre in association with the MRC and Department of Health (England).
REFERENCES
1. Ahronian LG, Corcoran RB. Strategies for monitoring and combating resistance to combination kinase inhibitors for cancer therapy. Genome Med. 2017; 9: 37. https://doi.org/10.1186/s13073-017-0431-3.
2. Gottesman MM. Mechanisms of cancer drug resistance. Annu Rev Med. 2002; 53:615–27. https://doi.org/10.1146/annurev.med.53.082901.103929.
3. Camidge DR, Pao W, Sequist LV. Acquired resistance to TKIs in solid tumours: learning from lung cancer. Nat Rev Clin Oncol. 2014; 11:473–81. https://doi.org/10.1038/nrclinonc.2014.104.
4. Spagnolo F, Ghiorzo P, Queirolo P. Overcoming resistance to BRAF inhibition in BRAF-mutated metastatic melanoma. Oncotarget. 2014; 5:10206–21. https://doi.org/10.18632/oncotarget.2602.
5. LoRusso PM. Inhibition of the PI3K/AKT/mTOR Pathway in Solid Tumors. J Clin Oncol. 2016. https://doi.org/10.1200/JCO.2014.59.0018.
6. Rodon J, Dienstmann R, Serra V, Tabernero J. Development of PI3K inhibitors: lessons learned from early clinical trials. Nat Rev Clin Oncol. 2013; 10:143–53. https://doi.org/10.1038/nrclinonc.2013.10.
7. Sun Z, Li Q, Zhang S, Chen J, Huang L, Ren J, Chang Y, Liang Y, Wu G. NVP-BEZ235 overcomes gefitinib-acquired resistance by down-regulating PI3K/AKT/mTOR phosphorylation. OncoTargets and therapy. 2015; 8:269–77. https://doi.org/10.2147/OTT.S62128.
8. Yap TA, Garrett MD, Walton MI, Raynaud F, de Bono JS, Workman P. Targeting the PI3K-AKT-mTOR pathway: progress, pitfalls, and promises. Curr Opin Pharmacol. 2008; 8:393–412. https://doi.org/10.1016/j.coph.2008.08.004.
9. Yip PY. Phosphatidylinositol 3-kinase-AKT-mammalian target of rapamycin (PI3K-Akt-mTOR) signaling pathway in non-small cell lung cancer. Translational Lung Cancer Research. 2015; 4:165–76. https://doi.org/10.3978/j.issn.2218-6751.2015.01.04.
10. Serra V, Scaltriti M, Prudkin L, Eichhorn PJA, Ibrahim YH, Chandarlapaty S, Markman B, Rodriguez O, Guzman M, Rodriguez S, Gili M, Russillo M, Parra JL, et al. PI3K inhibition results in enhanced HER signaling and acquired ERK dependency in HER2-overexpressing breast cancer. Oncogene. 2011; 30:2547–57. https://doi.org/10.1038/onc.2010.626.
11. Shih JY, Gow CH, Yang PC. EGFR mutation conferring primary resistance to gefitinib in non-small-cell lung cancer. N Engl J Med. 2005; 353:207–8. https://doi.org/10.1056/nejm200507143530217.
12. Moelling K, Schad K, Bosse M, Zimmermann S, Schweneker M. Regulation of Raf-Akt Cross-talk. J Biol Chem. 2002; 277:31099–106. https://doi.org/10.1074/jbc.M111974200.
13. Li C, Xin P, Xiao H, Zheng Y, Huang Y, Zhu X. The dual PI3K/mTOR inhibitor NVP-BEZ235 inhibits proliferation and induces apoptosis of burkitt lymphoma cells. Cancer Cell Int. 2015; 15: 65. https://doi.org/10.1186/s12935-015-0213-1.
14. Lin Z, Mei H, Fan J, Yin Z, Wu G. Effect of the dual phosphatidylinositol 3-kinase/mammalian target of rapamycin inhibitor NVP-BEZ235 against human Merkel cell carcinoma MKL-1 cells. Oncology Letters. 2015; 10:3663–7. https://doi.org/10.3892/ol.2015.3791.
15. Bamford S, Dawson E, Forbes S, Clements J, Pettett R, Dogan A, Flanagan A, Teague J, Futreal PA, Stratton MR, Wooster R. The COSMIC (Catalogue of Somatic Mutations in Cancer) database and website. Br J Cancer. 2004; 91:355–8. https://doi.org/10.1038/sj.bjc.6601894.
16. Kennedy KM, Dewhirst MW. Tumor metabolism of lactate: the influence and therapeutic potential for MCT and CD147 regulation. Future oncology (London, England). 2010; 6: 127. https://doi.org/10.2217/fon.09.145.
17. Suhre K, Shin SY, Petersen AK, Mohney RP, Meredith D, Wägele B, Altmaier E, Deloukas P, Erdmann J, Grundberg E, Hammond CJ, de Angelis MH, Kastenmüller G, et al; CARDIoGRAM. Human metabolic individuality in biomedical and pharmaceutical research. Nature. 2011; 477: 10.1038/nature10354. https://doi.org/10.1038/nature10354.
18. Hirschhaeuser F, Sattler UG, Mueller-Klieser W. Lactate: a metabolic key player in cancer. Cancer Res. 2011; 71:6921–5. https://doi.org/10.1158/0008-5472.can-11-1457.
19. Flanagan JL, Simmons PA, Vehige J, Willcox MD, Garrett Q. Role of carnitine in disease. Nutr Metab (Lond). 2010; 7: 30. https://doi.org/10.1186/1743-7075-7-30.
20. Hynes MJ, Murray SL, Andrianopoulos A, Davis MA. Role of carnitine acetyltransferases in acetyl coenzyme A metabolism in Aspergillus nidulans. Eukaryot Cell. 2011; 10:547–55. https://doi.org/10.1128/EC.00295-10.
21. Beloueche-Babari M, Jackson LE, Al-Saffar NM, Eccles SA, Raynaud FI, Workman P, Leach MO, Ronen SM. Identification of magnetic resonance detectable metabolic changes associated with inhibition of phosphoinositide 3-kinase signaling in human breast cancer cells. Mol Cancer Ther. 2006; 5:187–96. https://doi.org/10.1158/1535-7163.mct-03-0220.
22. Klionsky DJ, Abdalla FC, Abeliovich H, Abraham RT, Acevedo-Arozena A, Adeli K, Agholme L, Agnello M, Agostinis P, Aguirre-Ghiso JA, Ahn HJ, Ait-Mohamed O, Ait-Si-Ali S, et al. Guidelines for the use and interpretation of assays for monitoring autophagy. Autophagy. 2012; 8:445–544.
23. Akinleye A, Avvaru P, Furqan M, Song Y, Liu D. Phosphatidylinositol 3-kinase (PI3K) inhibitors as cancer therapeutics. Journal of Hematology & Oncology. 2013; 6: 88. https://doi.org/10.1186/1756-8722-6-88.
24. Carlo MI, Molina AM, Lakhman Y, Patil S, Woo K, DeLuca J, Lee CH, Hsieh JJ, Feldman DR, Motzer RJ, Voss MH. A Phase Ib Study of BEZ235, a Dual Inhibitor of Phosphatidylinositol 3-Kinase (PI3K) and Mammalian Target of Rapamycin (mTOR), in Patients With Advanced Renal Cell Carcinoma. Oncologist. 2016; 21:787–8. https://doi.org/10.1634/theoncologist.2016-0145.
25. Pongas G, Fojo T. BEZ235: When Promising Science Meets Clinical Reality. The Oncologist. 2016; 21:1033–4. https://doi.org/10.1634/theoncologist.2016-0243.
26. Mok TS, Wu YL, Ahn MJ, Garassino MC, Kim HR, Ramalingam SS, Shepherd FA, He Y, Akamatsu H, Theelen WS, Lee CK, Sebastian M, Templeton A, et al. Osimertinib or Platinum-Pemetrexed in EGFR T790M-Positive Lung Cancer. N Engl J Med. 2017; 376:629–40. https://doi.org/10.1056/NEJMoa1612674.
27. Wang S, Cang S, Liu D. Third-generation inhibitors targeting EGFR T790M mutation in advanced non-small cell lung cancer. Journal of Hematology & Oncology. 2016; 9: 34. https://doi.org/10.1186/s13045-016-0268-z.
28. Massacesi C, Di Tomaso E, Urban P, Germa C, Quadt C, Trandafir L, Aimone P, Fretault N, Dharan B, Tavorath R, Hirawat S. PI3K inhibitors as new cancer therapeutics: implications for clinical trial design. OncoTargets and therapy. 2016; 9:203–10. https://doi.org/10.2147/OTT.S89967.
29. Yap TA, Bjerke L, Clarke PA, Workman P. Drugging PI3K in cancer: refining targets and therapeutic strategies. Current Opinion in Pharmacology. 2015; 23:98–107. https://doi.org/10.1016/j.coph.2015.05.016.
30. Lloyd RE, McGeehan JE. Structural Analysis of Mitochondrial Mutations Reveals a Role for Bigenomic Protein Interactions in Human Disease. PLoS ONE. 2013; 8: e69003. https://doi.org/10.1371/journal.pone.0069003.
31. Kadenbach B, Huttemann M, Arnold S, Lee I, Bender E. Mitochondrial energy metabolism is regulated via nuclear-coded subunits of cytochrome c oxidase. Free Radic Biol Med. 2000; 29:211–21.
32. Whitaker-Menezes D, Martinez-Outschoorn UE, Flomenberg N, Birbe RC, Witkiewicz AK, Howell A, Pavlides S, Tsirigos A, Ertel A, Pestell RG, Broda P, Minetti C, Lisanti MP, et al. Hyperactivation of oxidative mitochondrial metabolism in epithelial cancer cells in situ: visualizing the therapeutic effects of metformin in tumor tissue. Cell Cycle. 2011; 10:4047–64. https://doi.org/10.4161/cc.10.23.18151.
33. Betz C, Stracka D, Prescianotto-Baschong C, Frieden M, Demaurex N, Hall MN. Feature Article: mTOR complex 2-Akt signaling at mitochondria-associated endoplasmic reticulum membranes (MAM) regulates mitochondrial physiology. Proc Natl Acad Sci USA. 2013; 110:12526–34. https://doi.org/10.1073/pnas.1302455110.
34. Schieke SM, Phillips D, McCoy JP Jr, Aponte AM, Shen RF, Balaban RS, Finkel T. The mammalian target of rapamycin (mTOR) pathway regulates mitochondrial oxygen consumption and oxidative capacity. J Biol Chem. 2006; 281:27643–52. https://doi.org/10.1074/jbc.M603536200.
35. Xu K, Liu P, Wei W. mTOR signaling in tumorigenesis. Biochim Biophys Acta. 2014; 1846:638–54. https://doi.org/10.1016/j.bbcan.2014.10.007.
36. Qian XJ, Li YT, Yu Y, Yang F, Deng R, Ji J, Jiao L, Li X, Wu RY, Chen WD, Feng GK, Zhu XF. Inhibition of DNA methyltransferase as a novel therapeutic strategy to overcome acquired resistance to dual PI3K/mTOR inhibitors. Oncotarget. 2015; 6:5134–46. https://doi.org/10.18632/oncotarget.3016.
37. Rahman M, Hasan MR. Cancer Metabolism and Drug Resistance. Metabolites. 2015; 5:571–600. https://doi.org/10.3390/metabo5040571.
38. Carew JS, Huang P. Mitochondrial defects in cancer. Molecular Cancer. 2002; 1: 9. https://doi.org/10.1186/1476-4598-1-9.
39. Bhattacharya B, Akram M, Balasubramanian I, Tam KK, Koh KX, Yee MQ, Soong R. Pharmacologic synergy between dual phosphoinositide-3-kinase and mammalian target of rapamycin inhibition and 5-fluorouracil in PIK3CA mutant gastric cancer cells. Cancer Biol Ther. 2012; 13:34–42. https://doi.org/10.4161/cbt.13.1.18437.
40. Chou TC, Talalay P. Quantitative analysis of dose-effect relationships: the combined effects of multiple drugs or enzyme inhibitors. Adv Enzyme Regul. 1984; 22:27–55.
41. Carvalho BS, Irizarry RA. A framework for oligonucleotide microarray preprocessing. Bioinformatics. 2010; 26:2363–7. https://doi.org/10.1093/bioinformatics/btq431.
42. Gautier L, Cope L, Bolstad BM, Irizarry RA. affy—analysis of Affymetrix GeneChip data at the probe level. Bioinformatics. 2004; 20:307–15. https://doi.org/10.1093/bioinformatics/btg405.
43. Ritchie ME, Phipson B, Wu D, Hu Y, Law CW, Shi W, Smyth GK. limma powers differential expression analyses for RNA-sequencing and microarray studies. Nucleic Acids Research. 2015. https://doi.org/10.1093/nar/gkv007.
44. Bandelt HJ, Kloss-Brandstatter A, Richards MB, Yao YG, Logan I. The case for the continuing use of the revised Cambridge Reference Sequence (rCRS) and the standardization of notation in human mitochondrial DNA studies. J Hum Genet. 2014; 59:66–77. https://doi.org/10.1038/jhg.2013.120.
45. Li H, Durbin R. Fast and accurate long-read alignment with Burrows-Wheeler transform. Bioinformatics. 2010; 26:589–95. https://doi.org/10.1093/bioinformatics/btp698. Epub 2010 Jan 15.
46. McLaren W, Pritchard B, Rios D, Chen Y, Flicek P, Cunningham F. Deriving the consequences of genomic variants with the Ensembl API and SNP Effect Predictor. Bioinformatics. 2010; 26:2069–70. https://doi.org/10.1093/bioinformatics/btq330. Epub 2010 Jun 18.
47. Hashiguchi K, Zhang-Akiyama QM. Establishment of human cell lines lacking mitochondrial DNA. Methods Mol Biol. 2009; 554:383–91. https://doi.org/10.1007/978-1-59745-521-3_23.