
INTRODUCTION
Primary central nervous system lymphomas (PCNSLs) are mature B-cell lymphomas of the diffuse large B-cell lymphoma (DLBCL) type that are confined to the central nervous system (CNS) [1, 2]. PCNSLs account for about 3% of primary CNS tumors, and occur more frequently in patients with immunodeficiency (for instance, due to HIV infection or posttransplant medical immunosuppression) [1, 2]. PCNSLs disseminate within the brain, spinal cord, leptomeninges and cerebrospinal fluid (CSF), as well as the vitreous and chorioretina in about 10% of patients (which is considered a manifestation of CNS lymphoma), and carry a less favorable prognosis than systemic DLBCL [3, 4]. As PCNSLs are usually in close proximity to the ventricular system, CSF is a possible matrix for the investigation of the tumor-environment interaction [5].
Proteins in normal CSF are mainly derived from three different sources: plasma, neural tissue and cells within the CSF [6]. Proteins from neural tissue and tumor cells can be released either passively by tissue leakage due to apoptotic/necrotic processes, or actively by classical or unconventional secretion [7] involving ectodomain shedding [8] or vesicular transport [9]. Recently, bioanalytical approaches have demonstrated that CSF has a complex proteome with more than 2800 proteins [10–14]. The CSF of PCNSL patients has been reported to contain increased levels of cytokines such as interleukin (IL)6, IL-10, CXCL-12 and CXCL-13 [15–20], as well as the ectodomains of transmembrane proteins (sCD27 and sIL-2R) [15, 18, 21, 22].
Here, we used label-free liquid chromatography-mass spectrometry (LC-MS) to detect differences in the CSF proteomes of PCNSL patients and tumor-free controls, and to investigate the interaction of this lymphoma with its microenvironment.
RESULTS
PCNSLs occur most frequently in close proximity to the ventricular system. Therefore, we analyzed CSF from PCNSL patients and tumor-free controls to determine the proteomic signature reflecting the interaction of PCNSL tumors with CNS structures and the vasculature. In total, 17 PCNSL patients and 10 age- and sex-matched tumor-free individuals were analyzed with a quantitative proteomic approach (Table 1; for diagnoses, see Supplementary Table 1A).
Table 1: Demographic data of participating individuals
Tumor-free control |
PCNSL |
|
|---|---|---|
Individuals |
10 |
17 |
Male |
5 |
8 |
Female |
5 |
9 |
Age ± SD |
67.0 ± 5.5 |
63.9 ± 9.1 |
The ages are shown as the mean values of the groups with the corresponding standard deviations. The PCNSL group included patients treated with steroids prior to the extraction of CSF (10 individuals) and patients not treated with steroids (7 individuals).
Analysis of blood-brain barrier (BBB) dysfunction in PCNSL patients
PCNSL is frequently associated with BBB dysfunction, which allows plasma proteins to leak into the CSF, significantly changing its proteomic signature. To control for the extent of BBB dysfunction, we used commercial immunoassays to determine the concentrations of albumin, IgG, IgA and IgM in CSF and serum (Figure 1A, Supplementary Table 1A). We calculated the CSF/serum quotients of albumin, IgG, IgA and IgM to determine whether the elevated plasma protein concentrations in CSF resulted from BBB dysfunction [23]. The age-dependent concentration quotients revealed that the albumin, IgG, IgA and IgM levels in CSF were significantly elevated in 12 of the 17 PCNSL patients and in one of the control patients (Figure 1B, Supplementary Table 1B). Thus, we confirmed that 70% of the analyzed PCNSL patients had BBB dysfunction.
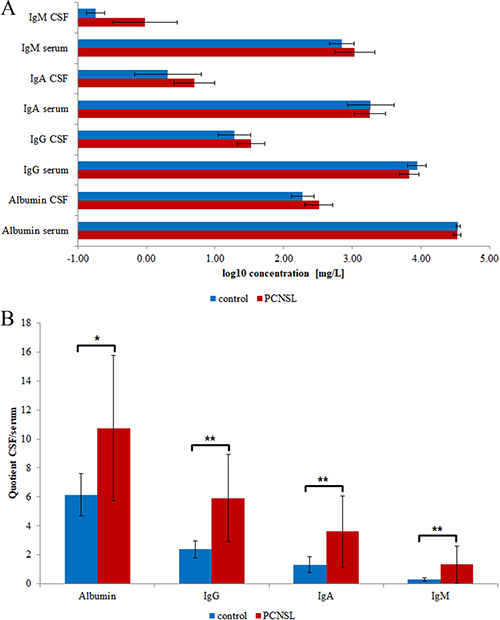
Figure 1: Clinical data of participating individuals. The mean values and corresponding standard deviations are shown. (A) Concentrations of albumin, IgG, IgA and IgM in CSF and serum. (B) CSF/serum concentration quotients of albumin, IgG, IgA and IgM. Significance levels: p < 0.05 (*), p < 0.01 (**).
Proteomic signature of CSF from PCNSL patients
We next used quantitative LC-electrospray ionization (ESI)-MS/MS to compare the CSF proteomic signatures of PCNSL patients (with and without steroid treatment) and tumor-free patients. The CSF proteomic signatures were comparable in PCNSL patients with and without steroid treatment; thus, all the PCNSL patients were grouped together for further data analysis (Figure 2). Using label-free MS, we identified a total of 601 proteins in the CSF, and we quantified 438 of them for which sufficient peptide information (n ≥ 2) was available. Detailed quantification of these 438 proteins revealed a group of 13 bona fide plasma proteins (serum albumin, serotransferrin, immunoglobulin heavy constant gamma 1, complement C3, hemopexin, alpha-1-antitrypsin, prostaglandin-H2 D-isomerase, apolipoprotein A-I, transthyretin, immunoglobulin heavy constant gamma 2, complement C4-A, beta-Ala-His dipeptidase and alpha-1-acid glycoprotein 1) with concentrations above 1 mg/L, comprising 90% and 86% of the total protein amounts in PCNSL patients and tumor-free patients, respectively (Figure 3A and 3B). Albumin was the most abundant protein (mean concentration of 174.6 ± 113.7 mg/L in PCNSL patients), with an average proportion of around 76%. The protein abundances were distributed in a dynamic range of approximately five orders of magnitude for both groups, with the highest concentration for albumin (174.6 ± 113.7 mg/L, PCNSL; 88.7 ± 37.4 mg/L, control) and the lowest for selenoprotein M (1.5 × 10⁻⁵ ± 2.3 × 10⁻⁵ mg/L, PCNSL; 4.8 × 10⁻⁵ ± 4.5 × 10⁻⁵ mg/L, control) (Figure 3C). For four proteins (albumin, IgG, IgA and IgM), the concentrations could be confirmed with commercial immunoassays. These concentrations correlated significantly with the detailed protein concentrations calculated by MS with the Hi-N method (Supplementary Figure 1), demonstrating the accuracy of this method.
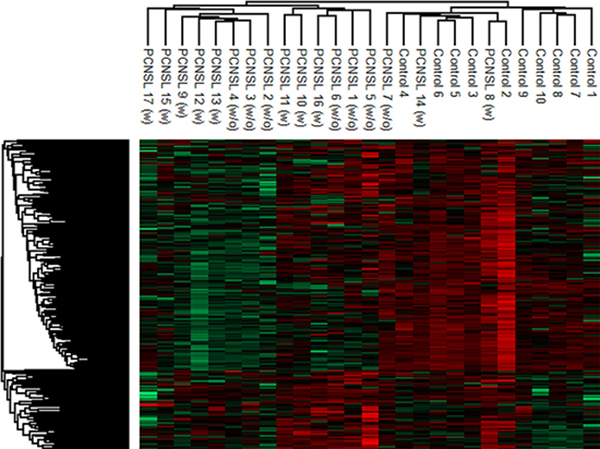
Figure 2: Hierarchical cluster analysis of the CSF proteome in PCNSL and control patients. For the comparison, only proteins (306 proteins) not correlating with the albumin concentration were considered. The comparable proteomic signatures of PCNSL patients treated (10 patients) or untreated (7 patients) with steroids led to the decision to include all PCNSL patients in one group for further data interrogation.
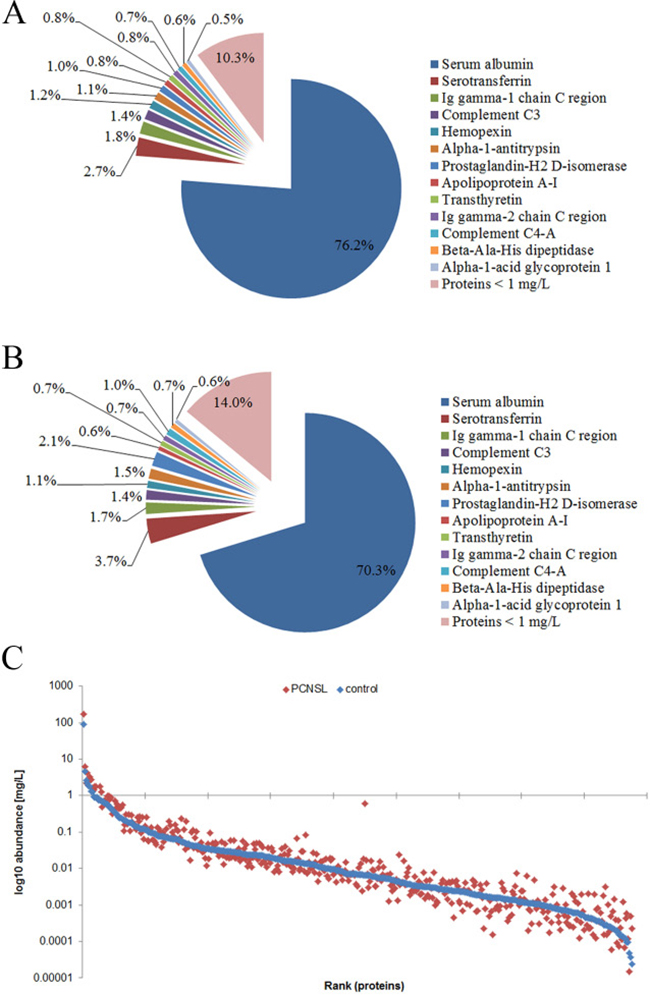
Figure 3: Characterization of the PCNSL CSF proteome. Altogether, 601 and 438 proteins were identified and quantified in the CSF, respectively. A/B. Distribution of quantified proteins in PCNSL patients (A) and tumor-free controls (B) in percentages. Proteins with concentrations >10-5 μg/μL are shown separately, whereas proteins < 10-5 μg/μL are summed. (C) Abundance range of quantified proteins. Abundances are shown in log10 scale (mean concentration of each group; blue: control group, red: PCNSL patients).
As we confirmed that a high proportion of the PCNSL group had BBB dysfunction, we sought to evaluate which proteins had likely leaked into the CSF. To this end, we determined the correlation between the CSF concentration of each identified protein and the CSF albumin concentration. The concentrations of 127 proteins (30% of the proteins quantified) significantly correlated with the CSF albumin concentration, representing the group of BBB leakage proteins (Figure 4A, Supplementary Table 2). The UniProt tissue annotation database indicated that at least 89 of these proteins have been experimentally detected in one of four plasma-associated tissues (72 plasma proteins, p = 5.7 × 10−53; 75 liver proteins, p = 1.4 × 10⁻²⁶; 7 serum proteins, p = 4.1 × 10⁻⁴; and 17 blood proteins, p = 4.7 × 10⁻⁴) (Supplementary Figure 2).
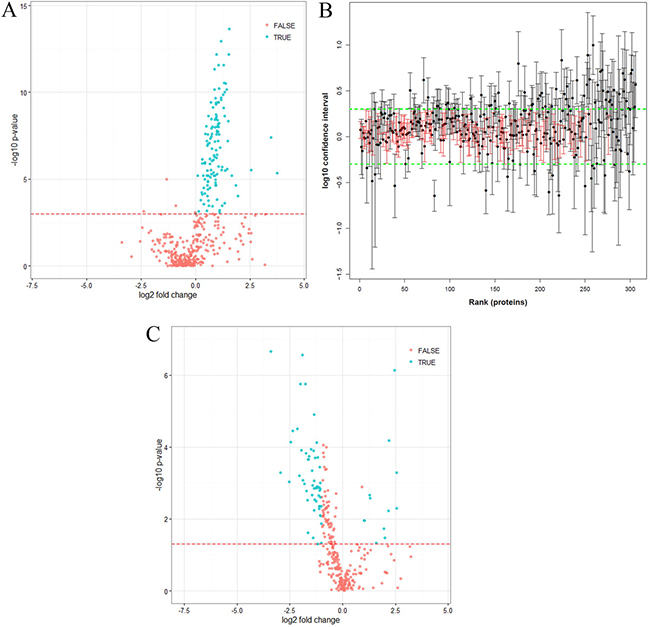
Figure 4: Statistical analysis of quantified proteins. (A) Volcano plot of proteins significantly correlating with CSF albumin, measured by LC-MS (Pearson correlation, p-values corrected with Benjamini-Hochberg correction, Supplementary Table 2). The red line indicates a p-value of p = 0.001. Proteins marked as “true” (p < 0.001) correlated significantly with CSF albumin (positive fold-change, more abundant in PCNSL patients; negative fold-change, more abundant in the control group). (B) Distributions of confidence intervals of proteins not correlating with albumin (Supplementary Table 4). The green line indicates the upper and lower limits calculated from the technical variance (three times the standard deviation). Unchanged proteins (104) are indicated in red. Proteins were ranked according to their abundances (from high to low). (C) Volcano plot of proteins not correlating with albumin (306 proteins) (Supplementary Table 5). The red line indicates a p-value of p = 0.05. Proteins marked as “true” (p < 0.05, fold-change > 2) differed significantly in abundance between the control and PCNSL patients, whereas proteins marked with “false” did not differ significantly (positive fold-change, more abundant in PCNSL patients; negative fold-change, more abundant in the control group).
After the removal of the BBB leakage proteins, a total of 306 proteins were classified as the “PCNSL CSF proteome” (Supplementary Table 3). Again, by means of the UniProt tissue annotation database, we discovered that this group of 306 proteins exhibited significant enrichment of 185 brain-derived proteins (p = 1.9 × 10⁻²). However, 64 proteins were experimentally proven to be abundant in plasma and liver, confirming that CSF is an ultrafiltrate of blood plasma (69 plasma proteins, p = 3.5 × 10⁻¹⁵; and 105 liver proteins, p = 1.3 × 10⁻⁴) (Supplementary Figure 3). Interestingly, 104 proteins exhibited a stable abundance and did not differ significantly between the PCNSL and control groups; these can be regarded as the “CSF core proteome” (Figure 4B, Supplementary Table 4). Differential analysis of the CSF proteome (306 proteins; Supplementary Table 5) revealed that 66 proteins differed significantly (p < 0.05, fold-change > 2.0) between the PCNSL and control CSF proteomes, of which 12 proteins were more abundant in the PCNSL CSF proteome and 54 proteins were more abundant in the control CSF proteome (Table 2, Figure 4C).
Table 2: Differentially abundant proteins in PCNSL patients and tumor-free controls
UniProt accession |
Gene name |
p-value |
Fold change |
Concentration control [mg/L] |
Concentration PCNSL [mg/L] |
Tissue proteome |
Tissue RNA |
Secretion prediction |
|---|---|---|---|---|---|---|---|---|
P04040 |
CAT |
4.99E-03 |
5.9 |
3.10E-04 |
1.81E-03 |
X |
X |
Extra. |
Q9Y279 |
VSIG4 |
5.15E-04 |
5.8 |
1.31E-03 |
7.62E-03 |
X |
Extra./SP/TM |
|
Q86VB7-2 |
CD163 |
7.23E-07 |
5.5 |
4.37E-03 |
2.39E-02 |
X |
Extra./SP/Sec./TM |
|
Q14956 |
GPNMB |
6.68E-05 |
4.6 |
4.45E-04 |
2.04E-03 |
X |
X |
SP/TM |
Q9Y6R7 |
FCGBP |
5.95E-03 |
4.5 |
1.51E-02 |
6.80E-02 |
Extra./SP/Sec. |
||
Q9NZK5 |
CECR1 |
3.36E-02 |
4.0 |
2.55E-04 |
1.02E-03 |
Extra./SP/Sec. |
||
P0DJI8 |
SAA1 |
1.88E-02 |
3.8 |
7.36E-04 |
2.83E-03 |
Extra./SP/Sec. |
||
P18428 |
LBP |
4.60E-02 |
3.0 |
2.23E-04 |
6.69E-04 |
Extra./SP/Sec. |
||
P02747 |
C1QC |
2.62E-03 |
2.5 |
1.61E-02 |
3.95E-02 |
Extra./SP/Sec. |
||
P22897 |
MRC1 |
2.13E-03 |
2.4 |
1.38E-03 |
3.32E-03 |
SP/TM |
||
P02746 |
C1QB |
1.12E-02 |
2.1 |
1.73E-02 |
3.55E-02 |
X |
Extra./SP/Sec. |
|
P01911 |
HLA-DRB1 |
1.09E-02 |
2.0 |
3.71E-04 |
7.51E-04 |
X |
Extra./SP/TM |
|
Q6UXD5-5 |
SEZ6L2 |
4.64E-02 |
-2.0 |
3.79E-03 |
1.88E-03 |
SP/TM |
||
Q9UMF0 |
ICAM5 |
4.44E-03 |
-2.0 |
2.21E-03 |
1.09E-03 |
SP/TM |
||
P55285 |
CDH6 |
1.33E-02 |
-2.0 |
1.60E-03 |
7.88E-04 |
Extra./SP/TM |
||
Q16849 |
PTPRN |
8.22E-03 |
-2.1 |
4.95E-03 |
2.39E-03 |
X |
SP/TM |
|
Q86UX2 |
ITIH5 |
1.47E-03 |
-2.1 |
3.16E-03 |
1.50E-03 |
Extra./SP/Sec. |
||
Q9NX62 |
IMPAD1 |
2.43E-03 |
-2.1 |
2.09E-03 |
9.92E-04 |
TM |
||
Q8TAG5-2 |
VSTM2A |
7.93E-03 |
-2.1 |
6.96E-03 |
3.31E-03 |
Extra./SP/Sec. |
||
Q92859 |
NEO1 |
9.98E-04 |
-2.1 |
2.41E-02 |
1.15E-02 |
SP/TM |
||
Q53EL9 |
SEZ6 |
3.60E-04 |
-2.1 |
6.45E-03 |
3.06E-03 |
Extra./SP/TM |
||
Q92520 |
FAM3C |
1.63E-03 |
-2.1 |
2.39E-02 |
1.12E-02 |
Extra./SP/Sec. |
||
Q96GW7 |
BCAN |
4.50E-03 |
-2.1 |
1.77E-02 |
8.25E-03 |
X |
Extra./SP/Sec. |
|
P47972 |
NPTX2 |
5.14E-03 |
-2.2 |
7.11E-04 |
3.30E-04 |
Extra./SP/Sec. |
||
Q9NYQ8 |
FAT2 |
1.34E-03 |
-2.2 |
9.03E-03 |
4.18E-03 |
Extra./SP/TM |
||
Q16769 |
QPCT |
4.37E-03 |
-2.2 |
1.72E-03 |
7.91E-04 |
Extra./SP/Sec. |
||
P07686 |
HEXB |
2.24E-03 |
-2.2 |
9.44E-04 |
4.29E-04 |
Extra./SP |
||
Q8WZA1 |
POMGNT1 |
4.93E-02 |
-2.3 |
2.50E-03 |
1.11E-03 |
TM |
||
Q9Y646 |
CPQ |
1.91E-04 |
-2.3 |
2.91E-03 |
1.28E-03 |
Extra./SP/Sec. |
||
Q9H3G5 |
CPVL |
1.38E-03 |
-2.3 |
7.55E-04 |
3.29E-04 |
Extra./SP |
||
P54764 |
EPHA4 |
1.24E-03 |
-2.3 |
3.04E-02 |
1.31E-02 |
SP/TM |
||
O00468 |
AGRN |
7.54E-05 |
-2.3 |
1.89E-02 |
8.08E-03 |
X |
Extra./SP/Sec. |
|
Q9NYX4 |
CALY |
3.21E-03 |
-2.4 |
4.97E-04 |
2.10E-04 |
TM |
||
P60174 |
TPI1 |
1.35E-03 |
-2.4 |
2.90E-03 |
1.18E-03 |
X |
X |
Extra. |
Q9Y287 |
ITM2B |
1.99E-04 |
-2.5 |
1.62E-03 |
6.58E-04 |
X |
Extra./Sec./TM |
|
P42785-2 |
PRCP |
2.90E-03 |
-2.5 |
6.23E-04 |
2.48E-04 |
X |
Extra./SP |
|
O75787 |
ATP6AP2 |
1.24E-05 |
-2.5 |
6.77E-04 |
2.67E-04 |
X |
Extra./SP/TM |
|
Q9UPU3 |
SORCS3 |
1.43E-03 |
-2.6 |
1.15E-02 |
4.49E-03 |
SP/TM |
||
Q96B86-4 |
RGMA |
8.69E-04 |
-2.6 |
1.39E-03 |
5.43E-04 |
Extra./SP/GPI |
||
Q9Y2I2 |
NTNG1 |
5.67E-03 |
-2.6 |
6.80E-04 |
2.64E-04 |
SP/Sec./GPI |
||
P78509 |
RELN |
1.28E-04 |
-2.6 |
4.43E-02 |
1.70E-02 |
Extra./SP/Sec. |
||
Q9ULF5 |
SLC39A10 |
3.38E-02 |
-2.6 |
8.68E-04 |
3.29E-04 |
SP/TM |
||
P22748 |
CA4 |
1.15E-03 |
-2.7 |
4.10E-04 |
1.54E-04 |
Extra./SP/GPI |
||
P23470 |
PTPRG |
4.45E-04 |
-2.7 |
6.70E-03 |
2.47E-03 |
Extra./SP/TM |
||
O94910 |
ADGRL1 |
2.13E-03 |
-2.7 |
1.89E-03 |
6.89E-04 |
SP/TM |
||
P23284 |
PPIB |
1.15E-04 |
-2.8 |
1.92E-03 |
6.75E-04 |
X |
X |
Extra./SP |
Q9P2S2 |
NRXN2 |
1.83E-04 |
-3.0 |
3.56E-02 |
1.18E-02 |
SP/TM |
||
Q86UN3 |
RTN4RL2 |
2.22E-04 |
-3.1 |
2.98E-03 |
9.72E-04 |
Extra./SP/GPI |
||
Q9UHL4 |
DPP7 |
2.42E-02 |
-3.1 |
3.82E-04 |
1.23E-04 |
Extra./SP/Sec. |
||
Q9H2E6-2 |
SEMA6A |
2.21E-04 |
-3.1 |
1.42E-03 |
4.52E-04 |
SP/TM |
||
Q8WWX9 |
SELM |
3.01E-03 |
-3.2 |
4.80E-05 |
1.52E-05 |
SP |
||
Q99674-5 |
CGREF1 |
1.65E-03 |
-3.3 |
4.39E-03 |
1.34E-03 |
Extra./SP/Sec. |
||
Q6NW40 |
RGMB |
1.46E-04 |
-3.3 |
1.65E-03 |
4.97E-04 |
SP/GPI |
||
P22304 |
IDS |
1.77E-06 |
-3.4 |
2.31E-03 |
6.85E-04 |
X |
SP |
|
P40925-3 |
MDH1 |
1.06E-03 |
-3.5 |
1.05E-03 |
3.02E-04 |
X |
X |
Extra. |
Q9HAT2 |
SIAE |
8.45E-04 |
-3.7 |
7.47E-04 |
2.04E-04 |
Extra./SP/Sec. |
||
P09417 |
QDPR |
2.71E-07 |
-3.7 |
1.12E-03 |
3.01E-04 |
X |
Extra. |
|
Q9Y5I4 |
PCDHAC2 |
1.23E-04 |
-3.9 |
1.43E-03 |
3.69E-04 |
SP/TM |
||
O15335 |
CHAD |
1.77E-06 |
-4.0 |
2.40E-04 |
6.02E-05 |
Extra./SP/Sec. |
||
O60241 |
ADGRB2 |
6.29E-04 |
-4.1 |
5.19E-03 |
1.25E-03 |
SP/TM |
||
Q9BZR6 |
RTN4R |
3.12E-05 |
-4.5 |
5.60E-04 |
1.26E-04 |
Extra./SP/GPI |
||
Q8IV08 |
PLD3 |
3.49E-05 |
-5.2 |
9.09E-04 |
1.75E-04 |
X |
Extra./TM |
|
Q6MZW2 |
FSTL4 |
7.29E-05 |
-5.5 |
2.46E-03 |
4.48E-04 |
Extra./SP/Sec. |
||
O14917 |
PCDH17 |
9.30E-04 |
-5.8 |
1.14E-03 |
1.95E-04 |
SP/TM |
||
P10586 |
PTPRF |
5.14E-04 |
-7.8 |
1.74E-03 |
2.25E-04 |
Extra./SP/TM |
||
Q96FE5 |
LINGO1 |
2.19E-07 |
-10.5 |
1.61E-03 |
1.54E-04 |
SP/TM |
Only proteins without a significant correlation with CSF albumin were considered as altered by the tumors. Column headers: fold-change, more abundant in PCNSL patients (positive), more abundant in the control group (negative); Concentration control/PCNSL, mean concentration of each group; Tissue proteome/RNA, proteins identified in proteome and/or RNA discovery of tumor tissue. Secretion prediction abbreviations: Extra., extracellular (GO); SP, signal peptide (UniProt); Sec., secreted (UniProt); TM, transmembrane with or without extracellular domain (UniProt); GPI, glycosylphosphatidylinositol anchor for membrane binding (UniProt).
Origin of the altered CSF proteome in PCNSL patients
To explore the interaction of PCNSL with CNS structures and the vasculature, we investigated the origin of the proteomic changes observed in the CSF of PCNSL patients. First, we analyzed whether PCNSL tumor cells contributed directly to the alterations in the CSF proteome. We compared our results with tumor tissue proteome data (930 proteins, unpublished data) and transcritpome data (3773 mRNA transcripts) [24] (Figure 5). Since only proteins that were more abundant in the CSF of PCNSL patients were likely to have originated from PCNSL cells, we considered the 12 candidate proteins that were more abundant (fold-change > 2.0, p < 0.05) in this group. Of these 12 candidate proteins, 6 were identified in PCNSL tissue by LC-MS (2 proteins) and/or cDNA-array analysis (6 transcripts). Second, we performed a bioinformatic analysis of all the proteins that differed in abundance between the PCNSL and control proteomes, to reveal the associated biological processes. In a detailed network enrichment analysis of the 66 altered proteins (Figure 6, Supplementary Table 6), 33 proteins (50%) were successfully assigned to 21 significantly enriched (p < 0.05) biological processes. Twenty-six assigned proteins (79%) that were more abundant in the control group were mainly involved in CNS-associated processes. In summary, our comparative approach suggested that the highest portion of the observed changes in the proteomic signature of PCNSL CSF likely originated indirectly from the CNS enviroment, rather than from the B-cell lymphoma.
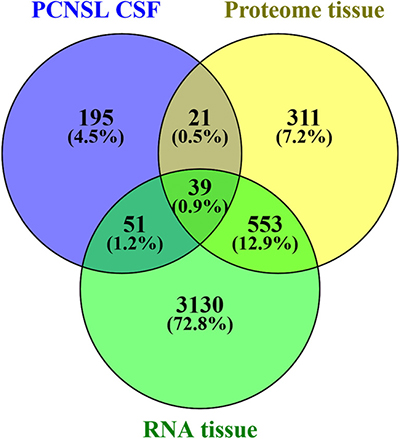
Figure 5: Comparison of differentially abundant CSF protein data and tumor tissue data. The tumor tissue proteome (930 proteins, 1% false discovery rate, ≥ 2 peptides per protein) consisted of 6 independent PCNSL patients (unpublished mass spectrometry data), and the transcriptome study consisted of 21 independent PCNSL patients (3773 genes, occurring in at least 75% of the patients, as published by Montesinos-Rongen in 2008 [24]).
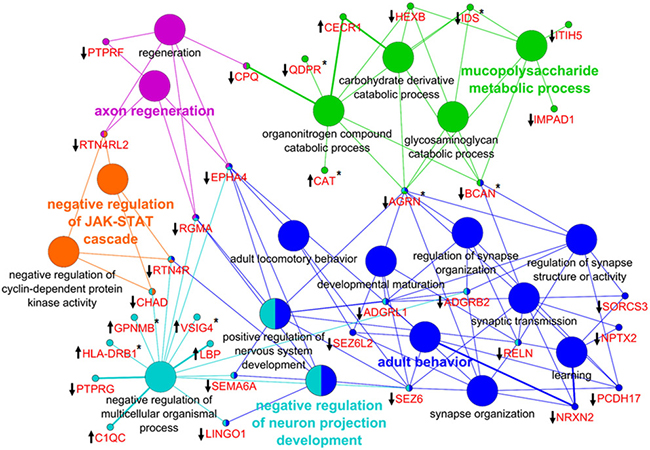
Figure 6: Network enrichment analysis of differentially abundant proteins. In total, 66 proteins were used to generate the network of GO biological processes. Thirty-three proteins (50%) were successfully mapped to 21 unique biological processes. The proteins (gene names) associated with the GO terms are highlighted in red. The direction of alteration is indicated by an arrow, and the occurrence at the proteome or mRNA level is indicated by an asterisk. The color code indicates the group affiliation. The term of each group with the highest significance is shown in bold letters.
Protein ecotodomain shedding contributes to changes in the proteomic CSF signature of PCNSL patients
As proteins from the CNS appeared to contribute significantly to the proteomic signature of CSF from PCNSL patients, we investigated whether the differentially abundant proteins were released actively (by protein secretion) or inactively (by tissue leakage) from the tumor tissue or CNS. We first determined whether the altered proteins were released via classical secretion or ectodomain shedding, as both processes are predicable by sequence analysis. UniProt database interrogation of the 66 differentially abundant proteins revealed that 26 proteins (39.4%) contained a signal peptide for classical secretion, while 36 proteins (54.5%) were membrane-associated, of which 30 proteins contained a transmembrane domain and 6 had a glycosylphosphatidylinositol anchor for membrane binding.
As 36 of the differentially abundant proteins were membrane-associated, we analyzed whether these proteins were potentially released into the CSF via ectodomain shedding. We mapped the peptides identified by MS for each transmembrane protein onto the specific amino acid sequence (Figure 7). For 29 of the 30 transmembrane proteins, we identified peptides exclusively from the extracellular or luminal domain, suggesting that these proteins may have been released by ectodomain shedding. Our bioinformatic analysis revealed that 62 of the 66 differentially abundant proteins were likely present in the CSF due to classical secretion or ectodomain shedding.
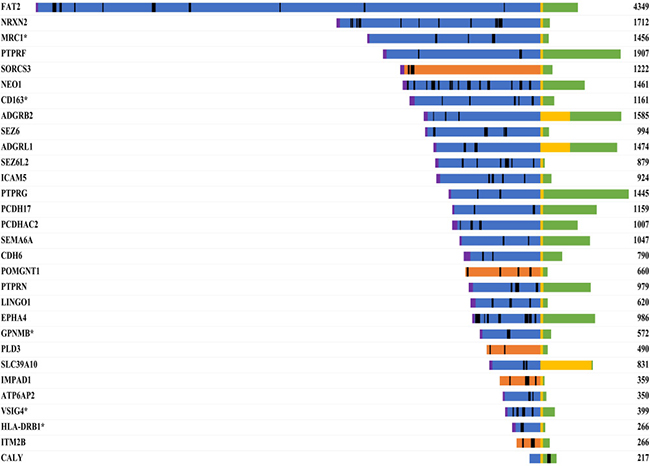
Figure 7: Sequence mapping of identified peptides onto the specific amino acid sequences of transmembrane proteins. Proteins that were more abundant in the CSF of PCNSL patients are marked with an asterisk. The number represents the length of the protein (amino acids). Color code: blue, extracellular; yellow, transmembrane region; green, cytoplasmic; orange, luminal; magenta, signal peptide; black, identified peptides.
DISCUSSION
In this study, we characterized the proteomic signature of CSF from PCNSL patients. With our quantitative proteomic approach, we confirmed that PCNSL is associated with BBB dysfunction. Specifically, by comparing the plasma and CSF concentrations of different plasma proteins (albumin, IgG, IgA and IgM), we identified BBB dysfunction in 12 of 17 PCNSL patients. Contamination from unfiltered plasma proteins can hamper the detailed characterization of the CSF proteome [25–27]. By performing correlation analysis with the albumin concentration [27, 28], we identified 127 proteins as contaminants likely to have leaked into CSF due to BBB dysfunction. After excluding these 127 proteins, we obtained the CSF proteome of PCNSL patients, comprising 306 proteins. More than half of the proteins in this proteome (185 proteins, 60%) likely originated in brain tissue, whereas the rest (64 proteins) were assigned to plasma and liver, reflecting that CSF is an ultrafiltrate of blood plasma. Quantitative analysis of the CSF proteome from PCNSL patients and tumor-free controls revealed 66 proteins with differential abundance and 104 proteins with stable abundance between the groups.
In a previous proteome-wide study of PCNSL patients and tumor-free controls, around 500 proteins were identified in the CSF, 76 of which differed in abundance between the groups [29]. The protein data in this publication of Roy and colleagues were not corrected for BBB dysfunction, which likely explains the small overlap of three candidate proteins (C1QC, BCAN, CPQ). Furthermore, we showed for the first time that treatment of PCNSL patients with steroids had no significant impact on the proteomic signature of the CSF at the time of analysis. This observation was surprising, as we expected a massive influence from apoptotic tumor cells upon steroid treatment. Therefore, we speculate that the extended time between treatment and CSF withdrawal diminished the effects of steroid treatment.
Further, by comparing our CSF data with proteome and transcriptome data from whole-cell lysates of PCNSL tissue, we demonstrated that the verifiable direct contribution of tumor cells to the PCNSL CSF proteome was quite low. Only 6 candidate proteins (of the 12 proteins in CSF that were more abundant in PCNSL patients than in controls) were also identified in tumor tissue. However, secreted proteins may be present at low concentrations in tumor tissue but be enriched in the extracellular space. Thus, we cannot exclude the possibility that most of the suggested biomarkers of PCNSL (such as IL-6 [18], IL-10 [19] and CXCL-13 [17]) and soluble receptor proteins (such as sCD27 [15, 21] and sIL-2R [18]) were more abundant in PCNSL patients because they had originated in PCNSL tumor tissue. Our proteomic approach, with a detection limit of 1.5 × 10⁻⁵ mg/L for CSF analysis, did not allow us to identify such biomarkers in tissues and CSF. Even in large-scale CSF proteome studies, in which protein identification yielded 2630 proteins [10], 2875 proteins [11], 2513 proteins [12] and 2615 proteins [13], the group of cytokines was underrepresented. Despite extensive prefractionation protocols, only sCD27 was identified [11]. This suggests that the limit of detection of the applied LC-MS/MS approach was still too high to identify such protein classes. Thus, targeted approaches such as selected reaction monitoring or antibody-based assays (e.g., enzyme-linked immunosorbent assays) need to be considered.
It is noteworthy that most of the 66 PCNSL-associated proteins could have been actively released, either by classical protein secretion (26 proteins) or by protein ectodomain shedding (36 proteins). Altogether, 36 proteins (55%) with transmembrane domains or glycosylphosphatidylinositol anchors were detected in the CSF, and most of the peptides from transmembrane proteins were from the extracellular or luminal domain, suggesting that PCNSL is associated with altered ectodomain shedding [8, 30]. Twelve of the 36 candidate proteins (Figure 7, Supplementary Table 7) have already been reported to be released by ectodomain shedding, among which CD163 and transmembrane glycoprotein NMB (GPNMB) are known in the context of tumor biology. The shed form of CD163 is upregulated in a large range of inflammatory diseases and Hodgkin lymphoma [31], is induced by anti-inflammatory factors such as IL-6 and IL-10 [32], and is known to be upregulated in PCNSL [18, 19]. CD163 undergoes ectodomain shedding by membrane-bound metalloproteinases of the ADAM family (‘a disintegrin and metalloproteinase;’ e.g., ADAM17), yielding a soluble form (sCD163) of the receptor [33, 34]. The shedding of CD163 can be inhibited by tissue inhibitor of metalloproteinase 3 (TIMP3) [35]. In our study, sCD163 was more abundant in the CSF of PCNSL patients than of control patients, and thus may have been released by tumor cells.
The next candidate protein that has been reported to be upregulated in various cancer types (e.g., melanoma [36, 37], glioma [38] and breast cancer [39]) is GPNMB. GPNMB levels were also found to be higher in CSF from PCNSL patients than from control patients, and therefore likely originated from tumor cells as well. Glioblastoma multiforme patients with increased mRNA and protein levels of GPNMB were reported to have a significantly higher risk of death [38]. Rose and coworkers demonstrated that ADAM10 cleaves GPNMB, releasing a soluble form of the extracellular domain with angiogenic properties [40]. The soluble form of GPNMB produced by ectodomain shedding can induce the expression of matrix metalloproteinase 3 (MMP3) [41], which can shed another transmembrane protein identified in our study, intercellular adhesion molecule 5, releasing a soluble form [42, 43]. Intercellular adhesion molecule 5 was found to be reduced in the CSF of PCNSL patients.
Another candidate protein for ectodomain shedding is human leukocyte antigen (HLA)-DRB1. HLA-DRB1 is part of HLA class II, also known as the major histocompatibility complex (MHC) antigen MHC-II complex. HLA-DRB1 is loaded with peptides derived from antigens that have been endocytosed by antigen-presenting cells. Based on our identification of the ectodomain of HLA-DRB1 in the CSF of PCNSL patients, we suggest an alternative mechanism of cancer-associated immune evasion, which, to our knowledge, has not been described so far. The combined loss of HLA class I and HLA class II antigens is known to occur at a high frequency in PCNSL, thus allowing immune escape [44]. Until now, the loss or aberrant expression of HLA on the cell surface has mostly been linked to cytosolic retention [45] or incorrect loading of the antigen-binding groove [46]. Here, we suggest that HLA class II proteins may be reduced on the cell surface by a proteolytic mechanism, which has been already described for the HLA class I protein HLA-A2 [47]. The ectodomain of HLA-A2 is known to be shed by alpha secretase and further processed by PS1/gamma secretase. Although a vesicular process for MHC II secretion has already been described [48], we speculate that ectodomain shedding may be an alternative process to reduce HLA class II proteins on the cell surface, thus allowing immune evasion.
As we found changes in the abundance of ectodomains from transmembrane proteins in the CSF of PCNSL patients, we suggest that PCNSL tumor cells actively release MMPs or TIMPs, thus altering the shedding of tumor cells or cells in the surrounding CNS environment. Transcriptome data from PCNSL patients [24] support this hypothesis and confirm that members of the ADAM, MMP and TIMP family are broadly expressed in PCNSL tissue. So far, we can only speculate that these shed proteins are involved in PCNSL tumor biology and represent targets for therapeutic interventions.
A combination of different targeted and prefractionation approaches will be necessary to fully exploit the in vivo secretome of PCNSL tissue and reveal the tumor-environment interaction in greater detail. Nevertheless, we suggest that PCNSL influences its environment, leading to ectodomain shedding. It appears that only a few proteins originating from tumor tissue are available for future development as biomarkers to distinguish PCNSL from other diseases, and that proteins from the CNS environment must be considered as surrogate markers.
MATERIALS AND METHODS
Patients, clinical data and CSF collection
All CSF samples were obtained from the Department of Neurology, Knappschaftskrankenhaus Bochum (Bochum, Germany) with patients’ informed consent. CSF was collected by a standard operation procedure. Briefly, CSF was collected by lumbar puncture at ambient room temperature, and the first 10 drops were discarded to avoid blood contamination. CSF was immediately centrifuged at 500× g at 4°C for 10 min to precipitate cell debris. Afterwards, supernatants were aliquoted and stored at 80°C. The whole procedure was performed within 30 min. For the LC-MS study, CSF samples from 27 patients (10 tumor-free controls; 17 PCNSL patients, 7 untreated and 10 treated with steroids) were included (Table 1; for detailed information see Supplementary Table 1A). Patients were selected according to age (control: mean age 67.0 ± 5.5 years; PCNSL: mean age 63.9 ± 9.1 years) and gender (control: 5 male and 5 female; PCNSL: 8 male and 9 female). The concentrations of albumin, IgG, IgA and IgM in serum and CSF were determined by the Knappschaftskrankenhaus Bochum via turbidity measurement (Roche Cobas 6000/Tina-quant, Roche, Mannheim, Germany) or a Nephelometer BN II (Siemens Healthineers, Erlangen, Germany) according to the manufacturers’ instructions.
Preparation of CSF samples
The CSF protein concentration was determined by a Pierce 660 nm Protein Assay as described in the manufacturer’s protocol (Thermo Fisher Scientific, Rockford, IL, USA). For protein digestion, 10 μg protein was diluted to a total volume of 50 μL and mixed with 150 μL SMART digest buffer (Thermo Fisher Scientific, Bremen, Germany). Next, the mixture was transferred to a SMART digest tube containing immobilized trypsin (Thermo Fisher Scientific, Bremen, Germany). Digestion was performed on a tabletop shaker with three consecutive steps: 1200 rpm at 70°C for 60 minutes, 1200 rpm at 80°C for 15 minutes, and 1200 rpm at 90°C for 15 minutes. Proteolysis was stopped by the addition of 200 μL 0.1% trifluoroacetic acid (TFA). For detailed quantification, isotopically labeled (heavy arginine or lysine) synthesized peptides of CD14 (Thermo Fisher Scientific, Ulm, Germany) were spiked into the digested samples in a concentration range of 0.312 to 320 fmol/mL. Subsequently, samples were desalted and purified by solid-phase extraction (SOLAμ HRP SPE Plate, Thermo Fisher Scientific, Bremen, Germany) according to the manufacturer’s instructions. The solvent was completely removed with a vacuum concentrator (Eppendorf Concentrator 5301, Eppendorf, Hamburg, Germany) and stored at 80°C. Each sample was reconstituted in 100 μL TFA prior to LC-MS analysis.
LC-MS analysis of CSF samples
For each LC-MS run, 500 ng sample was analyzed with a nano-high-performance liquid chromatography (HPLC)/ESI-MS system composed of an RSLCnano U3000 HPLC and a QExactive plus mass spectrometer (Thermo Fisher Scientific, Bremen, Germany) equipped with a nano-electrospray ion source. Each sample was loaded onto a trapping column (Acclaim PepMap C18, 2 cm × 100 μm × 3 μm particle size, 100 Å pore, Thermo Fisher Scientific, Bremen, Germany) and desalted with 0.1% TFA for 10 min. Peptides were eluted from the trapping column, separated by an analytical column (Acclaim PepMap RSLC C18; 25 cm × 75 μm × 2 μm particle size, 100 Å pore; Thermo Fisher Scientific, Bremen, Germany) at a constant flow rate of 300 nL/min for 120 minutes, and sprayed into the MS. The mobile phase for chromatography consisted of 0.1% formic acid in water, and 84% acetonitrile and 0.1% formic acid in water. The parameters for QExactive plus were as follows: positive mode; mass range of 350–2000 m/z with a resolution of 70.000 (MS1) or 200–2000 m/z with a resolution of 17.500 (MS2); spray voltage, 1.4 kV; ion transfer tube temperature, 250°C; collision gas, helium; collision gas pressure, 1.3 mTorr; normalized collision energy for MS/MS, 30%; and isolation of +2, +3, +4 monoisotopic precursors with a width of 2.0 Da. TOP10 data-dependent acquisition with activated dynamic exclusion (repeat count 1, duration 100 ms) was applied.
Identification and quantification of the CSF proteome
For protein identification, Proteome Discoverer (version 2.1.0.81, Thermo Fisher Scientific, Bremen, Germany) and the MS Amanda search engine were considered. MS/MS-spectra were searched against the UniProtKB/Swiss-Prot database (human; including isoforms; date 04/12/2016). The following search parameters were applied: enzyme, trypsin (full); maximum missed cleavage sites, 2; precursor mass tolerance, 10 ppm; fragment mass tolerance, 0.01 Da; and oxidation of M and deamidation of N and Q as dynamic modifications. The false discovery rate was set to 1% (p ≤ 0.01). In the case of identified peptides shared among two proteins, these were combined and reported as one protein group. Label-free quantification was performed with Progenesis QI for Proteomics (Version 2.0, Nonlinear Dynamics, Waters Corporation, Newcastle upon Tyne, UK).
For detailed calculation of protein concentrations, we first determined the endogenous concentration of CD14 using isotopically labeled reference peptides (FPAIQNLALR* and LTVGAAQVPAQLLVGALR*). Next, we applied the Hi-N method of Progenesis QI for Proteomics (using the two most abundant peptides) to determine the concentrations of proteins in CSF. Briefly, the Hi-N method considers all peptides of a protein for quantification. If more than two peptides are available, Hi-N includes the two most abundant unique (non-conflicting) peptides to calculate the protein concentration. CD14 with a known concentration of 7.9 fmol was applied as single point calibrator, and the signal intensities of the proteins were adjusted to the CD14 concentration for detailed quantification.
Statistical analysis of protein concentrations
Statistical analysis of protein concentrations from clinical routine analysis (CSF/serum ratios of albumin, IgG, IgA and IgM) was carried out with the Wilcoxon-Mann-Whitney-Test. As a test for blood contamination due to BBB dysfunction, correlation analysis was performed between the concentrations of candidate proteins and CSF albumin (both determined by LC-MS); Pearson correlation was used without any grouping, and p-values were adjusted by Benjamini-Hochberg correction. Proteins with a significance threshold of p ≤ 0.001 and a positive fold-change (higher abundance in the PCNSL group) were considered as contamination from BBB dysfunction. The stability of protein abundance was determined as described [49]. Therefore, protein abundances were logarithmized (log10), and the mean difference between the groups (‘mean control’ – ‘mean PCNSL’) was calculated for each protein. Afterwards, the ‘two one-sided test’ for equivalence was applied to assess the similarity of the groups (H1: |‘mean control’ – ‘mean PCNSL’| < equivalence range (ɛ)) [49, 50]. The three-fold standard deviation (ɛ = 0.3) was used as the equivalence range. Proteins with significant p-values (p ≤ 0.05) were marked as unchanged. For the determination of differentially abundant proteins, LC-MS data were statistically analyzed by analysis of variance, with a p-value ≤0.05 and a fold-change > 2.0 as the threshold. Furthermore, only proteins present in 66% of the samples per group and with a minimum of two unique peptides were considered for further analysis.
Bioinformatic analysis of the CSF proteome
Tissue-specific enrichment analyses were carried out with DAVID and the UniProt tissue annotation database (UP_tissue, date 02/09/2016). The entire identified CSF proteome was used as a background list. Bonferroni correction of p-values was applied, and enrichments with p-values > 0.05 were discarded.
Network enrichment analysis was performed with Cytoscape environment and a ClueGo plug-in [51]. The following parameters were applied for network analyses: Ontology source, Gene Ontology biological processes (date 02/09/2016); statistical test, enrichment/depletion (two-sided hypergeometric test); p-value correction, Benjamini-Hochberg; p-value restriction, p ≤ 0.01; Gene Ontology (GO) term restriction, ‘min level = 3’, ‘max level = 12’; number of genes, 3; min percentage = 4.0; use GO term fusion; use GO term grouping; GO term connection restriction, kappa score ≥ 0.4; sharing group percentage, 50. The entire identified CSF proteome was used as a reference set.
Abbreviations
ADAM, a disintegrin and metalloproteinase; BBB, blood-brain barrier; CNS, central nervous system; CSF, cerebrospinal fluid; DLBCL, diffuse large B-cell lymphoma; ESI, electrospray ionization; Extra., extracellular; GO, Gene Ontology; GPI, Glycosylphosphatidylinositol; GPNMB, transmembrane glycoprotein NMB; HLA, human leukocyte antigen; LC-MS, liquid chromatography mass spectrometry; MHC, major histocompatibility complex; MMP, matrix metalloproteinase; MS, mass spectrometry; PCNSL, primary central nervous system lymphoma; Sec., secreted; SP, signal peptide; TFA, trifluoroacetic acid; TIMP, tissue inhibitor of metalloproteinase; TM, transmembrane.
ACKNOWLEDGMENTS AND FUNDING
This study was supported by Deutsche Forschungsgemeinschaft grants STU 486/5-1 (to K.S, LZ) and SCHL 268/4-1 (to U.S.); CRC 1208, project Z01 (to K.S. and D.W.-L.), Wilhelm Sander-Stiftung (Project-Nr. 2011.092.2., to MD and MMR). The authors thank Dr. Linlin Zhao for the help and support in bioinformatic analysis.
CONFLICTS OF INTEREST
The authors declare that they have no conflicts of interest.
REFERENCES
1. Korfel A, Schlegel U. Diagnosis and treatment of primary CNS lymphoma. Nature Rev Neurol. 2013; 9:317–327.
2. Deckert M, Engert A, Bruck W, Ferreri AJ, Finke J, Illerhaus G, Klapper W, Korfel A, Kuppers R, Maarouf M, Montesinos-Rongen M, Paulus W, Schlegel U, et al. Modern concepts in the biology, diagnosis, differential diagnosis and treatment of primary central nervous system lymphoma. Leukemia. 2011; 25:1797–1807.
3. Hochberg FH, Miller DC. Primary central nervous system lymphoma. J Neurosurgery. 1988; 68:835–853.
4. Batchelor T, Loeffler JS. Primary CNS lymphoma. J Clin Oncol. 2006; 24:1281–1288.
5. Baraniskin A, Schroers R. Modern cerebrospinal fluid analyses for the diagnosis of diffuse large B-cell lymphoma of the CNS. CNS Oncol. 2014; 3:77–85.
6. Reiber H. Proteins in cerebrospinal fluid and blood: barriers, CSF flow rate and source-related dynamics. Restor Neurol Neurosci. 2003; 21:79–96.
7. Rabouille C, Malhotra V, Nickel W. Diversity in unconventional protein secretion. J Cell Sc. 2012; 125:5251–5255.
8. Hayashida K, Bartlett AH, Chen Y, Park PW. Molecular and cellular mechanisms of ectodomain shedding. Anatom Rec. 2010; 293:925–937.
9. van der Pol E, Boing AN, Harrison P, Sturk A, Nieuwland R. Classification, functions, and clinical relevance of extracellular vesicles. Pharmacol Rev. 2012; 64:676–705.
10. Schutzer SE, Liu T, Natelson BH, Angel TE, Schepmoes AA, Purvine SO, Hixson KK, Lipton MS, Camp DG, Coyle PK, Smith RD, Bergquist J. Establishing the proteome of normal human cerebrospinal fluid. PLoS One. 2010; 5:e10980.
11. Guldbrandsen A, Vethe H, Farag Y, Oveland E, Garberg H, Berle M, Myhr KM, Opsahl JA, Barsnes H, Berven FS. In-depth characterization of the cerebrospinal fluid (CSF) proteome displayed through the CSF proteome resource (CSF-PR). Mol Cell Proteom. 2014; 13:3152–3163.
12. Zhang Y, Guo Z, Zou L, Yang Y, Zhang L, Ji N, Shao C, Sun W, Wang Y. A comprehensive map and functional annotation of the normal human cerebrospinal fluid proteome. J Proteom. 2015; 119:90–99.
13. Begcevic I, Brinc D, Drabovich AP, Batruch I, Diamandis EP. Identification of brain-enriched proteins in the cerebrospinal fluid proteome by LC-MS/MS profiling and mining of the Human Protein Atlas. Clin Proteom. 2016; 13:11.
14. Geyer PE, Kulak NA, Pichler G, Holdt LM, Teupser D, Mann M. Plasma Proteome Profiling to Assess Human Health and Disease. Cell Sys. 2016; 2:185–195.
15. Kersten MJ, Evers LM, Dellemijn PL, van den Berg H, Portegies P, Hintzen RQ, van Lier RA, von dem Borne AE, van Oers RH. Elevation of cerebrospinal fluid soluble CD27 levels in patients with meningeal localization of lymphoid malignancies. Blood. 1996; 87:1985–1989.
16. Nacinovic-Duletic A, Stifter S, Dvornik S, Skunca Z, Jonjic N. Correlation of serum IL-6, IL-8 and IL-10 levels with clinicopathological features and prognosis in patients with diffuse large B-cell lymphoma. Int J Lab Hematol. 2008; 30:230–239.
17. Fischer L, Korfel A, Pfeiffer S, Kiewe P, Volk HD, Cakiroglu H, Widmann T, Thiel E. CXCL13 and CXCL12 in central nervous system lymphoma patients. Clin Cancer Res. 2009; 15:5968–5973.
18. Sasayama T, Nakamizo S, Nishihara M, Kawamura A, Tanaka H, Mizukawa K, Miyake S, Taniguchi M, Hosoda K, Kohmura E. Cerebrospinal fluid interleukin-10 is a potentially useful biomarker in immunocompetent primary central nervous system lymphoma (PCNSL). Neuro Oncol. 2012; 14:368–380.
19. Rubenstein JL, Wong VS, Kadoch C, Gao HX, Barajas R, Chen L, Josephson SA, Scott B, Douglas V, Maiti M, Kaplan LD, Treseler PA, Cha S, et al. CXCL13 plus interleukin 10 is highly specific for the diagnosis of CNS lymphoma. Blood. 2013; 121:4740–4748.
20. Viaccoz A, Ducray F, Tholance Y, Barcelos GK, Thomas-Maisonneuve L, Ghesquieres H, Meyronet D, Quadrio I, Cartalat-Carel S, Louis-Tisserand G, Jouanneau E, Guyotat J, Honnorat J, et al. CSF neopterin level as a diagnostic marker in primary central nervous system lymphoma. Neuro Oncol. 2015; 17:1497–1503.
21. Murase S, Saio M, Takenaka K, Shinoda J, Nishimura Y, Sakai N, Takami T. Increased levels of CSF soluble CD27 in patients with primary central nervous system lymphoma. Cancer Lett. 1998; 132:181–186.
22. Murase S, Saio M, Andoh H, Takenaka K, Shinoda J, Nishimura Y, Sakai N, Takami T. Diagnostic utility of CSF soluble CD27 for primary central nervous system lymphoma in immunocompetent patients. Neurol Res. 2000; 22:434–442.
23. Reiber H, Felgenhauer K. Protein transfer at the blood cerebrospinal fluid barrier and the quantitation of the humoral immune response within the central nervous system. Clin Chim Acta. 1987; 163:319–328.
24. Montesinos-Rongen M, Brunn A, Bentink S, Basso K, Lim WK, Klapper W, Schaller C, Reifenberger G, Rubenstein J, Wiestler OD, Spang R, Dalla-Favera R, Siebert R, et al. Gene expression profiling suggests primary central nervous system lymphomas to be derived from a late germinal center B cell. Leukemia. 2008; 22:400–405.
25. Ernerudh J, Olsson T, Berlin G, von Schenck H. Cerebrospinal fluid immunoglobulins and beta 2-microglobulin in lymphoproliferative and other neoplastic diseases of the central nervous system. Arch Neurol. 1987; 44:915–920.
26. Plotkin SR, Batchelor TT. Primary nervous-system lymphoma. Lancet Oncol. 2001; 2:354–365.
27. Zetterberg H, Andreasson U, Blennow K. CSF antithrombin III and disruption of the blood-brain barrier. J Clin Oncol. 2009; 27:2302–2303; author reply 2303–2304.
28. Tibbling G, Link H, Ohman S. Principles of albumin and IgG analyses in neurological disorders. I. Establishment of reference values. Scand J Clin Lab Invest. 1977; 37:385–390.
29. Roy S, Josephson SA, Fridlyand J, Karch J, Kadoch C, Karrim J, Damon L, Treseler P, Kunwar S, Shuman MA, Jones T, Becker CH, Schulman H, et al. Protein biomarker identification in the CSF of patients with CNS lymphoma. J Clin Oncol. 2008; 26:96–105.
30. Schlondorff J, Blobel CP. Metalloprotease-disintegrins: modular proteins capable of promoting cell-cell interactions and triggering signals by protein-ectodomain shedding. J Cell Sci. 1999; 112:3603–3617.
31. Jones K, Vari F, Keane C, Crooks P, Nourse JP, Seymour LA, Gottlieb D, Ritchie D, Gill D, Gandhi MK. Serum CD163 and TARC as disease response biomarkers in classical Hodgkin lymphoma. Clin Cancer Res. 2013; 19:731–742.
32. Buechler C, Ritter M, Orso E, Langmann T, Klucken J, Schmitz G. Regulation of scavenger receptor CD163 expression in human monocytes and macrophages by pro- and antiinflammatory stimuli. J Leuko Biol. 2000; 67:97–103.
33. Droste A, Sorg C, Hogger P. Shedding of CD163, a novel regulatory mechanism for a member of the scavenger receptor cysteine-rich family. Biochem Biophys Res Comm. 1999; 256:110–113.
34. Etzerodt A, Rasmussen MR, Svendsen P, Chalaris A, Schwarz J, Galea I, Moller HJ, Moestrup SK. Structural basis for inflammation-driven shedding of CD163 ectodomain and tumor necrosis factor-alpha in macrophages. J Biol Chem. 2014; 289:778–788.
35. Matsushita N, Kashiwagi M, Wait R, Nagayoshi R, Nakamura M, Matsuda T, Hogger P, Guyre PM, Nagase H, Matsuyama T. Elevated levels of soluble CD163 in sera and fluids from rheumatoid arthritis patients and inhibition of the shedding of CD163 by TIMP-3. Clin Exp Immunol. 2002; 130:156–161.
36. Weterman MA, Ajubi N, van Dinter IM, Degen WG, van Muijen GN, Ruitter DJ, Bloemers HP. nmb, a novel gene, is expressed in low-metastatic human melanoma cell lines and xenografts. Int J Cancer. 1995; 60:73–81.
37. Tse KF, Jeffers M, Pollack VA, McCabe DA, Shadish ML, Khramtsov NV, Hackett CS, Shenoy SG, Kuang B, Boldog FL, MacDougall JR, Rastelli L, Herrmann J, et al. CR011, a fully human monoclonal antibody-auristatin E conjugate, for the treatment of melanoma. Clin Cancer Res. 2006; 12:1373–1382.
38. Kuan CT, Wakiya K, Dowell JM, Herndon JE 2nd, Reardon DA, Graner MW, Riggins GJ, Wikstrand CJ, Bigner DD. Glycoprotein nonmetastatic melanoma protein B, a potential molecular therapeutic target in patients with glioblastoma multiforme. Clin Cancer Res. 2006; 12:1970–1982.
39. Rose AA, Pepin F, Russo C, Abou Khalil JE, Hallett M, Siegel PM. Osteoactivin promotes breast cancer metastasis to bone. Mol Cancer Res. 2007; 5:1001–1014.
40. Rose AA, Annis MG, Dong Z, Pepin F, Hallett M, Park M, Siegel PM. ADAM10 releases a soluble form of the GPNMB/Osteoactivin extracellular domain with angiogenic properties. PLoS One. 2010; 5:e12093.
41. Furochi H, Tamura S, Mameoka M, Yamada C, Ogawa T, Hirasaka K, Okumura Y, Imagawa T, Oguri S, Ishidoh K, Kishi K, Higashiyama S, Nikawa T. Osteoactivin fragments produced by ectodomain shedding induce MMP-3 expression via ERK pathway in mouse NIH-3T3 fibroblasts. FEBS Lett. 2007; 581:5743–5750.
42. Conant K, Wang Y, Szklarczyk A, Dudak A, Mattson MP, Lim ST. Matrix metalloproteinase-dependent shedding of intercellular adhesion molecule-5 occurs with long-term potentiation. Neuroscience. 2010; 166:508–521.
43. Niedringhaus M, Chen X, Dzakpasu R, Conant K. MMPs and soluble ICAM-5 increase neuronal excitability within in vitro networks of hippocampal neurons. PLoS One. 2012; 7:e42631.
44. Nijland M, Jansen A, Doorduijn JK, Enting RH, Bromberg JE, Kluin-Nelemans HC. Treatment of initial parenchymal central nervous system involvement in systemic aggressive B-cell lymphoma. Leukemia Lymphoma. 2017:1–6.
45. Kendrick S, Rimsza LM, Scott DW, Slack GW, Farinha P, Tan KL, Persky D, Puvvada S, Connors JM, Sehn L, Gascoyne RD, Schmelz M. Aberrant cytoplasmic expression of MHCII confers worse progression free survival in diffuse large B-cell lymphoma. Virchows Archiv. 2017; 470:113–117.
46. Bosshart H, Jarrett RF. Deficient major histocompatibility complex class II antigen presentation in a subset of Hodgkin’s disease tumor cells. Blood. 1998; 92:2252–2259.
47. Carey BW, Kim DY, Kovacs DM. Presenilin/gamma-secretase and alpha-secretase-like peptidases cleave human MHC Class I proteins. Biochem J. 2007; 401:121–127.
48. Raposo G, Nijman HW, Stoorvogel W, Liejendekker R, Harding CV, Melief CJ, Geuze HJ. B lymphocytes secrete antigen-presenting vesicles. J Exp Med. 1996; 183:1161–1172.
49. Peterson LN, Eva KW, Rusticus SA, Lovato CY. The readiness for clerkship survey: can self-assessment data be used to evaluate program effectiveness? Academic Med. 2012; 87:1355–1360.
50. Robinson AP, Duursma RA, Marshall JD. A regression-based equivalence test for model validation: shifting the burden of proof. Tree Physiol. 2005; 25:903–913.
51. Bindea G, Mlecnik B, Hackl H, Charoentong P, Tosolini M, Kirilovsky A, Fridman WH, Pages F, Trajanoski Z, Galon J. ClueGO: a Cytoscape plug-in to decipher functionally grouped gene ontology and pathway annotation networks. Bioinformatics. 2009; 25:1091–1093.