
INTRODUCTION
Chromosomal aberrations leading to gene fusions occur frequently in cancer cells. Gene fusions play critical roles in tumorigenesis, can aid in cancer diagnosis, and serve as therapeutic targets. The recurrence of a fusion gene and retention of important functional domains (FDs) are important factors in assessing whether it plays an oncogenic role and has clinical relevance. Driver fusion genes typically retain functional domains (e.g., kinase domains or DNA-binding domains) [1, 2]. In our previous study [3], we performed a comprehensive analysis of kinase fusion genes that retain kinase domains and discovered features commonly present in recurrent kinase fusion genes. In this study, we performed a systematic annotation of transcription factor fusion genes (TFFGs), aiming to identify driver transcription factors (TFs) and fusion genes (FGs) across 13 major cancer types. TFFGs may enhance the activity or result in loss of function of a TF and its target genes. TFFGs are also known for their dominant-negative effects, supported by the observation of a higher frequency of DNA binding domains than transcriptional activation domains [4].
One classical example of a TFFG is the fusion between the promyelocytic leukemia (PML) gene and the transcription factor, retinoic acid receptor alpha (RARA), which is seen in 95% of acute promyelocytic leukemia (APL) patients. The PML-RARA fusion protein retains domains of the RARA protein that allows binding to retinoic acid response elements (RARE) and dimerization with the retinoid X receptor protein (RXRA) [5]. This causes reduced transcriptional activation and inhibition of myeloid differentiation leading to APL [6]. Recently, the National Comprehensive Cancer Network guidelines specified arsenic trioxide and all-trans retinoic acid (ATRA) as front-line treatments for APL [7]. Pharmaceutical companies have developed many kinase inhibitors targeting kinase fusion genes; however, few drugs target TFFGs, despite their pivotal role in enhancing or reducing the functionality of a TF and its target genes. Therefore, a comprehensive analysis of TFFGs in cancer will likely provide important insights into the mechanism of tumorigenesis of TFFGs and uncover new candidate therapeutic targets.
In this study, we performed a pan-cancer annotation of 386 TFFGs including 232 TFs. Investigating FD retention led to the identification of 148 TFFGs including 109 TFs. To prioritize the potential clinical relevance of these TFs, we introduced a new scoring system, a Major Active Isofusion Index (MAII) (see Materials and Methods). We also examined binding-related FD retention and identified 83 TFFGs that retained binding related FDs, including 67 TFs. We created a prioritized TFFG network using both of the MAII scores and the observed frequency. To assess the influence of TFFGs on their target genes, we examined the differentially expressed target genes (DETGs) of the 12 TFFGs with FD retention, which occurred in at least two samples of the same cancer type. In our comparison of the expression levels of target genes in fusion-positive with fusion-negative samples in each cancer type, we found four TFFGs (PML-RARA, RUNX1-RUNX1T1, TMPRSS2-ERG, and SFPQ-TFE3) that had 50 DETGs. Interestingly, these four TFFGs had the highest MAII scores. Furthermore, these DETGs were involved in the biological processes relevant to tumorigenesis in each cancer type. Interestingly, a DETG that encodes the plasminogen activator, urokinase (PLAU), a known biomarker for tumor invasion, was consistently upregulated in samples positive for the four TFFGs (PML-RARA, RUNX1-RUNX1T1, TMPRSS2-ERG, and SFPQ-TFE3). Our further analysis indicated that 21 of the 50 DETGs were candidate drug targets. In addition, 14 of the 21 candidate targets occurred in samples with the RUNX1-RUNX1T1 fusion. Finally, we constructed an AML-specific DETG network based on gene expression changes in samples with PML-RARA or RUNX1-RUNX1T1 fusions.
RESULTS
Transcription factor fusion genes (TFFGs) retaining functional domains
The concept of FD (i.e., fusion domain) retention in TFFGs is shown in Figure 1A. When a TFFG retains its functional domain (e.g., DNA-binding domain), the resulting fusion protein likely binds to the promoter region and the distal-regulatory region of its target genes, and regulates downstream gene expression. In contrast, if a TFFG does not retain the DNA binding domain, it would not bind to its target genes, leading to the partial or complete loss of gene expression. Figure 2A shows our pipeline for identifying driver TFs and TFFGs. From ~8,000 fusion genes available in the TCGA Fusion Gene Data Portal [8], we selected 2,782 in-frame fusion genes. By overlapping these fusion genes with the TFs that had target gene information from the TRANSFAC [9] and TRRUST [10] databases, we obtained 386 fusion genes (FGs) involving 232 TFs. We next investigated the retention of FDs by translating the fusion transcripts into amino acid sequences and searching for the presence of 34 protein features from UniProt (see Materials and Methods). This FD retention analysis resulted in 81, 59, and 10 TFFGs that had 52, 51, and 19 TFs at the 5’-position (5’-TFFGs), the 3’-position (3’-TFFGs), or both 5’- and 3’-positions (5’-3’-TFFGs), respectively (Supplementary Table 1). To investigate which protein domains were more frequently retained in TFFGs, we compared the retention status of all UniProt’s protein features in the TFFGs, with those in all other FGs (non-TFFGs). As shown in Figure 3, TFFGs significantly retained 14 out of 34 protein features at a relatively higher frequency than non-TFFGs; these domains are: ‘site’, ‘compositional bias’, ‘cross-link’, ‘zinc finger’, ‘region’, ‘DNA binding’, ‘mutagenesis’, ‘modified residue’, ‘motif’, ‘helix’, ‘turn’, ‘initiator methionine’, ‘metal binding’, and ‘beta strand’. This result is consistent with previous reports that TF fusion proteins often contain several different protein domains such as a DNA-binding domains, domains that act in homo or hetero-dimerization, and domains that interact with chromatin remodeling components such as co-repressor molecules [11]. Among these FD-retained TFFGs, we focused on the domains with TF activity such as ‘calcium binding’, ‘DNA binding’, ‘domain’, ‘metal binding’, ‘motif’, ‘nucleotide binding’, and ‘zinc finger’. After applying this filter, we identified 37, 36, and 10 TFFGs including 24, 30, and 19 TFs for 5’-TFFGs, 3’-TFFGs, and 5’- 3’-TFFGs, respectively. Only 12 TFFGs retained their FDs in at least two samples (Figure 2B). Of those, TMPRSS2-ERG was the most frequent (21 samples retained TF domains among 59 TMPRSS2-ERG positive samples in PRAD). Three TFFGs had a transcription factor as both (the 5’ and 3’) partners. We annotated these as 5’-3’-TFFGs. They are PML-RARA (15 samples in AML), RUNX1-RUNX1T1 (seven samples in AML), and SFPQ-TFE3 (three samples in KIRC).
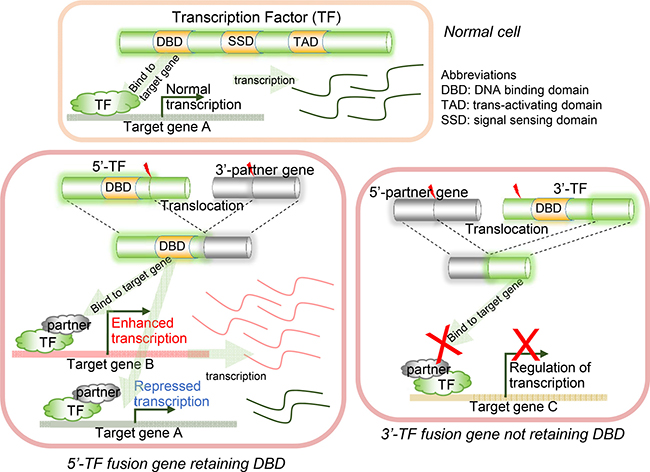
Figure 1: Illustration of DNA binding domain (DBD) retention in transcription factor fusion genes (TFFGs). The activities of retained domains of transcription factors (TFs) involved in fusion genes may subsequently affect the expression of their target genes.
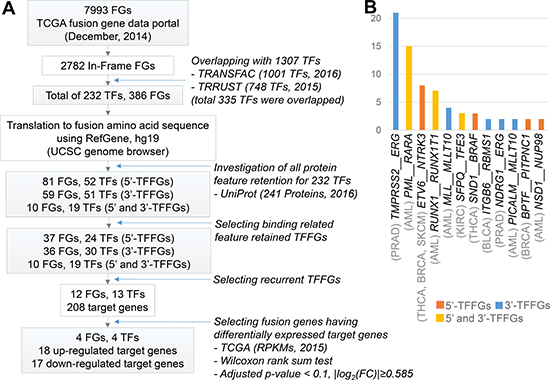
Figure 2: Pan-cancer analysis of TFFGs. (A) Workflow of the functional domain retention analysis of TFFGs in pan-cancer. (B) Recurrent TFFGs retaining functional domains in TCGA fusion gene dataset. Y-axis represents the number of samples.
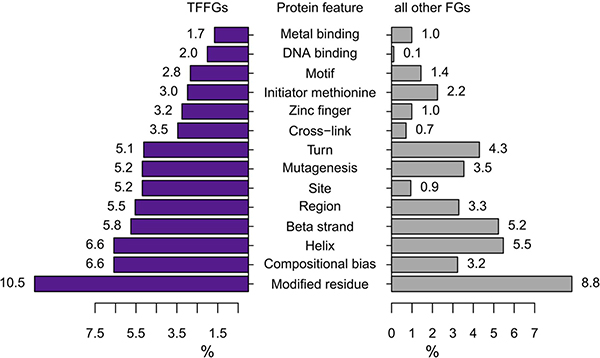
Figure 3: Comparison of retained protein features between TFFGs and all other FGs. For each protein feature (Y-axis), the relative proportion of samples involving TFFGs and other FGs is represented. After calculating the p-value via a hypergeometric test, 14 protein features were selected as significantly enriched features in TFFGs, not in all other FGs (p-value < 0.001).
Identification of “effective” TFs in FGs by Major Active Isofusion Index (MAII) score and network analysis
We hypothesized those TFs that are involved in fusion genes in multiple cancer types, have breakpoints in multiple locations, or have multiple partner genes, would have a critical role in tumorigenesis. Therefore, we used a method we previously developed [12] to quantify the recurrence of these fusion genes. We utilized three characteristics of TFFGs: (1) the number of partner genes of each TF, (2) the number of break points in each TF, (3) and the number of cancer types associated with each TF fusion. Using these factors, we defined a Degree-of-Frequency (DoF) score (Table 1). By applying DoF scores to TFs involved in gene fusions, we found 15 potentially effective TFs including EP300, ERG, ETV6, FOXK2, KDM4B, KDM5A, MLLT10, NCOR2, NFIX, NSD1, RFX4, SMARCA4, SND1, TBL1XR1, and VAV1. However, in the TFFGs, the DoF scores did not always follow the observed frequency of the number of samples with fusion genes. To resolve this issue, we introduced another measurement of TF effectiveness in gene fusions: the Major Active Isofusion Index (MAII). The MAII is calculated by dividing the number of observed samples with a particular TFFG by its DoF score (Table 1). Here, an isofusion refers to one particular gene fusion combination, with one particular partner gene and one particular break point, in one particular cancer type. This new score (MAII) can give us the average frequency of each TF for each possible isofusion. A TF with a high MAII score is considered “effective” (i.e., highly recurrent) in cancer fusion genes. To make the MAII scores (ranging from 0.11 to 15) more intuitive, we transformed MAII scores of <1 to reversed negative values (tMAII). We generated a box plot of tMAII values for the TFs involved in TFFGs that retained binding domains, except those who had a DoF of ‘1.0’ in one sample (Figure 4A). A TF with a high tMAII score (i.e., >1) means that it has a high frequency of occurrence per one isofusion. We refer to these as “effective TFs in fusion genes” (eTFinFGs). The eTFinFGs include RARA, RUNX1T1, PML, ERG, RUNX1, SFPQ, and TFE3. Alternatively, if a TF has a tMAII score of less than ‘-1.0’ and a DoF score of more than ‘8’, which is the threshold of high frequent gene fusions in our previous study, it indicates that the TF has a higher chance of generating FGs in different cancer types, with multiple partner genes, and multiple break points than observed. We named these as “possibly effective TFs in fusion genes” (peTFinFGs). We found 34 peTFinFGs including NSD1, KDM4B, SND1, SMARCA4, NCOR2, KDM5A, VAV1, TBL1XR1, EP300, MLLT10, ETV6, LIN28A, and 22 additional genes (Table 1). Next, we created a TFFG network based on both observed frequency and tMAII scores of 83 TFFGs that retained functional domains related TF activity, including 67 TFs, (Figure 4B). In this figure, we excluded the TFFGs with a tMAII of ‘1.0’, represented by the non-highlighted cases. Using a gradient color scale of the nodes, which represents the tMAII score of each TF, we can assess the “effective TFs” and “possibly effective TFs” in pan-cancer fusion genes at a glance.
Table 1: The Major Active Isofusion Index (MAII)
Gene |
# cancer types |
# partners |
# break points |
DoF score |
Obs. frequency |
MAII |
tMAII |
|---|---|---|---|---|---|---|---|
RARA |
1 |
1 |
1 |
1 |
15 |
15 |
15 |
RUNX1T1 |
1 |
1 |
1 |
1 |
7 |
7 |
7 |
PML |
1 |
1 |
3 |
3 |
16 |
5.33 |
5.33 |
ERG |
2 |
3 |
2 |
12 |
24 |
2 |
2 |
RUNX1 |
1 |
2 |
2 |
4 |
8 |
2 |
2 |
SFPQ |
1 |
1 |
2 |
2 |
3 |
1.5 |
1.5 |
TFE3 |
1 |
1 |
2 |
2 |
3 |
1.5 |
1.5 |
TRPS1 |
1 |
4 |
1 |
4 |
4 |
1 |
1 |
YY1 |
1 |
2 |
1 |
2 |
2 |
1 |
1 |
BPTF |
1 |
2 |
3 |
6 |
3 |
0.5 |
-2 |
GLIS3 |
2 |
2 |
1 |
4 |
2 |
0.5 |
-2 |
IKBKB |
1 |
2 |
2 |
4 |
2 |
0.5 |
-2 |
KAT6A |
2 |
2 |
1 |
4 |
2 |
0.5 |
-2 |
NCOR1 |
1 |
2 |
2 |
4 |
2 |
0.5 |
-2 |
RFWD2 |
1 |
2 |
2 |
4 |
2 |
0.5 |
-2 |
WWP1 |
1 |
2 |
2 |
4 |
2 |
0.5 |
-2 |
BRIP1 |
1 |
2 |
2 |
4 |
2 |
0.5 |
-2 |
ARID1B |
2 |
2 |
1 |
4 |
2 |
0.5 |
-2 |
RBMS1 |
2 |
1 |
2 |
4 |
2 |
0.5 |
-2 |
PAX8 |
1 |
2 |
2 |
4 |
2 |
0.5 |
-2 |
UHRF1 |
2 |
2 |
1 |
4 |
2 |
0.5 |
-2 |
ZNF143 |
2 |
2 |
1 |
4 |
2 |
0.5 |
-2 |
FOXK2 |
1 |
3 |
3 |
9 |
3 |
0.33 |
-3 |
NFIX |
2 |
3 |
2 |
12 |
3 |
0.25 |
-4 |
RFX4 |
2 |
3 |
2 |
12 |
3 |
0.25 |
-4 |
CLOCK |
2 |
2 |
2 |
8 |
2 |
0.25 |
-4 |
KHSRP |
2 |
2 |
2 |
8 |
2 |
0.25 |
-4 |
NFIB |
2 |
2 |
2 |
8 |
2 |
0.25 |
-4 |
TRIM24 |
2 |
2 |
2 |
8 |
2 |
0.25 |
-4 |
YAP1 |
2 |
2 |
2 |
8 |
2 |
0.25 |
-4 |
ZBTB48 |
2 |
2 |
2 |
8 |
2 |
0.25 |
-4 |
FGFR1 |
2 |
2 |
2 |
8 |
2 |
0.25 |
-4 |
LIN28A |
2 |
2 |
2 |
8 |
2 |
0.25 |
-4 |
ETV6 |
3 |
3 |
5 |
45 |
10 |
0.22 |
-4.5 |
MLLT10 |
2 |
3 |
6 |
36 |
7 |
0.19 |
-5.14 |
EP300 |
2 |
3 |
3 |
18 |
3 |
0.17 |
-6 |
TBL1XR1 |
2 |
3 |
3 |
18 |
3 |
0.17 |
-6 |
VAV1 |
2 |
3 |
3 |
18 |
3 |
0.17 |
-6 |
KDM5A |
2 |
4 |
4 |
32 |
4 |
0.13 |
-8 |
NCOR2 |
3 |
3 |
3 |
27 |
3 |
0.11 |
-9 |
SMARCA4 |
3 |
3 |
3 |
27 |
3 |
0.11 |
-9 |
SND1 |
4 |
4 |
5 |
80 |
6 |
0.08 |
-13.33 |
KDM4B |
5 |
5 |
3 |
75 |
5 |
0.07 |
-15 |
NSD1 |
4 |
5 |
5 |
100 |
6 |
0.06 |
-16.67 |
Obs: observed.
DoF score = (# cancer types) × (# partners) × (# break points).
MAII = (# obs. frequency) / (DoF score).
tMAII: transformed MAII. tMAII = if MAII < 1, then do (MAII)-1 × (−1).
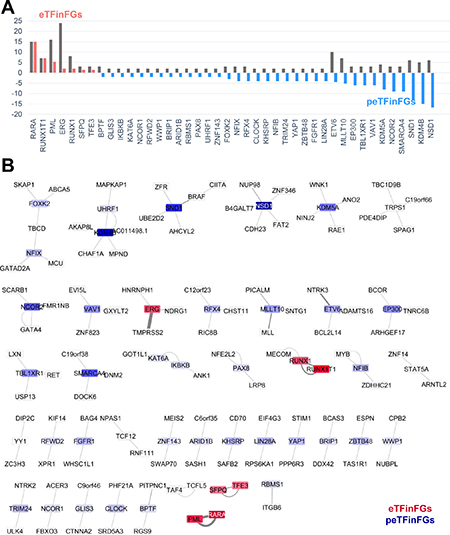
Figure 4: TFFG network providing clinical relevance. (A) TFs ranked by tMAII score. “eTFinFGs” refers to effective transcription factor gene fusions (TFFGs) based on high tMAII score. “peTFinFGs” refers to potentially effective TFFGs based on low tMAII score, that is, those have higher possible combination of gene fusion than the observed frequency. (B) TFFG network showing TFFG pairs retaining binding domain features. In this network, we show only TFFGs including the TFs that formed fusion genes with multiple partners. Nodes in red refer to TFs with a high tMAII score and nodes in blue refer to the TFs with a low tMAII score.
Analysis of differentially expressed target gene (DETG) identified consistent up-regulation of PLAU in four TFFGs
Focusing on the 12 TFFGs with FD retention in at least two samples, we explored the DETGs between fusion-positive and fusion-negative samples within each cancer type (Supplementary Table 2). The aim of this analysis is to understand the oncogenic role of each TFFG in each cancer type. Analysis of DETGs (Wilcoxon rank sum test followed by multiple test correction using Benjamini-Hochberg’s method [13], |log2(Fold change, FC)| ≥ 0.585 and adjusted p-value (i.e., q-value) < 0.1) revealed 50 DETGs from four gene fusions (PML-RARA, RUNX1-RUNX1T1, TMPRSS2-ERG, and SFPQ-TFE3). Remarkably, these four gene fusions were those with the highest tMAII scores as shown in Table 1. This supports the reliability of the tMAII scoring system in determining the biological relevance of gene fusions. A schematic representation of gene fusions and their important domains is shown in Figure 5A. Figure 5B shows the different expression levels of DETGs between fusion-positive and fusion-negative samples. In our results, a DETG is especially interesting. This DETG is the plasminogen activator, urokinase (PLAU, synonym: uPA), whose expression was significantly increased in AML samples with PML-RARA or RUNX1-RUNX1T1 fusion genes. PLAU is also known to be induced by ERG, which is upregulated in 21 samples harboring the TMPRSS2-ERG fusion. Furthermore, in the SFPQ-TFE3 positive samples, there was consistent downregulation of the serine proteinase inhibitor SERPINE1, an inhibitor of tissue plasminogen activator (tPA) and urokinase (uPA). PLAU encodes a secreted serine protease that converts plasminogen to plasmin, promoting fibrinolysis and degradation of the extracellular matrix, facilitating cancer growth and metastasis [14, 15]. As a cancer biomarker, PLAU plays a role in tumor invasion [16]. Recently, a positive correlation was reported between the expression level of plasminogen activator inhibitor (PAI)-1 and poor prognosis in patients with ovarian cancer [17]. These results suggest that pharmacological combination therapies using PAI-1 and urokinase inhibitors may be potentially effective in patients with PML-RARA, RUNX1-RUNX1T1, or TMPRSS2-ERG fusion genes.
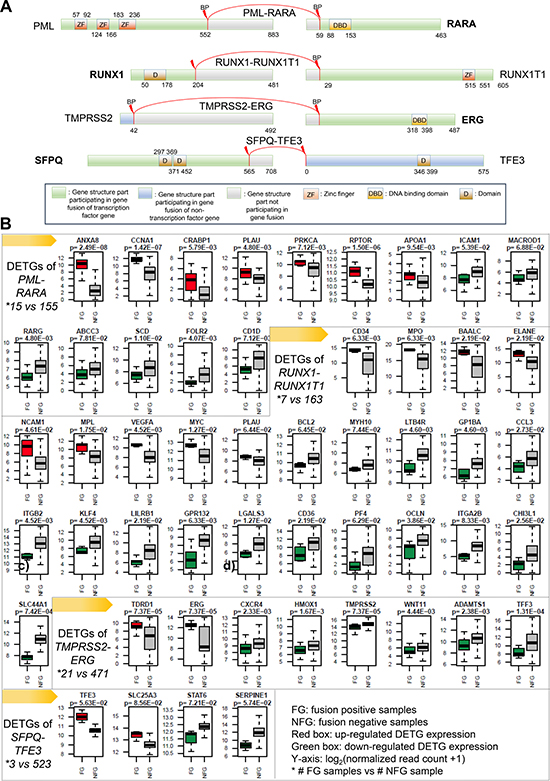
Figure 5: Four recurrent TFFGs and differentially expressed target genes (DETGs) in the samples with fusion genes (FGs) versus without FGs (NFG). (A) Fusion protein structure of the four recurrent TFFGs with highest MAII score. (B) DETGs of the four TFFGs in A. Y-axis: mRNA expression level measured by log2 (read count +1). Significantly up- and down-regulated genes in the FG samples were labeled in red and green, respectively.
PML-RARA
An in-frame PML-RARA fusion was present in 15 of the 170 TCGA AML samples. This fusion gene retains the ‘zinc finger’ and ‘DNA binding domain’ in the 5’-partner gene (PML), and 3’-partner gene (RARA), respectively (Figure 5A). PML retains two different zinc finger (ZnF) domains; ZnF RING-type (PROSITE id: PS50089) and ZnF B-box-type (PROSITE id: PS50119). The ZnF B-box-type domain is considered essential but not sufficient to localize the PML protein in a punctate pattern in interphase nuclei. The DNA binding domain of RARA is of the nuclear hormone receptor type (PROSITE id: PS51030). RARA is a ligand-activated transcription factor that regulates gene expression by interacting with specific DNA sequences upstream of its target genes [18]. The up-regulated target genes of PML, through comparing 15 fusion-positive samples versus 155 fusion-negative samples, were ANXA8, APOA1, CCNA1, CRABP1, PLAU, PRKCA, and RPTOR. The overexpression of ANXA8 has been reported as associated with AML [19]. APOA1 is known as a biomarker for leukemia aggressiveness [20]. CCNA1 is reported to have increased expression in AML too [21]. The down-regulated target genes were ABCC3, CD1D, FOLR2, ICAM1, MACROD1, RARG, and SCD. The major mechanism of tumorigenesis of the PML-RARA gene fusion is the disruption of the retinoic acid (RA) signaling pathway and arrest of myeloid differentiation [22]. In agreement with this mechanism, RARG is involved in the retinoic acid signaling and myeloid cell differentiation and SCD is involved in fatty acid metabolic process [23]. ABCC3, FOLR2, ICAM1, and MACROD1 are involved in lymphocyte regulation, modification, and migration [23].
RUNX1-RUNX1T1
Eight percent of AML and 20% of M2-type AML have this gene fusion, which is now recognized by the World Health Organization (WHO) classification system as a specific subtype of AML [24, 25]. The RUNX1-RUNX1T1 fusion gene is known to promote self-renewal, disrupt terminal differentiation of myeloid cells, and increase DNA damage [26]. From a structural point of view, RUNX1 retains the Runt domain (PROSITE id: PRU0039) which confers DNA binding ability [18]. RUNX1T1 retains the zinc finger domain (MYND-type ZnF) (PROSITE id: PS50865). Proteins with MYND-type ZnF domains are known to include the transcriptional co-repressor protein BS69 within them [27]. We compared seven RUNX1-RUNX1T1 fusion-positive samples with 163 fusion-negative samples through our DETG analysis. This analysis identified nine up-regulated genes (BAALC, CD34, ELANE, MPL, MPO, MYC, NCAM1, PLAU, and VEGFA). The high expression of BAALC and CD34 are known as a maker for prognostic risk stratification of AML and B lymphoblastic leukemia, respectively [28, 29]. MPL has been reported to be involved in initiating and maintaining RUNX1-RUNX1T1 positive AML [30]. Myeloperoxidase (MPO) has been associated with prognosis of AML patients [31]. Four of these up-regulated genes are oncogenes: MPL, MYL, PLAU, and VEGFA (Figure 6A). The oncogene VEGFA, encoding vascular endothelial growth factor A, induces proliferation and migration of vascular endothelial cells to promote angiogenesis in cancer [32]. Additionally, we found 16 down-regulated genes (BCL2, CCL3, CD36, CHI3L1, GP1BA, GPR132, ITGA2B, ITGB2, KLF4, LGALS3, LILRB1, LTB4R, MYH10, OCLN, PF4, and SLC44A1). CCL3, LGALS3, LILRB1, and PF4 are involved in ‘regulation of myeloid leukocyte differentiation’ pathway. BCL2, ITGB2, and OCLN are the genes involving in ‘leukocyte migration’. The other genes are involved in the pathways such as ‘regulation of angiogenesis’, ‘regulation of protein kinase activity’, and ‘regulation of macromolecule metabolic process’ [23]. This result is consistent with a study of transcriptional dysregulation mediated by RUNX1-RUNX1T1 in normal human progenitor cells and in AML [33]. While microarray data was used in this previous study, here we provided DETGs that are more accurate by using the digital expression levels from RNA-seq data.
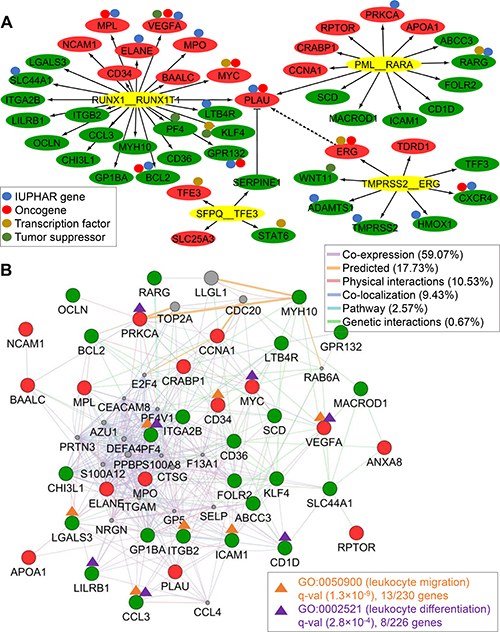
Figure 6: DETG network of four recurrent TFFGs and AML-specific network. (A) DETG network of the four TFFGs. The red and green nodes represent significantly up- and down-regulated target genes, respectively. The small circles above the nodes denote drug target gene (blue), oncogene (orange), transcription factor (purple), and tumor suppressor (green) from IUPHAR [54], Catalogue of Cancer Genes [55], TRANSFAC [9] and TRRUST [10], and TSGene2.0 [56], respectively. RUNX1-RUNX1T1 affects nine potentially targetable genes. (B) AML-specific TFFG network. Using 38 DETGs of the PML-RARA and RUNX1-RUNX1T1 gene fusions, we created a network by using the Gene MANIA app in Cytoscape. The orange and purple lines highlight genes involved in leukocyte migration and differentiation, respectively.
TMPRSS2-ERG
Chromosomal rearrangements between the androgen-regulated gene, TMPRSS2, and the oncogenic ETS transcription factor gene, ERG, occurs in approximately 30–50% of prostate cancers (PRAD) [34]. The 3’-partner gene, ERG, retains the ETS DNA-binding domain (PROSITE id: PS50061), which is enriched in positively-charged and aromatic residues and binds to purine-rich segments of DNA [35]. Out of the 59 TMPRSS2-ERG positive PRAD samples, 21 samples had an in-frame gene fusion retaining FDs. DETG analysis between 21 in-frame TMPRSS2-ERG positive samples versus 471 fusion-negative samples yielded only two up-regulated target genes: ERG and TDRD1. Previous transcriptional profiling studies have shown that ERG knockdown in TMPRSS2-ERG positive prostate cancer cell-lines leads to decreased expression of genes that are typically overexpressed in PRAD as compared to prostatic intraepithelial neoplasia [36]. Furthermore, ERG regulates the expression of target genes associated with cancer initiation and progression pathways such as DNA damage, inflammation, epigenetic control, regulation of differentiation, epithelial mesenchymal transition (EMT), cell proliferation and cell invasion [37]. Interestingly, one study demonstrated that ERG induced the expression of metalloproteinase and plasminogen activator pathway genes such as MMP3, PLAT, and PLAU [34]. The activation of the second up-regulated gene, tudor domain-containing protein1 (TDRD1), is known to be induced by ERG in prostate cancer cells harboring an ERG fusion [38–40].
To find DETGs that could drive cancer in the other 38 PRAD samples with TMPRSS2-ERG fusion not retaining functional domains, we performed DETG analysis by comparing 38 samples with out-of-frame fusion versus the 21 in-frame fusion samples (|log2(Fold change, FC)| ≥ 0.585, q-value < 0.2, and Supplementary Table 3). We found one amplified gene in the in-frame fusion samples, hydroxyprostaglandin dehydrogenase 15-(NAD) (HPGD), which was reported as a therapeutic target in prostate cancer due to its involvement in the arachidonic acid pathway with PLA2G7, EPHX2, and CYP4F8 [41]. HPGD was highly expressed in androgen receptor (AR)–overexpressing advanced tumors, as well as in metastatic prostate cancers.
SFPQ-TFE3
SFPQ retains two eukaryotic RNA recognition motif (RRM) domains (PROSITE id: PS50102). TFE3 retains Myc-type, basic helix-loop-helix domain (PROSITE id: PDOC00038). This ‘helix-loop-helix’ (HLH) domain mediates protein dimerization. Most proteins with HLH domains have an extra basic region of approximately 15 amino acid residues and this motif sequence binds to DNA [18]. A previous study on the molecular genetics of the TFE3 fusion gene in TCGA renal cell carcinoma samples suggested that it could contribute to carcinogenesis pathways such as TGFβ signaling, MET oncogene up-regulation, insulin signaling, Rb-dependent cell cycle, ETS oncogene regulation, FLCN/AMPK signaling, T-cell activation, and E-cadherin regulation [42]. The most widely accepted model for the oncogenic effects of the TFE3 gene fusions is the introduction of a constitutively active promoter leading to dysregulated TFE3 activity [16]. Accordingly, we found two up-regulated target genes (i.e., SLC25A3 and TFE3) in three fusion-positive samples compared to 523 fusion-negative samples.
AML specific DETG network
Out of the 50 DETGs identified in our study, 38 genes were from the two gene fusions (i.e., PML-RARA and RUNX1-RUNX1T1) in AML. Using these 38 DETGs as initiating genes in the GeneMANIA Cytoscape plugin [43] (see Materials and Methods, Figure 6B), we constructed an AML-specific DETG network. This network was composed of the 38 DETGs and the top 20 related genes suggested by GeneMANIA. After running GSEA for the nodes in this network (GeneMANIA, hypergeometric test followed by multiple test correction using Benjamini-Hochberg’s method [13], q-value < 0.05), we found that DETGs of the AML fusion-positive samples were significantly enriched in ‘leukocyte migration’ and ‘leukocyte differentiation’ pathways, suggesting that an abnormal regulation of leukocyte function plays a role in the development of AML.
Rare gene fusions with clinically relevant DETGs
Although we could not perform the differentially expressed gene test for TFFGs with retained FD occurring in only one sample, several examples are worth reporting. For example, Erb-b2 receptor tyrosine kinase 2 gene (ERBB2, synonym: HER2) was upregulated in one breast cancer sample containing the ATF7-SPATS2 fusion. The expression level of ERBB2 in the fusion-positive sample was about 25 times higher than in fusion-negative samples. Supplementary Figure 1 shows the comparison of ERBB2 expression across 113 BRCA samples with matched normal samples, HER2-negative samples, and HER2-positive samples, according to the PAM50 annotation information for clinical subtype classification of BRCA subtype [44]. The ATF7-SPATS2 fusion-positive sample had the highest expression level of ERBB2 among HER2-positive samples and all BRCA samples.
A high level of proto-oncogene receptor tyrosine kinase, KIT, expression is a well-known driver of proliferation of breast cancer cells. In this study, we identified up-regulation of KIT in MYB-NFIB positive samples. KIT expressed 15.4 times higher in BRCA samples with the MYB-NFIB than in fusion-negative samples. The RPKM value was 13,081 in the fusion-positive sample while the average of fusion-negative samples was 849. Based on this, we hypothesized that c-Kit inhibitors might be helpful in treating BRCA patients harboring the MYB-NFIB fusion. The MYB-NFIB fusion gene resulted in loss of the 3’-end of MYB, including several highly conserved target sites for microRNAs that negatively regulate MYB expression. Deletion of these miRNA target sites may disrupt the repression of MYB, leading to overexpression of MYB-NFIB fusion transcripts and subsequent transcriptional activation of critical MYB target genes associated with apoptosis, cell cycle control, cell growth/angiogenesis and cell adhesion [45]. Additionally, expression of GATA binding protein 3 (GATA3), which encodes a trans-acting T-cell specific transcription factor protein, was significantly decreased in the MYB-NFIB fusion sample (RPKM was 601 in fusion sample, 13072 on average in no-fusion tumor samples). GATA3 is one of the three genes (TP53, PIK3CA and GATA3) mutated in more than 10% of breast cancer samples [46].
DISCUSSION
This study presents a novel assessment scoring system to identify TFs and FGs that may act as potential cancer driver genes, through a comprehensive analysis of functional domain retention of 386 TFFGs and their affected target genes, across 13 major cancer types. The MAII score is influenced by the frequency at which a gene fusion occurs. Therefore, the score for fusions that do not occur at a high frequency, but might be biologically relevant, could be low. A high MAII score should be better in prioritizing fusions that may be biologically significant. However, due to the lack of an independent data set with an abundant number of fusion genes across multiple cancer types, we could not extensively validate our scoring system. Furthermore, gene fusions are not as common as many of the somatic point mutations. Therefore, the small number of recurrent samples is a reflection of the nature of fusion genes in cancer. Due to this nature, we acknowledge the limitations of the DETG analysis. Another limitation of our approach is focusing on gene fusions in which at least one of the partners retained an important functional domain. Although this approach is helpful for identifying potentially active gene fusions, it cannot identify gene fusions that disrupt or eliminate the activity of a transcription factor. Thus, more investigations will be needed for TFFGs that may contribute to carcinogenesis by such mechanisms.
ETV6-NTRK3, a known oncogenic fusion involving a TF (ETV6) and a tyrosine kinase receptor (NTRK3), was identified as one of the 12 TFFGs with retained FDs in at least two samples, had only one DETG, growth arrest specific 2 (GAS2). This might be related to the fact that ETV6 has a low MAII score, that is, the average frequency of the TF for each possible isofusion was not enough to show DETGs. In contrast, the four fusions that showed significant DETGs are those with the highest MAII scores. Furthermore, three out of four of the fusions are 5’-3’ TFFGs (PML-RARA, RUNX1-RUNX1T1 and SFPQ-TFE3), that is, both fusion partners are transcription factors. These findings suggest that TFFGs are more likely to alter gene expression when both partners in the fusion are transcription factor genes. It is worth noting several rare TFFGs found in our study. ERBB2 is known to be overexpressed in 18–20% of BRCA positive samples due to gene amplification [47, 48]. We identified the ATF7-SPATS2 fusion as a potential regulator of ERBB2 expression through ATF7’s action on the ERBB2 promoter, as shown by the higher ERBB2 expression in the fusion positive sample. Furthermore, the KIT tyrosine kinase gene showed up-regulated expression (15.4 times higher) in MYB-NFIB fusion positive BRCA. From these examples, we carefully suggest combinational therapy using kinase inhibitors to TFFG patients for better therapy.
Fusion genes are usually cancer type-specific, but TFs can be involved in multiple cancer types. Therefore, we performed a pan-cancer analysis for prioritizing TFs involved in FGs. To find the insights into the tumorigenic mechanism of TFFGs, we analyzed DETGs in each cancer type. Although the number of samples with TFFGs is small, chromosomal rearrangements involving TFs have clinical importance, due to their effects on the regulation of gene expression. This is the first study demonstrating druggable TFFGs with a systematic annotation of functional domains. A comprehensive understanding of TFFGs could help the development of new therapeutic strategies.
MATERIALS AND METHODS
Pan-cancer fusion gene data
The pan-cancer fusion gene dataset was obtained from the TCGA Fusion Gene Data Portal (http://54.84.12.177/PanCanFusV2, December 2014) [8]. A total of 7,993 fusion genes were curated in 13 cancer types from 4,366 primary tumor samples: bladder carcinoma (BLCA), breast carcinoma (BRCA), glioblastoma multiforme (GBM), head and neck squamous carcinoma (HNSC), kidney renal clear cell carcinoma (KIRC), acute myeloid leukemia (AML), low grade glioma (LGG), lung adenocarcinoma (LUAD), lung squamous cell carcinoma (LUSC), ovarian serous cystadenocarcinoma (OV), prostate adenocarcinoma (PRAD), skin cutaneous melanoma (SKCM), and thyroid cancer (THCA). For these fusion genes, the following information was collected: TCGA sample ID, fusion gene name and its two partner genes, fusion protein frame information, and exon junction break point information at the genomic level. We followed the definition of fusion gene direction for the 5’- and 3’-partner genes to this dataset.
Transcription factors and their target genes
TF-target pairs were downloaded from two databases, TRANSFAC (April, 2016) [9] and TRRUST (June 2015) [10]. From the downloaded data file of TRANSFAC, we obtained 1,001 human TFs with target gene information. TRRUST is a manually curated database of human transcriptional regulatory networks. From TRRUST, we obtained 748 human TFs with their target information. Combined, we had 1,307 human TFs with target gene information.
Annotation of protein domain retention
From ~8,000 fusion genes, we selected in-frame fusion genes using the annotations from the TCGA Fusion Gene Data Portal. Specifically, we selected fusion genes whose reading frames were not disrupted by the breakpoints; this resulted in 2,782 in-frame fusion genes. Next, we identified the TFs and their partner pairs using the 1,307 human TFs and their target gene dataset as described above. This process led to 232 TFs that involved 386 fusion events. To survey the TF domain retention, we downloaded the protein domain annotation information for the 232 TFs from the UniProt database, using the UniProtKB search module [49]. Because the protein domain information was based on amino acid sequence, we converted the genomic break point information into the amino acid sequence by considering all UniProt protein accessions, transcript isoforms, and multiple break points for each TF. To map protein domain loci onto the human genome, we used the RefSeq gene model of human reference genome (hg19) from the UCSC Genome Browser [50, 51]. For the fusion genes whose 5’-partner genes were TFs (5’-TFFGs), we considered the protein domain being retained in the fusion if the break points were at the 3’-end of the functional domain. Similarly, for the fusion genes whose 3’-partner genes were TFs (3’-TFFGs), we considered the protein domain being retained if the break points occurred at the 5’-end of the functional domain. We also examined functional domain retention in fusion genes whose 5’- and 3’- partners were both TFs (5’-3’-TFFGs). As a result, we obtained 148 TFFGs with 109 TFs. These were 81 5’-TFFGs, 59 3’-TFFGs, and 10 5’-3’-TFFGs involving 52, 51, and 19 unique TFs, respectively. All annotations that included protein domains on the amino acid sequence for each fusion gene are provided in Supplementary Table 1. To investigate the features of TF related domains, we used fusion genes retaining binding motifs such as ‘calcium binding’, ‘DNA binding’, ‘domain’, ‘metal binding’, ‘motif’, ‘nucleotide binding’, and ‘zinc finger’ for further research. As a result, we obtained 83 TFFGs involving 67 TFs.
Construction of the TFFG network
We built a TFFG network using gene fusion partner genes for which FDs with TF activity were retained. In this network, each node represents a partner gene or TF and each edge represents a gene fusion event. A gene fused with different partners would have multiple edges. A fusion gene can also occur in different cancer types, thus, we allowed multiple edges to represent the same fusion gene in different cancer types. We used Cytoscape (version 3.2.1) [52] for visualization and analysis of the network.
Annotation of differentially expressed target genes (DETGs) for recurrent TFFGs
Gene expression data were obtained from TCGA (November 2016). The normalized gene expression, measured in log2 transformed normalized read count plus 1 from RNASeqV2, was extracted using the R package TCGA-Assembler [53]. The Wilcoxon rank sum test in the R software package was used in the DETG analysis followed by Benjamini-Hochberg’s method [13] for multiple test correction. We defined significantly DETGs if they had |log2(FC)| ≥ 0.585 and q-value ≤ 0.1. For the expression levels of rare gene fusions, we used normalized gene expression measurements of reads per kilobase per million mapped reads (RPKM) from TCGA (January 5, 2015).
Construction of AML DETG network
There were 38 DETGs for the PML-RARA and RUNX1-RUNX1T1 fusion genes. We used these DETGs as initiating gene nodes to GeneMANIA Cytoscape plugin (version 3.4.1), a fast, in-silico, gene function prediction tool [43]. We used human network data including 20,531 genes and over 14 million interactions from the GeneMANIA database (version 2014-08-12-core). The algorithm for the construction of the network in GeneMANIA included interactions such as co-expression, co-localization, genetic interactions, signaling pathways, physical interactions, predicted interactions, and shared protein domains. Among all the network results, GeneMANIA added the top 20 related genes with up to 20 attributes using automatic weighting to the AML-specific DETG network.
ACKNOWLEDGMENTS
We thank the TCGA Fusion Gene Data Portal site for making the fusion gene data available for this study, and the members of Bioinformatics and Systems Medicine Laboratory (BSML) for valuable discussion.
CONFLICTS OF INTEREST
The authors declare no conflicts of interest.
FUNDING
This work was partially supported by National Institutes of Health grants (R01LM012806). Dr. Zhao was supported by Chair Professor for Precision Health funds. The funders had no role in the study design, data collection and analysis, decision to publish, or preparation of the manuscript.
REFERENCES
1. Kumar-Sinha C, Kalyana-Sundaram S, Chinnaiyan AM. Landscape of gene fusions in epithelial cancers: seq and ye shall find. Genome Med. 2015; 7:129. https://doi.org/10.1186/s13073-015-0252-1.
2. Wang Q, Xia J, Jia P, Pao W, Zhao Z. Application of next generation sequencing to human gene fusion detection: computational tools, features and perspectives. Brief Bioinform. 2013; 14:506–19. https://doi.org/10.1093/bib/bbs044.
3. Kim P, Jia P, Zhao Z. Kinase impact assessment in the landscape of fusion genes that retain kinase domains: a pan-cancer study. Brief Bioinform. 2016; e-pub ahead of print 24 December 2016; doi:10.1093/bib/bbw127. https://doi.org/10.1093/bib/bbw127.
4. Suzuki S, Sasaki S, Morita H, Oki Y, Turiya D, Ito T, Misawa H, Ishizuka K, Nakamura H. The role of the amino-terminal domain in the interaction of unliganded peroxisome proliferator-activated receptor gamma-2 with nuclear receptor co-repressor. J Mol Endocrinol. 2010; 45:133–45. https://doi.org/10.1677/JME-10-0007.
5. De Braekeleer E, Douet-Guilbert N, De Braekeleer M. RARA fusion genes in acute promyelocytic leukemia: a review. Expert Rev Hematol. 2014; 7:347–57. https://doi.org/10.1586/17474086.2014.903794.
6. Melnick A, Licht JD. Deconstructing a disease: RARalpha, its fusion partners, and their roles in the pathogenesis of acute promyelocytic leukemia. Blood. 1999; 93:3167–215.
7. Zhu HH, Qin YZ, Huang XJ. Resistance to arsenic therapy in acute promyelocytic leukemia. N Engl J Med. 2014; 370:1864–6. https://doi.org/10.1056/NEJMc1316382.
8. Yoshihara K, Wang Q, Torres-Garcia W, Zheng S, Vegesna R, Kim H, Verhaak RG. The landscape and therapeutic relevance of cancer-associated transcript fusions. Oncogene. 2015; 34:4845–54. https://doi.org/10.1038/onc.2014.406.
9. Matys V, Kel-Margoulis OV, Fricke E, Liebich I, Land S, Barre-Dirrie A, Reuter I, Chekmenev D, Krull M, Hornischer K, Voss N, Stegmaier P, Lewicki-Potapov B, et al. TRANSFAC and its module TRANSCompel: transcriptional gene regulation in eukaryotes. Nucleic Acids Res. 2006; 34:D108–10. https://doi.org/10.1093/nar/gkj143.
10. Han H, Shim H, Shin D, Shim JE, Ko Y, Shin J, Kim H, Cho A, Kim E, Lee T, Kim H, Kim K, Yang S, et al. TRRUST: a reference database of human transcriptional regulatory interactions. Sci Rep. 2015; 5:11432. https://doi.org/10.1038/srep11432.
11. Scandura JM, Boccuni P, Cammenga J, Nimer SD. Transcription factor fusions in acute leukemia: variations on a theme. Oncogene. 2002; 21:3422–44. https://doi.org/10.1038/sj.onc.1205315.
12. Kim P, Jia P, Zhao Z. Kinase impact assessment in the landscape of fusion genes that retain kinase domains: a pan-cancer study. Brief Bioinform. 2016. https://doi.org/10.1093/bib/bbw127.
13. Benjamini Y, Hochberg Y. Controlling the False Discovery Rate: A Practical and Powerful Approach to Multiple Testing. Journal of the Royal Statistical Society Series B (Methodological). 1995; 57:289–300.
14. Sudol M. From Rous sarcoma virus to plasminogen activator, src oncogene and cancer management. Oncogene. 2011; 30:3003–10. https://doi.org/10.1038/onc.2011.38.
15. Dong Z, Saliganan AD, Meng H, Nabha SM, Sabbota AL, Sheng S, Bonfil RD, Cher ML. Prostate cancer cell-derived urokinase-type plasminogen activator contributes to intraosseous tumor growth and bone turnover. Neoplasia. 2008; 10:439–49.
16. Schmitt M, Mengele K, Gkazepis A, Napieralski R, Magdolen V, Reuning U, Harbeck N. Assessment of Urokinase-Type Plasminogen Activator and Its Inhibitor PAI-1 in Breast Cancer Tissue: Historical Aspects and Future Prospects. Breast Care (Basel). 2008; 3:3–10. https://doi.org/10.1159/000151737.
17. Mashiko S, Kitatani K, Toyoshima M, Ichimura A, Dan T, Usui T, Ishibashi M, Shigeta S, Nagase S, Miyata T, Yaegashi N. Inhibition of plasminogen activator inhibitor-1 is a potential therapeutic strategy in ovarian cancer. Cancer Biol Ther. 2015; 16:253–60. https://doi.org/10.1080/15384047.2014.1001271.
18. Sigrist CJ, de Castro E, Cerutti L, Cuche BA, Hulo N, Bridge A, Bougueleret L, Xenarios I. New and continuing developments at PROSITE. Nucleic Acids Res. 2013; 41:D344–7. https://doi.org/10.1093/nar/gks1067.
19. O’Leary NA, Wright MW, Brister JR, Ciufo S, Haddad D, McVeigh R, Rajput B, Robbertse B, Smith-White B, Ako-Adjei D, Astashyn A, Badretdin A, Bao Y, et al. Reference sequence (RefSeq) database at NCBI: current status, taxonomic expansion, and functional annotation. Nucleic Acids Res. 2016; 44:D733–45. https://doi.org/10.1093/nar/gkv1189.
20. Braoudaki M, Lambrou GI, Vougas K, Karamolegou K, Tsangaris GT, Tzortzatou-Stathopoulou F. Protein biomarkers distinguish between high- and low-risk pediatric acute lymphoblastic leukemia in a tissue specific manner. J Hematol Oncol. 2013; 6:52. https://doi.org/10.1186/1756-8722-6-52.
21. Stirewalt DL, Meshinchi S, Kopecky KJ, Fan W, Pogosova-Agadjanyan EL, Engel JH, Cronk MR, Dorcy KS, McQuary AR, Hockenbery D, Wood B, Heimfeld S, Radich JP. Identification of genes with abnormal expression changes in acute myeloid leukemia. Genes Chromosomes Cancer. 2008; 47:8–20. https://doi.org/10.1002/gcc.20500.
22. Zhang JW, Wang JY, Chen SJ, Chen Z. Mechanisms of all-trans retinoic acid-induced differentiation of acute promyelocytic leukemia cells. J Biosci. 2000; 25:275–84.
23. Geer LY, Marchler-Bauer A, Geer RC, Han L, He J, He S, Liu C, Shi W, Bryant SH. The NCBI BioSystems database. Nucleic Acids Res. 2010; 38:D492–6. https://doi.org/10.1093/nar/gkp858.
24. Crispino JD. JAKing up AML1-ETO. Blood. 2012; 120:703–4. https://doi.org/10.1182/blood-2012-05-413104.
25. Sabattini E, Bacci F, Sagramoso C, Pileri SA. WHO classification of tumours of haematopoietic and lymphoid tissues in 2008: an overview. Pathologica. 2010; 102:83–7.
26. Goyama S, Mulloy JC. Molecular pathogenesis of core binding factor leukemia: current knowledge and future prospects. Int J Hematol. 2011; 94:126–33. https://doi.org/10.1007/s12185-011-0858-z.
27. Goodsell DS, Dutta S, Zardecki C, Voigt M, Berman HM, Burley SK. The RCSB PDB “Molecule of the Month”: Inspiring a Molecular View of Biology. PLoS Biol. 2015; 13:e1002140. https://doi.org/10.1371/journal.pbio.1002140.
28. Weber S, Alpermann T, Dicker F, Jeromin S, Nadarajah N, Eder C, Fasan A, Kohlmann A, Meggendorfer M, Haferlach C, Kern W, Haferlach T, Schnittger S. BAALC expression: a suitable marker for prognostic risk stratification and detection of residual disease in cytogenetically normal acute myeloid leukemia. Blood Cancer J. 2014; 4:e173. https://doi.org/10.1038/bcj.2013.71.
29. Jiang Z, Wu D, Lin S, Li P. CD34 and CD38 are prognostic biomarkers for acute B lymphoblastic leukemia. Biomark Res. 2016; 4:23. https://doi.org/10.1186/s40364-016-0080-5.
30. Pulikkan JA, Madera D, Xue L, Bradley P, Landrette SF, Kuo YH, Abbas S, Zhu LJ, Valk P, Castilla LH. Thrombopoietin/MPL participates in initiating and maintaining RUNX1-ETO acute myeloid leukemia via PI3K/AKT signaling. Blood. 2012; 120:868–79. https://doi.org/10.1182/blood-2012-03-414649.
31. Itonaga H, Imanishi D, Wong YF, Sato S, Ando K, Sawayama Y, Sasaki D, Tsuruda K, Hasegawa H, Imaizumi Y, Taguchi J, Tsushima H, Yoshida S, et al. Expression of myeloperoxidase in acute myeloid leukemia blasts mirrors the distinct DNA methylation pattern involving the downregulation of DNA methyltransferase DNMT3B. Leukemia. 2014; 28:1459–66. https://doi.org/10.1038/leu.2014.15.
32. Koch S, Claesson-Welsh L. Signal transduction by vascular endothelial growth factor receptors. Cold Spring Harb Perspect Med. 2012; 2:a006502. https://doi.org/10.1101/cshperspect.a006502.
33. Tonks A, Pearn L, Musson M, Gilkes A, Mills KI, Burnett AK, Darley RL. Transcriptional dysregulation mediated by RUNX1-RUNX1T1 in normal human progenitor cells and in acute myeloid leukaemia. Leukemia. 2007; 21:2495–505. https://doi.org/10.1038/sj.leu.2404961.
34. Yu J, Yu J, Mani RS, Cao Q, Brenner CJ, Cao X, Wang X, Wu L, Li J, Hu M, Gong Y, Cheng H, Laxman B, et al. An integrated network of androgen receptor, polycomb, and TMPRSS2-ERG gene fusions in prostate cancer progression. Cancer Cell. 2010; 17:443–54. https://doi.org/10.1016/j.ccr.2010.03.018.
35. Letunic I, Doerks T, Bork P. SMART: recent updates, new developments and status in 2015. Nucleic Acids Res. 2015; 43:D257–60. https://doi.org/10.1093/nar/gku949.
36. Park K, Dalton JT, Narayanan R, Barbieri CE, Hancock ML, Bostwick DG, Steiner MS, Rubin MA. TMPRSS2:ERG gene fusion predicts subsequent detection of prostate cancer in patients with high-grade prostatic intraepithelial neoplasia. J Clin Oncol. 2014; 32:206–11. https://doi.org/10.1200/JCO.2013.49.8386.
37. Tomlins SA, Laxman B, Varambally S, Cao X, Yu J, Helgeson BE, Cao Q, Prensner JR, Rubin MA, Shah RB, Mehra R, Chinnaiyan AM. Role of the TMPRSS2-ERG gene fusion in prostate cancer. Neoplasia. 2008; 10:177–88.
38. Kacprzyk LA, Laible M, Andrasiuk T, Brase JC, Borno ST, Falth M, Kuner R, Lehrach H, Schweiger MR, Sultmann H. ERG induces epigenetic activation of Tudor domain-containing protein 1 (TDRD1) in ERG rearrangement-positive prostate cancer. PLoS One. 2013; 8:e59976. https://doi.org/10.1371/journal.pone.0059976.
39. Boormans JL, Korsten H, Ziel-van der Made AJ, van Leenders GJ, de Vos CV, Jenster G, Trapman J. Identification of TDRD1 as a direct target gene of ERG in primary prostate cancer. Int J Cancer. 2013; 133:335–45. https://doi.org/10.1002/ijc.28025.
40. Xiao L, Lanz RB, Frolov A, Castro PD, Zhang Z, Dong B, Xue W, Jung SY, Lydon JP, Edwards DP, Mancini MA, Feng Q, Ittmann MM, et al. The Germ Cell Gene TDRD1 as an ERG Target Gene and a Novel Prostate Cancer Biomarker. Prostate. 2016; 76:1271–84. https://doi.org/10.1002/pros.23213.
41. Vainio P, Gupta S, Ketola K, Mirtti T, Mpindi JP, Kohonen P, Fey V, Perala M, Smit F, Verhaegh G, Schalken J, Alanen KA, Kallioniemi O, et al. Arachidonic acid pathway members PLA2G7, HPGD, EPHX2, and CYP4F8 identified as putative novel therapeutic targets in prostate cancer. Am J Pathol. 2011; 178:525–36. https://doi.org/10.1016/j.ajpath.2010.10.002.
42. Kauffman EC, Ricketts CJ, Rais-Bahrami S, Yang Y, Merino MJ, Bottaro DP, Srinivasan R, Linehan WM. Molecular genetics and cellular features of TFE3 and TFEB fusion kidney cancers. Nat Rev Urol. 2014; 11:465–75. https://doi.org/10.1038/nrurol.2014.162.
43. Montojo J, Zuberi K, Rodriguez H, Kazi F, Wright G, Donaldson SL, Morris Q, Bader GD. GeneMANIA Cytoscape plugin: fast gene function predictions on the desktop. Bioinformatics. 2010; 26:2927–8. https://doi.org/10.1093/bioinformatics/btq562.
44. Parker JS, Mullins M, Cheang MC, Leung S, Voduc D, Vickery T, Davies S, Fauron C, He X, Hu Z, Quackenbush JF, Stijleman IJ, Palazzo J, et al. Supervised risk predictor of breast cancer based on intrinsic subtypes. J Clin Oncol. 2009; 27:1160–7. https://doi.org/10.1200/JCO.2008.18.1370.
45. Stenman G, Andersson MK, Andren Y. New tricks from an old oncogene: gene fusion and copy number alterations of MYB in human cancer. Cell Cycle. 2010; 9:2986–95. https://doi.org/10.4161/cc.9.15.12515.
46. Cancer Genome Atlas N. Comprehensive molecular portraits of human breast tumours. Nature. 2012; 490:61–70. https://doi.org/10.1038/nature11412.
47. Owens MA, Horten BC, Da Silva MM. HER2 amplification ratios by fluorescence in situ hybridization and correlation with immunohistochemistry in a cohort of 6556 breast cancer tissues. Clin Breast Cancer. 2004; 5:63–9.
48. Hanker AB, Estrada MV, Bianchini G, Moore PD, Zhao J, Cheng F, Gianni L, Koch JP, Tyson DR, Sanchez V, Rexer BN, Sanders M, Zhao Z, et al. Extracellular matrix/integrin signaling promotes resistance to combined inhibition of HER2 and PI3K in HER2+ breast cancer. Cancer Res. 2017. https://doi.org/10.1158/0008-5472.CAN-16-2808.
49. Magrane M, Consortium U. UniProt Knowledgebase: a hub of integrated protein data. Database (Oxford). 2011; 2011:bar009. https://doi.org/10.1093/database/bar009.
50. Rosenbloom KR, Armstrong J, Barber GP, Casper J, Clawson H, Diekhans M, Dreszer TR, Fujita PA, Guruvadoo L, Haeussler M, Harte RA, Heitner S, Hickey G, et al. The UCSC Genome Browser database: 2015 update. Nucleic Acids Res. 2015; 43:D670–81. https://doi.org/10.1093/nar/gku1177.
51. Pruitt KD, Tatusova T, Maglott DR. NCBI reference sequences (RefSeq): a curated non-redundant sequence database of genomes, transcripts and proteins. Nucleic Acids Res. 2007; 35:D61–5. https://doi.org/10.1093/nar/gkl842.
52. Shannon P, Markiel A, Ozier O, Baliga NS, Wang JT, Ramage D, Amin N, Schwikowski B, Ideker T. Cytoscape: a software environment for integrated models of biomolecular interaction networks. Genome Res. 2003; 13:2498–504. https://doi.org/10.1101/gr.1239303.
53. Zhu Y, Qiu P, Ji Y. TCGA-assembler: open-source software for retrieving and processing TCGA data. Nat Methods. 2014; 11:599–600. https://doi.org/10.1038/nmeth.2956.
54. Southan C, Sharman JL, Benson HE, Faccenda E, Pawson AJ, Alexander SP, Buneman OP, Davenport AP, McGrath JC, Peters JA, Spedding M, Catterall WA, Fabbro D, et al. The IUPHAR/BPS Guide to PHARMACOLOGY in 2016: towards curated quantitative interactions between 1300 protein targets and 6000 ligands. Nucleic Acids Res. 2016; 44:D1054–68. https://doi.org/10.1093/nar/gkv1037.
55. Cheng F, Jia P, Wang Q, Lin CC, Li WH, Zhao Z. Studying tumorigenesis through network evolution and somatic mutational perturbations in the cancer interactome. Mol Biol Evol. 2014; 31:2156–69. https://doi.org/10.1093/molbev/msu167.
56. Zhao M, Kim P, Mitra R, Zhao J, Zhao Z. TSGene 2.0: an updated literature-based knowledgebase for tumor suppressor genes. Nucleic Acids Res. 2016; 44:D1023–31. https://doi.org/10.1093/nar/gkv1268.