
INTRODUCTION
Hepatocellular carcinoma (HCC) is the fifth most common form of cancer [1]. Besides hepatitis C virus infection and non-alcoholic steatohepatitis (NASH) [2] environmental toxins such as nitrosamines e.g. diethylnitrosamines (DEN) potentially occurring in preserved meat, beer, and in tobacco smoke are relevant risk factors for HCC.
Glucosylceramide synthase (GCS) has been described to be significantly elevated in numerous human cancers including breast, cervix, colon [3], non-small cell lung cancer [4], and papillary thyroid carcinoma [5]. Its overexpression was correlated with chemoresistance [6-9]. Therefore, GCS has been considered as potential target to overcome chemoresistance in cancer cells [10-14]. In addition, GCS and its synthesis products i.e. glycosphingolipids (GSLs) may also contribute to carcinogenesis as suggested by in vitro cell culture experiments and xenograft cancer models [15-32]. The pathogenetic role of GCS in HCC in vivo however is largely unknown.
GCS catalyzes the first step of glucosylceramide (GlcCer) derived GSL synthesis and is encoded by the gene UDP-glucose ceramide glucosyltransferase (Ugcg) [33]. GSLs are constituents of all eukaryotic cell membranes predominantly located on the outer leaflet of the cellular plasma membrane. GSLs affect cell adhesion [34, 35] and are involved in intracellular protein and lipid trafficking [36-38]. GSLs also participate in signaling events [39]; they concentrate in lipid domains [40] and modify receptor activity of insulin- [41-43], leptin- [44], and epidermal growth factor receptor (EGFR) [45-47].
In the present study we have verified that glucosylceramide synthase was overexpressed in human HCC. With that information, we addressed the key issue of our investigations whether targeting of Ugcg in hepatocytes accompanied by GSL depletion would affect hepatic carcinogenesis in vivo. Cell culture is a common well defined tool to solve molecular cell biologic mechanisms, but, these data cannot automatically be translated to complex pathophysiological processes such as cancer development. Therefore, an endogenous tumor model in mice was used in combination with genetic deletion of Ugcg in hepatocytes [48]. We have found a significant delay in growth of diethylnitosamine (DEN)-induced liver carcinomas upon Ugcg deletion in vivo; this could be ascribed to delayed cytokinesis.
RESULTS
Gene array expression analysis indicates a significant increase of UGCG in human HCC as compared to non-tumorous liver or tissue of healthy organ donors
GCS has been described to be significantly elevated in numerous human cancers [3-5]. The expression of UGCG in human hepatocellular carcinoma has not been elucidated so far. For this end, two publicly available GEO HCC datasets with Affymetrix microarray measurements GSE14520 [49, 50] and GSE64041 [51] were used. Normalized and log2-transformed expression values of tumor, non-tumor and healthy donor samples were analyzed.
UGCG was significantly elevated comparing tumor versus non-tumorous tissue from the same patients in a paired microarray analysis (Figure 1A); n=233, for each group, p<0.001. In a second dataset normal donor liver tissues were compared with HCC. The expression of UGCG in tumorous tissue was in this data set again higher than in normal control liver tissue (Figure 1B); healthy-donor, n=5; tumor, n=60; p<0.001. Our results may imply that downregulation of the gene could affect cancer growth.
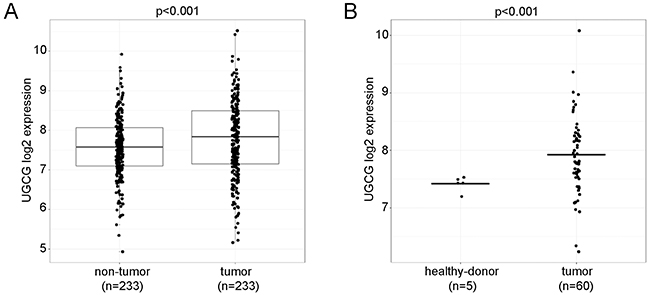
Figure 1: UGCG expression analysis in human HCC, non-tumor, and healthy donors. (A), UGCG was significantly elevated in tumor tissue as compared to non-tumorous tissue from the same patients (GEO: GSE14520, probe set 204881_s_at). (B), a comparison between HCC and normal donor liver tissues resulted also in an increase of UGCG in tumors (GEO: GSE64041). T-test was used to compare UGCG expression levels between tumor and normal samples, paired t-test to compare tumor and non-tumor samples.
Tumor growth in Ugcgf/fAlbCre liver is retarded
To investigate whether deletion of Ugcg would impact HCC development in mice, an endogenous cancer model was initiated in which Ugcg and consequently their synthesis products, i.e. glycosphingolipids, were eliminated cell-specifically in hepatocytes. GSL deficiency resulted in a delay of liver tumor initiation. All control mice (n=10) showed 2 to 3 tumors in mean with a diameter of 1-2 mm after 32 weeks (Figure 2A, 2B). In contrast, only 2 of 9 mice with liver specific GSL deficiency developed macroscopically detectable tumors (2 and 3 tumors, respectively) with a size of 1-2mm in diameter. All other Ugcgf/fAlbCre mice were macroscopically tumor free after eight months of tumor induction.
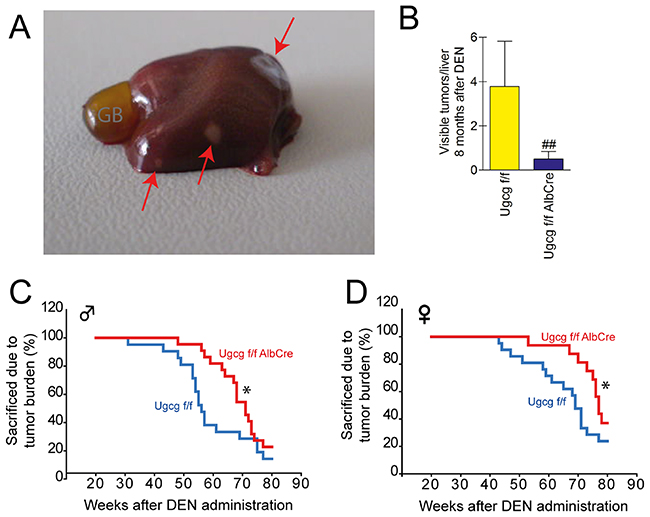
Figure 2: Ugcg-deficient mice show delayed DEN-induced life threatening tumor burden. (A), 8 months after DEN application small tumors of 1 to 2mm2 occurred as indicated by red arrows; GB, gall bladder. (B), lower numbers of macroscopically detectable tumors on the liver surface were seen in GSL-deficient liver (##, p<0.0075, Mann-Whitney test). (C and D), Ugcgf/f controls suffering from tumor burden in the liver had to be sacrificed earlier than mice with Ugcg deficiency; *, p= 0.023 per group and p=0.050 per gender, by Cox-regression; n= 18 to 21 per genotype and gender. The tumor development occurred gender specific ~15 weeks earlier in males (C) than in females (D).
We monitored a second group of animals up to 80 weeks after DEN treatment. Palpable tumors in liver of the Ugcgf/f control groups of both males and females (Figure 2C and 2D) occurred earlier than in Ugcg-deficient animals. More than 50% of control males had to be sacrificed due to critical tumor load already 55 weeks after DEN treatment (Figure 2C). In contrast more than half of male Ugcg-deficient mice lived approximately 70 weeks before they were seen with macroscopic tumor load. Similar differences were observed with females except that palpable tumor growth occurred later than in males (Figure 2D).
Numbers and size of hepatocellular dysplastic foci (AHF) are significantly lower in livers with Ugcg deficiency
We dissected the left liver lobe into 7 equal parts to elucidate number, area, and morphology of AHFs eight months after DEN treatment. Histologically, three types of dysplastic foci were identified, eosinophilic-, clear-cell-, and basophilic foci [52] (Figure 3A) with an increase in Ki67-positive cells (Figure 3B). The number of Ki67 positive cells and their distribution within foci were not different comparing control- versus Ugcg-depleted mice. Numbers of AHFs, significantly decreased in mutant as compared to control livers (0.80 ± 0.32 vs. 3.0 ± 0.33 per left lateral lobe; p<0.001) (Figure 3C). In addition, AHFs in liver of control mice displayed larger areas as compared to Ugcg-depleted livers (1437μm2 ± 209 vs. 807 ± 156μm2; Figure 3D).
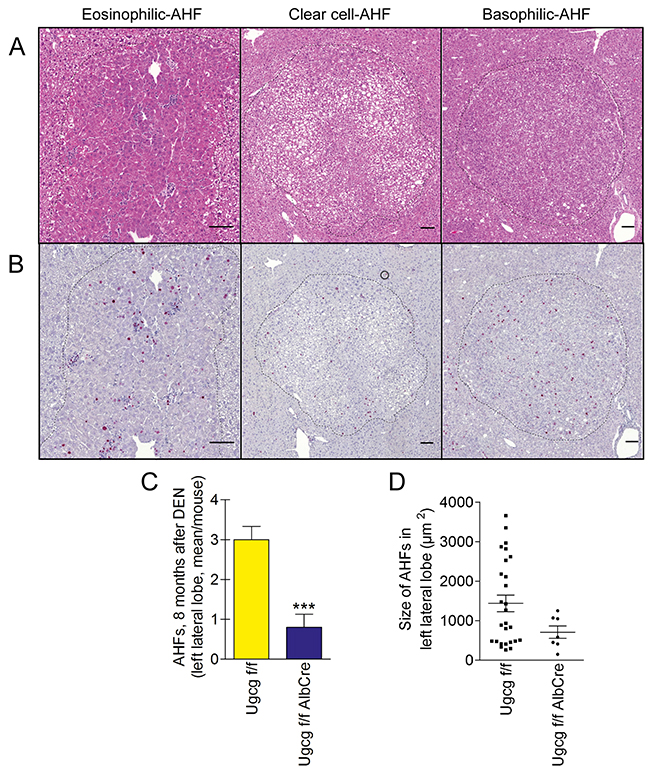
Figure 3: Number and area of dysplastic hepatocellular foci (AHFs) is reduced in Ugcg-deficient liver upon DEN treatment. (A and B), H&E staining (A) and Ki67 staining (B) of dysplastic foci; scale bars, 100μm. (C), significantly decreased number of AHFs was seen in mutant as compared to control livers. (D), the area of AHFs in cross sections of the left lateral lobe was smaller in Ugcg-deficient liver than in control liver (summary of all detected foci; note, differences were not significant (p<0.09) due to the high standard deviation in control group). Ugcgf/f controls n=10 and Ugcgf/fAlbCre n=9, males. Graphs show mean values ± SEM. Significance, ***, p < 0.001 using student’s two-tailed t-test.
In order to exclude that Ugcg deficient livers would respond more sensitive to DEN-injections than control livers, mice were sacrificed 24h and 96 hours after DEN application and the acute response was elucidated. Neither the area of necrosis nor the numbers of TUNEL-positive-, Ki67-positive-, and F4/80-positive cells, as well as the secretion of the liver enzyme ALT were changed upon Ugcg depletion (Supplementary Figure 1A-1E). Immunohistochemistry of the free radical species marker 3-nitrotyrosine (NTS) as well as the ER-stress marker KDEL did also not show differences comparing Ugcg-deficient- vs. control livers (Supplementary Figure 2). Our data suggested that Ugcg deficiency did not impact the DEN-induced acute liver damage.
Ugcg deficiency induces elevation of binucleation in hepatocytes
As an indicator for impaired cytokinesis in Ki67 positive hepatocytes both the number of cells with fused nuclei and with closely attached nuclei significantly increased in Ugcg-deficient normal liver and particularly in tumors (Figure 4A-4C).
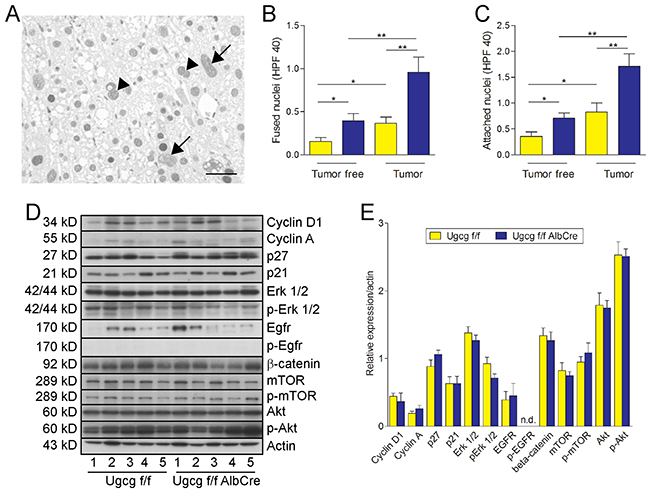
Figure 4: Ugcg deficiency causes increased numbers of multinucleated cells; cell cycle protein expression is not affected. (A), Ki67 staining of tumor liver of control mice. Arrows label fused nuclei and arrowheads attached nuclei. (B and C), Ugcg-depleted liver and corresponding tumors showed increased numbers of bi-(multi) nucleated cells as compared to controls. Both the numbers of fused nuclei (B) and attached nuclei (C) were significantly elevated in Ugcg-deficient tissue; n=13 to 14 per group, males; graphs show mean values ± SEM. Significances, *, p < 0.05; **, p < 0.01 using student’s two-tailed t-test. (D and E), the expression of proteins potentially involved in cell cycle regulation was not significantly altered in Ugcg-deficient tumor tissue although a slight increase of tumor suppressor p27 (p=0.15) and decreased expression of p-Erk 1,2 (p=0.09; n=5, each, males) was observed (D, western blot analysis; E, quantification); note the heterogeneity of the tumor samples.
The expression of proteins involved in cell cycle, such as cyclins and the MAP-kinase Erk were determined. Although there was a tendency for decreased Erk and p-Erk and elevated tumor suppressor p27 in Ugcg-depleted tumors, none of these proteins was significantly changed comparing tumor tissue of control- with Ugcg deficient liver tumors (Figure 4D and 4E, quantification). The mTOR/Akt signaling pathway was also not affected in Ugcg deficient liver tumors; there was a relevant variation in protein expression reflecting the heterogeneity of tumors.
Ugcg-deficient mice lack hepatocyte-typical GSLs
We extracted GSLs from normal liver and respective tumor tissue and analyzed for tumor-specific GSLs. Hepatocytes from normal liver of wildtype mice contained almost exclusively GlcCer and GM2 (Figure 5A) [48]. In Ugcgf/fAlbCre normal liver and tumor, the hepatocyte-specific ganglioside GM2 was completely absent (Figure 5A). GM3 appeared almost unchanged. This GSL is not present in isolated wildtype hepatocytes and thus GM3 together with residual amounts of GlcCer in total liver extracts can be attributed to cells, not targeted by the albumin-cre mediated Ugcg deletion such as endothelial-, Kupffer-, and T cells [48]. GlcCer and GM2 tended to have less steady state levels in tumor- as compared to normal liver in control animals (Figure 5C, 5D). In some of the liver tumor extracts additional minor bands have been detected in the acidic fraction of both control and Ugcg-deficient mice. The composition and migration of these compounds correlated with the pattern found in murine macrophages/DCs and or T cells which express predominantly the 0-series GSL derivatives GA1, GM1b, GD1α or GD1c [53, 54] (Figure 5A, 5B). To confirm the presence of these compounds, neutral GSLs were stained by immuno-TLC for presence of GA1 (Supplementary Figure 3A/3B). Also the neutral products from acidic GSLs after vibrio cholereae sialidase treatment on TLC and consecutive anti-GA1 staining resulted in a similar pattern as the one obtained from bone marrow derived dendritic cells/macrophages (Supplementary Figure 3C). One may therefore assume that those “tumor associated“ GSLs have been synthesized by immune cells.
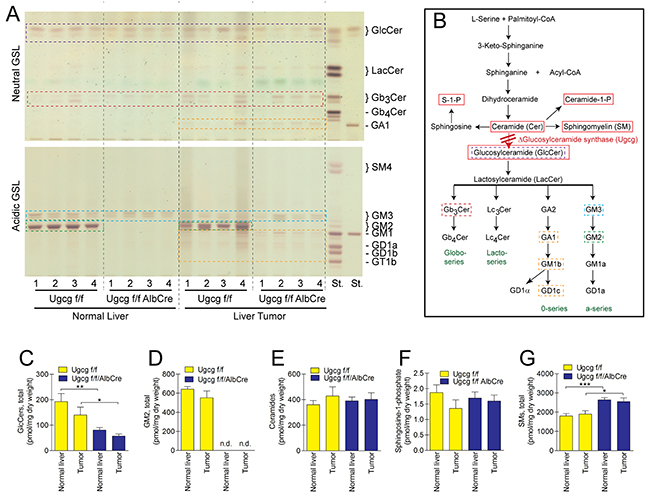
Figure 5: Ugcg deficiency results in deletion of GSLs in normal liver- and respective tumor tissue. (A), TLC of four normal- and corresponding tumor tissue samples of control and Ugcg-deficient liver. Tumor samples showed a slight variability of their GSL constitution. Some minor occurring bands (orange dotted boxes in liver tumor samples) could be verified belonging to the 0-series GSLs likely derived from liver infiltrating immune cells (see also Supplementary Figure 3). For designation of other liver-specific GSLs, compare dotted boxes in (A) with (B). (B), sphingolipid synthesis pathway. Sphingolipids measured by mass spectrometry are indicated by red boxes. (C and D), both glucosylceramide and GM2 were slightly but not significantly less synthesized in tumor tissue of control liver. Hepatocyte-specific ganglioside GM2 was absent in Ugcg-depleted normal liver and tumor (D); n.d., not detectable. Lipid extracts were further analyzed by mass spectrometry to investigate whether Ugcg deficiency would have caused a switch to other sphingolipid species than GSLs. (E and F), ceramides (E) which were described to have pro-apoptotic- (anti-cancer) and sphingosine-1-phosphate (F) with pro-proliferative properties (pro-cancer) were not essentially changed neither in tumor of Ugcgf/f liver nor in normal and tumor of GSL-depleted liver. (G) Only sphingomyelin was increased in the same molar range as GSLs decreased; n=8 per group, males; shown are mean values ± SEM. Significances, *, p < 0.05; **, p < 0.01; ***, p < 0.001 using student’s two-tailed t-test. For more detailed analysis, see Supplementary Figure 4.
Ugcg deficiency in livers leads to an increase of sphingomyelin
We quantified sphingolipids by LC-MS/MS to investigate the effect of Ugcg deficiency on sphingolipid synthesis pathways. Differences could not be detected in the ceramide- (Figure 5E, Supplementary Figure 4B) and sphingosine-1-phosphate (S1P) concentration (Figure 5F) of normal- and tumor livers of Ugcgf/fAlbCre mice as compared to the respective control tissue. Ceramide-1-phosphate expression was below the detection limit in all investigated samples. Only sphingomyelin increased in Ugcgf/fAlbCre normal liver and tumor (Figure 5G; Supplementary Figure 4C) to a similar extent in molar quantities as GSLs decreased (Figure 5C/5D; Supplementary Figure 4A) highlighting a compensatory interaction between the GSL- and the SM-synthesis pathway in hepatocytes and avoiding a suicidal increase in cellular ceramide concentrations.
Numbers of F4/80 and CD3 positive immune cells are unaltered in GSL-deficient liver
F4/80-positive cells (macrophages and Kupffer cells) accumulated at the tumor edges in Ugcgf/f control- and Ugcgf/fAlbCre liver (Figure 6A). Tumors itself were essentially devoid of F4/80-positive cells. CD3-positive T cells were much less in number than macrophages/Kupffer cells and similar in both groups (Figure 6B). Also, the total number of F4/80+ and CD3+ cells in normal liver were not significantly changed in control- as compared to Ugcg-deficient mice (Figure 6C/6D).
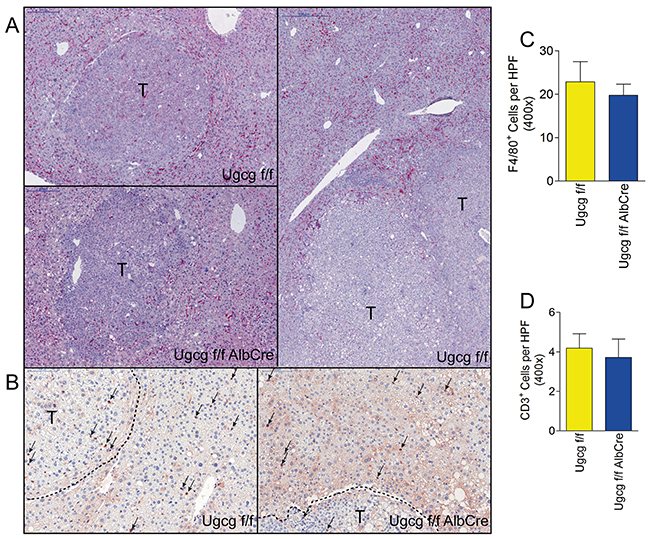
Figure 6: Numbers of F4/80 and CD3 positive immune cells are similar in control- and Ugcgf/fAlbCre liver. (A), F4/80+ cells (e.g. macrophages and Kupffer cells) were numerous at the edges of tumors (T). (B), CD3+ T cells (arrows) were much less in number than F4/80+ cells; scale bars, 100μm. (C and D), no differences in F4/80+- (C) and CD3+ (D) cell-numbers were detectable in Ugcgf/f vs. Ugcgf/fAlbCre liver ; n=13 to 14 per group, males.
Proliferation of hepatoma cells and growth of cell microspheres in culture decreases significantly upon Ugcg blockade
In order to place the in vivo findings into a cell biologic context, Ugcg-repressed Hepa 1-6 hepatoma cells were analyzed with regard to proliferation, morphology, and the growth of tumor microspheres. GSL synthesis in Hepa 1-6 cells was blocked by different approaches either with Genz 123346 or Miglustat (N-butyldeoxynojirimycin, NB-DNJ) both specific and potent inhibitors of the glucosylceramide synthase, with Ugcg siRNA or with Ugcg guide RNA applying the CRISPR/Cas system. Silencing of Ugcg by 1μM or 5μM Genz for 6 days or guide RNA transfection resulted in a drastic decrease of GSL expression (Figure 7A; Supplementary Figure 5A, 5B, 6C). Marked reduction of GSL expression by ≥50% was achieved upon Ugcg siRNA treatment for 6 days (Figure 7A; Supplementary Figure 5C) and by addition of Miglustat to the culture medium (Supplementary Figure 6E). Analogous to the data in liver of Ugcgf/fAlbCre mice, SM was elevated to an approximately equimolar extent as GSLs decreased (Figure 7B). Ceramide levels remained unchanged upon Ugcg silencing (Figure 7C). Downregulation of Ugcg did not change the structural integrity of Hepa 1-6 cells (Supplementary Figure 7A, 7B), as well as their mitochondrial membrane potential (Supplementary Figure 7C).
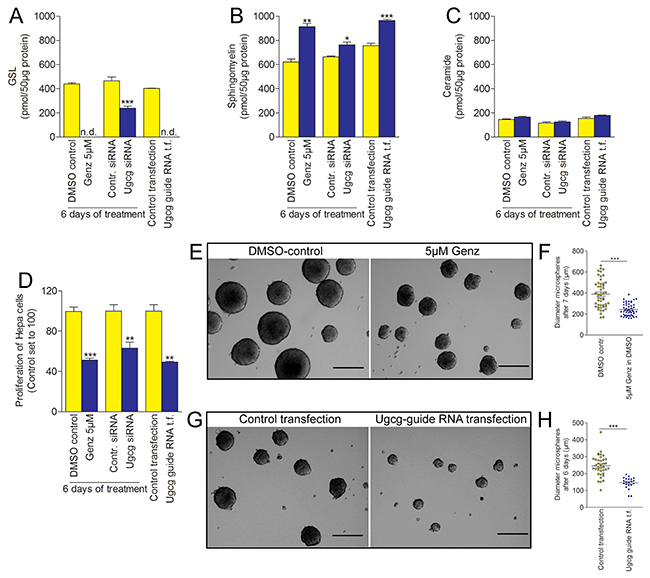
Figure 7: Proliferation of hepatoma cells and hepatoma microspheres is drastically reduced upon Ugcg repression. (A), the GSL synthesis in hepa cells either treated with Ugcg inhibitor Genz 123346 or transfected with Ugcg guide RNA was almost completely inhibited. Ugcg siRNA transfection resulted in ~50% decreased expression of GSLs (A, Supplementary Figure 5). (B), the decrease in GSLs was equalized by an approximately equimolar increase of sphingomyelin. (C), ceramide expression was principally low in these cells and not affected by the Ugcg depletion. (D), the proliferation of hepatoma cells significantly decreased upon GSL depletion. Shown are the results from one representative experiment out of at least three independent experiments, each; n=3 per group with similar results. (E-H), tumor-like microspheres cultivated from Hepa1-6 cells treated either with 5μM Genz (E and F, quantification) or transfected with Ugcg guide RNA (G and H, quantification) had a smaller diameter as control microspheres; graphs represent mean values ± SEM. Significances, *, p < 0.05; **, p < 0.01; ***, p < 0.001 using student’s two-tailed t-test, respectively; scale bars, 100μm.
We have observed significantly reduced proliferation by all ways of Ugcg silencing (Figure 7D; Supplementary Figure 6A and 6D). The strongest restriction in proliferation was achieved with 5μM Genz and Ugcg guide RNA (Figure 7D). A lower dose of Genz (Supplementary Figure 6A) as well as Ugcg siRNA (Figure 7D) and Miglustat (Supplementary Figure 6D) still resulted in significant reduced proliferation but were less effective.
Both Genz treatment and Ugcg guide RNA transfection significantly reduced growth of Hepa 1-6-derived tumor cell microspheres. Genz-treated microspheres displayed a mean diameter of 241.7μm ± 8.5μm as compared to DMSO control microspheres (389.7μm ± 19.3μm; Figure 7E and 7F, quantification; p<0.001) after 7 days. Ugcg guide RNA transfected microspheres developed a mean diameter of 144.9μm ± 7.3μm as compared to control microspheres (245.5 μm ± 10.3μm; Figure 7G and 7H, quantification; p<0.001) after 6 days of culture.
To investigate whether the proliferation of other hepatocellular carcinoma cells than Hepa 1-6 cells would be affected upon Ugcg silencing, human hepatocellular carcinoma derived HepG2 cells were treated with 1μM and 5μM Genz. The proliferation of HepG2 cells decreased also significantly (Supplementary Figure 6B) suggesting that Ugcg silencing indeed has a critical impact on cancer cell growth.
Hepatoma cells show delayed cytokinesis after Ugcg repression
By live cell imaging, we detected a delay in cell division of Hepa cells (Figure 8A and 8B, quantification). Almost half of the control cells finished cytokinesis within 18min (46.0% ± 2.2%) but only one third of the cells upon Ugcg silencing (35.5% ± 1.2%; p<0.001). A significant portion of Ugcg-repressed cells (38.3% ± 1.2%) needed 24min for finishing cytokinesis vs. 29.4% ± 1.9% of the control cells; p<0.01 (Figure 8B). When cells entered the G2-/M-phase of the cell cycle, GM2 staining increased significantly at the plasma membrane (Figure 8C), although the total GSL content in mitotic hepatoma cells did not change (Figure 8D).
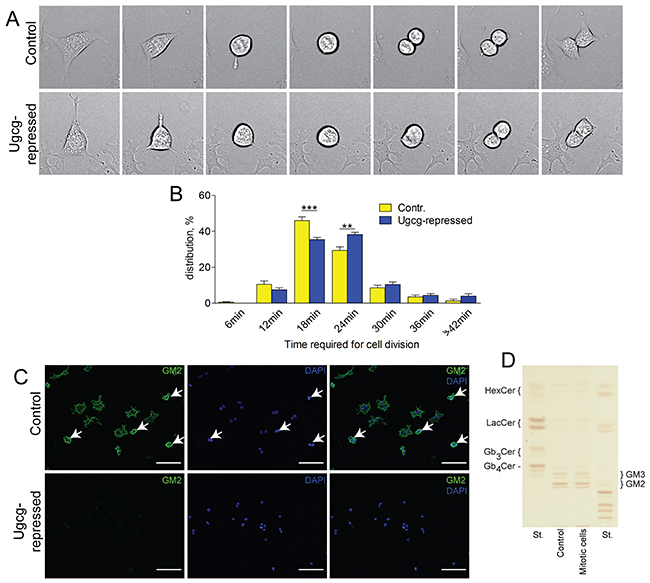
Figure 8: Ugcg silencing retards cytokinesis. (A and B), control and Ugcg-repressed Hepa 1-6 cells were monitored by live cell imaging for 24h. (A), Ugcg siRNA-treated cells needed more time for cell division than controls (images were taken every 6 minutes). (B), a majority of the control cells (46%) needed 18min to complete cell division, whereas Ugcg repression leads to a delay of cytokinesis and only 35.5% of treated cells completed cell division after 18min; n= 10 power fields with ~ 30 cell divisions, each; shown are mean values ± SEM. Significances, **, p < 0.01; ***, p < 0.001 using student’s two-tailed t-test. (C, upper panel), staining of GM2, the major GSL of Hepa cells, was moderate in rested cells, but showed a compact expression at the plasma membrane in dividing, rounded cells (mitotic cells are indicated by arrows). (D), an overall increase of GSLs in mitotic Hepa cells was not observed. (C, lower panel), GSL synthesis was significantly reduced by Genz treatment of the cells for 5 days; scale bars, 100μm.
GM2 staining could not be detected in the area where the mitotic spindle formed (Supplementary Figure 8A, inset). Both microtubule spindle formation and the actin cytoskeleton were not altered upon Ugcg depletion (Supplementary Figure 8A lower panel, Supplementary Figure 8B). Recycling endosomes, as indicated by Rab11 immunofluorescence, stained predominantly in the cytosol of both control and Ugcg-depleted cells (Supplementary Figure 8C) and consequently did not overlap with GSL expression which was predominantly restricted to the plasma membrane (Supplementary Figure 8C upper panel). Thus, GM2 did not seem to be involved in trafficking of recycling endosomes.
DISCUSSION
To investigate GSL-dependent effects on liver carcinogenesis, we induced liver tumors by application of DEN in mice with hepatocyte-specific genetic deletion of GCS [48]. These animals appeared particularly suitable to be used for studying cancer development in the absence of GSLs as they do not show any spontaneous phenotype [48]. Although other cancer models are available, in the present study we explicitly concentrated our focus on the DEN-model as epidemiological studies imply that nitrosamines may cause cancer [55]. DEN bioactivation due to its alkylation by cytochrome P450 induces DNA adducts which affect DNA replication [56] and trigger cancerogenic pathways, particularly in the liver.
Hepatocellular GSL deficiency did not prevent tumor development. However, we observed a critical impact of GCS expression as the development of endogenously induced hepatocellular carcinoma was significantly delayed under Ugcg deficiency. Since the expression of UGCG in human HCC is significantly upregulated, our data may have a direct translational impact to human HCC genesis and progression.
A disruption of GSL synthesis influences the flux in sphingolipid synthesis pathways. Increased expression of the GlcCer progenitor ceramide might have been expected; its accumulation has been associated with increased apoptosis [57]. However, ceramide levels were elevated neither in GSL-depleted liver nor in Ugcg-repressed hepatoma cells. As ultrastructural changes of organelles and alterations in mitochondrial function of Ugcg-repressed hepatoma cells could not be detected it is not probable that subcellular compartments had elevated ceramide concentrations. Instead, sphingomyelin increased to approximately the same molar extent as GSLs decreased. Further sphingolipid analysis revealed that sphingosine-1-phosphate, described as crucial for cell survival and migration [58, 59], similar as in human HCC [60], was not elevated but rather slightly downregulated in tumors of control mice; it consequently did not appear to contribute to the hepatocellular tumor development and progression.
A critical impact of immune cells could be excluded with regard to cellular tumor rejection in Ugcgf/fAlbCre mice. F4/80- and CD3 positive cells showed similar numbers in the periphery of tumors in both control- and GSL-depleted liver. In human and rodent livers binuclear hepatocytes can be observed [61-63] arising from cytokinesis failure [63]. Bi- and polynucleation increased significantly in non-tumorous tissue and even more pronounced in tumors of Ugcg-depleted livers as compared to corresponding controls. This result pointed to impaired cytokinesis. A secondary effect due to cell cycle dysregulation did not seem probable as proteins involved in cell cycle were not significantly changed.
In vitro, we have also demonstrated that the proliferation both of Hepa 1-6 and HepG2 hepatocellular carcinoma cells was reduced after Ugcg depletion. In concordance with the in vivo data, tumor microsphere growth was significantly downregulated. Time lapse imaging of Hepa cells revealed increased duration of cell division. The differences are primarily small but accumulate over time.
Staining of GM2 revealed a dense and compact expression at the plasma membrane between G2- and M-phase, starting from the time cells round up until the end of cytokinesis and abscission. A switch of the sphingolipid composition of hepatoma cells from GSLs, mainly GM2, to increased SM synthesis due to repression of Ugcg, depleted negative surface charge and likely affected membrane polarity and fluidity. It may thus be surmised that mechanical properties of the cell membrane changed, leading to delayed cytokinesis and increased binucleation of hepatocytes. Our results corroborate data from Nomura et al. [64] showing that Ugcg-deficient C. elegans embryos developed multinucleated cells causing decreased brood size of the animals. Also Atilla-Gokcumen et al. demonstrated that alterations of the lipid content in HeLa S3 cells, achieved by siRNA treatments of synthesizing enzymes, changed their physical properties and caused cytokinesis failure [65].
Secretory transport vesicles either derived from recycling endosomes or by abscission from the Golgi apparatus are indispensable for the transport of lipids and proteins along microtubules to the intracellular bridge. Here they supply their content for the generation of new membrane compartments during late steps of cytokinesis [66]. Whether GSLs are involved in trafficking of secretory vesicles and whether repression of synthesis of GSLs retarded the transport of those vesicles cannot be definitively dissected due to the lack of appropriate analysis techniques for endogenous lipids. Up to now it appears impossible to label GSLs in such a way that neither their structure and size nor their polarity is affected. GM2 staining however did largely not overlap with the recycling endosomal marker Rab11. An involvement in cellular recycling processes might therefore be excluded.
In the present study we have shown for the first time that genetic deletion of Ugcg restricts tumor growth in endogenous diethylnitrosamine-induced hepatocellular carcinoma due to delay and failure of cytokinesis. Ugcg repression, whether genetically induced or chemically achieved by GCS inhibitors which are already used clinically to treat GSL storage diseases, might be a promising approach for the treatment of hepatocellular carcinoma.
MATERIALS AND METHODS
UGCG-gene expression analysis
Two publicly available GEO HCC datasets with Affymetrix microarray measurements GSE14520 [49, 50] and GSE64041 [51] were used. Normalized and log2-transformed expression values of tumor, non-tumor and healthy donor samples were analyzed. T-test was used to compare UGCG expression levels between tumor and normal samples, paired t-test to compare tumor and non-tumor samples. P-values below 0.05 were considered statistically significant. Analysis was performed with software R 3.4.
Animals
Mice with targeted mutation of the glucosylceramide synthase gene (Ugcg) specifically in hepatocytes (Ugcgf/fAlbCre) [48] as well as control litters (Ugcgf/f) with congenial C57Bl6 background were used to study the effects of GSLs on endogenously induced liver cancer. All animal experiments were approved by federal law.
Diethylnitrosamine (DEN) treatment of mice
For cancer induction, mice received a single dose of DEN (25mg/kg, Sigma, Munich, Germany) postnatally at day 15 [67]. Application of DEN at this early time point directs cancer development predominantly to the liver. One group of mice was sacrificed 8 months after DEN application in order to investigate cancer development. Numbers of macroscopically detectable liver tumors were counted. In addition, the left lateral liver lobe was sliced into 7 equal pieces which were embedded in paraffin.
In a long term experiment, a second group was kept for up to 80 weeks.
Mice were sacrificed according to federal animal law when animals started to show palpable tumors and tumor symptoms indicated by reduced food/water uptake and accompanied weight loss, apathy, or abnormal posture. Tumors from those mice were collected for analysis. Acute liver damage in mice was induced by singular i.p. injection of 100mg DEN/kg [67].
Histology and immunohistology
Sections were stained with hematoxylin/eosin (H&E, Chroma, Köngen, Germany) or anti-Ki67 (DAKO, Hamburg, Germany) [68] to visualize altered hepatocellular foci (AHF). Multinucleation in Ki67 positive cells of normal liver and tumors was determined by counting 10 high power fields at a magnification of 40 in hot spots. Details of anti-nitrotyrosine and anti-KDEL immunohistochemistry have been described in Supplementary Methods.
Sphingolipid extraction, mass spectrometry, and sialidase treatment of acidic GSL
One part of liver and tumor corresponding to ~50mg dry tissue has been extracted and analyzed for lipids as described [68]. For further details see, Supplementary Methods.
Cultivation and transfection of Hepa 1-6 cells with small interfering RNAs (siRNAs)
Hepa 1-6 primary mouse hepatoma cells (ATCC, Manassas, VA, USA) were cultivated in DMEM with high glucose and glutamine, 10% FCS, Pen/Strep, and Hepes (Life Technologies, Darmstadt, Germany). Cells were transfected twice with a mix containing of 1ml DMEM w/o FCS, 20μl Hiperfect (Qiagen, Hilden, Germany), and 6.3μl specific siRNA within 6 days as described in Supplementary Methods.
GCS inhibition with Genz 123346
Hepa 1-6 cells were cultivated as described before. 2x10⁵ cells in 10 ml culture medium in 10cm tissue culture dishes (Greiner Bio One, Frickenhausen, Germany) containing either 1μM/5μM Genz in DMSO or DMSO as control were incubated for 3d. Cells were counted, split and treated for another 3d as described above. Cells were then harvested and counted.
GCS inhibition with miglustat
Miglustat (Tocris, Ellisville, MO, USA) is less effective in GCS inhibition than Genz. Therefore, a higher concentration in the medium (100μM in H2O) has been used to decrease GSLs in a significant manner [69]. Hepa 1-6 cells were cultivated in analogy to the Genz treatment.
GSL depletion in Hepa 1-6 cells using CRISPR/Cas9 technology
A CRISPR/Cas9 expression vector with puromycin and ampicillin resistance (pX459, Addgene, Cambridge, MA, USA) was used for integration of the Ugcg guide RNA. Hepa cells were transfected as described in detail in the Supplementary Methods. 4x10⁵ targeted- and control cells each in 10 ml culture medium in 10cm tissue culture dishes (Greiner Bio One) were cultivated for 3 days. Cells were harvested and counted.
Isolation of mitotic Hepa cells
Hepa cells were harvested by mitotic shake off as described [65].
Cultivation of HepG2 cells and GCS inhibition with Genz 123346
HepG2 primary human hepatocellular carcinoma cells (ATCC, Manassas, VA, USA) were cultivated in DMEM with high glucose and glutamine, 10% FCS, Pen/Strep, and pyruvate (Life Technologies, Darmstadt, Germany). 2x10⁵ HepG2 cells were cultivated in 10cm culture plates (Greiner Bio One, Frickenhausen, Germany) for 6 days in the presence of 1μM/5μM Genz in DMSO or DMSO as control. Medium with or without Genz was changed on day 2 and day 4. Cells were harvested and counted.
Western blotting
Proteins were isolated as described [70]. Antibodies and blocking reagents can be found in the Supplementary Table 1. Quantification was performed with Image J.
Tumor microspheres
Tumor-like microspheres were achieved by cultivating ~ 4x10³ Hepa cells per cm2 in uncoated tissue plates (Greiner Bio One) for 6 to 7 days.
Live cell imaging
Live cell imaging was performed using an Olympus CellR microscope. Images were taken in 10 different fields of Ugcg-depleted- and control cells every 6min within 24h. The duration from rounding up of the cells at the prophase of the cell cycle until completion of cytokinesis was evaluated for each field.
TUNEL assay
TUNEL was performed according to the manufacturer’s instructions of the (In Situ Cell Death Detection Kit, Roche, Mannheim, Germany). Apoptotic cells were counted in 20 high power fields (HPF x400).
Transmission electron microscopy
Hepa 1-6 cells were fixed with 2.5% glutaric aldehyde in 0.05M cacodylate buffer, dehydrated with an alcohol series and embedded in araldite. Sections of 70nm thickness were cut using an Ultracut UCT (Leica, Wetzlar, Germany) and stained as described [68]. Sections were analyzed with an EM 910 and camera CCDK2 (Zeiss, Oberkochen, Germany).
Measurement of mitochondrial membrane potentials
Hepatoma cells were treated twice with Ugcg siRNA or control siRNA. Mitotracker green and -red 100nM each were added to the medium for 30min. Cells were washed, trypsinized and analyzed on a FACS Calibur (BD, Heidelberg, Germany).
Abbreviations
AHF, altered hepatocellular focus; DEN, diethylnitrosamine; GCS, glucosylceramide synthase; Genz123346, N-[(1R,2R)-1-(2,3-Dihydrobenzo[b] [1, 4] dioxin-6-yl)-1-hydroxy-3-(pyrrolidin-1-yl)propan-2-yl] nonanamide; GlcCer, glucosylceramide; GM2 ganglioside, (GalNAcβ1-4(NeuAcα2-3)Galβ1-4Glcβ1-1Cer); GSL, glycosphingolipid; HCC, hepatocellular carcinoma; NTS, 3-nitrotyrosine; SM, sphingomyelin; Ugcg/UGCG, glucosylceramide synthase gene.
Author contributions
R.J. and H.-J.G. designed the experiments. R.J., G.F., D.M., M.R., F.R., Z.V.P., M.V., and R.S. conducted the experiments. R.J., G.F., H.-J.G., D.M., M.R., T.H., and R.S. analyzed data. R.J. and H.-J.G. wrote the article.
ACKNOWLEDGMENTS
We thank Karin Müller-Decker for the implementation of the animal experiments with diethylnitrosamine; Aline Bayerle and Christian Marsching for their help in mass spectrometry and Ivan Morace for advice in testing mitochondrial membrane potentials; Ursula Klingmüller for providing the cancer cells in collaboration. The technical support of Ulrike Rothermel, Sylvia Kaden, Gabi Schmidt and Claudia Schmidt is gratefully acknowledged.
CONFLICTS OF INTEREST
The authors declare no conflicts of interest.
FUNDING
This study was supported by grants in aid of the DFG, SFB 1118 to H.-J.G.
REFERENCES
1. Caldwell S, Park SH. The epidemiology of hepatocellular cancer: from the perspectives of public health problem to tumor biology. J Gastroenterol. 2009; 44:96-101.
2. Starley BQ, Calcagno CJ, Harrison SA. Nonalcoholic fatty liver disease and hepatocellular carcinoma: a weighty connection. Hepatology. 2010; 51:1820-1832.
3. Liu YY, Patwardhan GA, Xie P, Gu X, Giuliano AE, Cabot MC. Glucosylceramide synthase, a factor in modulating drug resistance, is overexpressed in metastatic breast carcinoma. International journal of oncology. 2011; 39:425-431.
4. Zhang C, Lin X, Song Y, Zhang X, Li H, Wang Q. Overexpression of glucosylceramide synthase and its significance in the clinical outcome of non-small cell lung cancer. Chin Med J (Engl). 2014; 127:3071-3076.
5. Zhang K, Song YH, Lin XY, Wang QX, Zhang HW, Xu JW. Upregulation of glucosylceramide synthase protein in papillary thyroid carcinoma. Chin Med J (Engl). 2013; 126:4660-4664.
6. Liu YY, Gupta V, Patwardhan GA, Bhinge K, Zhao Y, Bao J, Mehendale H, Cabot MC, Li YT, Jazwinski SM. Glucosylceramide synthase upregulates MDR1 expression in the regulation of cancer drug resistance through cSrc and beta-catenin signaling. Mol Cancer. 2010; 9:145.
7. Liu YY, Hill RA, Li YT. Ceramide glycosylation catalyzed by glucosylceramide synthase and cancer drug resistance. Adv Cancer Res. 2013; 117:59-89.
8. Lucci A, Cho WI, Han TY, Giuliano AE, Morton DL, Cabot MC. Glucosylceramide: a marker for multiple-drug resistant cancers. Anticancer Res. 1998; 18:475-480.
9. Uchida Y, Itoh M, Taguchi Y, Yamaoka S, Umehara H, Ichikawa S, Hirabayashi Y, Holleran WM, Okazaki T. Ceramide reduction and transcriptional up-regulation of glucosylceramide synthase through doxorubicin-activated Sp1 in drug-resistant HL-60/ADR cells. Cancer research. 2004; 64:6271-6279.
10. Liu YY, Patwardhan GA, Bhinge K, Gupta V, Gu X, Jazwinski SM. Suppression of glucosylceramide synthase restores p53-dependent apoptosis in mutant p53 cancer cells. Cancer research. 2011; 71:2276-2285.
11. Patwardhan GA, Zhang QJ, Yin D, Gupta V, Bao J, Senkal CE, Ogretmen B, Cabot MC, Shah GV, Sylvester PW, Jazwinski SM, Liu YY. A new mixed-backbone oligonucleotide against glucosylceramide synthase sensitizes multidrug-resistant tumors to apoptosis. PLoS One. 2009; 4:e6938.
12. Siddiqui A, Patwardhan GA, Liu YY, Nazzal S. Mixed backbone antisense glucosylceramide synthase oligonucleotide (MBO-asGCS) loaded solid lipid nanoparticles: in vitro characterization and reversal of multidrug resistance in NCI/ADR-RES cells. Int J Pharm. 2010; 400:251-259.
13. Stefanovic M, Tutusaus A, Martinez-Nieto GA, Barcena C, de Gregorio E, Moutinho C, Barbero-Camps E, Villanueva A, Colell A, Mari M, Garcia-Ruiz C, Fernandez-Checa JC, Morales A. Targeting glucosylceramide synthase upregulation reverts sorafenib resistance in experimental hepatocellular carcinoma. Oncotarget. 2016; 7:8253-8267. https://doi.org/10.18632/oncotarget.6982.
14. Sun Y, Zhang T, Gao P, Meng B, Gao Y, Wang X, Zhang J, Wang H, Wu X, Zheng W, Zhou G. Targeting glucosylceramide synthase downregulates expression of the multidrug resistance gene MDR1 and sensitizes breast carcinoma cells to anticancer drugs. Breast Cancer Res Treat. 2010; 121:591-599.
15. Birkle S, Zeng G, Gao L, Yu RK, Aubry J. Role of tumor-associated gangliosides in cancer progression. Biochimie. 2003; 85:455-463.
16. Deng W, Li R, Guerrera M, Liu Y, Ladisch S. Transfection of glucosylceramide synthase antisense inhibits mouse melanoma formation. Glycobiology. 2002; 12:145-152.
17. Furukawa K, Hamamura K, Ohkawa Y, Ohmi Y, Furukawa K. Disialyl gangliosides enhance tumor phenotypes with differential modalities. Glycoconjugate journal. 2012; 29:579-584.
18. Gouaze V, Liu YY, Prickett CS, Yu JY, Giuliano AE, Cabot MC. Glucosylceramide synthase blockade down-regulates P-glycoprotein and resensitizes multidrug-resistant breast cancer cells to anticancer drugs. Cancer research. 2005; 65:3861-3867.
19. Hakomori SI, Handa K. GM3 and cancer. Glycoconjugate journal. 2015; 32:1-8.
20. Tsurifune T, Ito T, Li XJ, Yamashiro S, Okada M, Kanematsu T, Shiku H, Furukawa K. Alteration of tumor phenotypes of B16 melanoma after genetic remodeling of the ganglioside profile. International journal of oncology. 2000; 17:159-165.
21. Uemura S, Kabayama K, Noguchi M, Igarashi Y, Inokuchi J. Sialylation and sulfation of lactosylceramide distinctly regulate anchorage-independent growth, apoptosis, and gene expression in 3LL Lewis lung carcinoma cells. Glycobiology. 2003; 13:207-216.
22. Wondimu A, Liu Y, Su Y, Bobb D, Ma JS, Chakrabarti L, Radoja S, Ladisch S. Gangliosides drive the tumor infiltration and function of myeloid-derived suppressor cells. Cancer research. 2014; 74:5449-5457.
23. Yeh SC, Wang PY, Lou YW, Khoo KH, Hsiao M, Hsu TL, Wong CH. Glycolipid GD3 and GD3 synthase are key drivers for glioblastoma stem cells and tumorigenicity. Proceedings of the National Academy of Sciences of the United States of America. 2016; 113:5592-5597.
24. Basu S, Ma R, Mikulla B, Bradley M, Moulton C, Basu M, Banerjee S, Inokuchi J. Apoptosis of human carcinoma cells in the presence of inhibitors of glycosphingolipid biosynthesis: I. Treatment of Colo-205 and SKBR3 cells with isomers of PDMP and PPMP. Glycoconjugate journal. 2004; 20:157-168.
25. Cazet A, Groux-Degroote S, Teylaert B, Kwon KM, Lehoux S, Slomianny C, Kim CH, Le Bourhis X, Delannoy P. GD3 synthase overexpression enhances proliferation and migration of MDA-MB-231 breast cancer cells. Biol Chem. 2009; 390:601-609.
26. Dong L, Liu Y, Colberg-Poley AM, Kaucic K, Ladisch S. Induction of GM1a/GD1b synthase triggers complex ganglioside expression and alters neuroblastoma cell behavior; a new tumor cell model of ganglioside function. Glycoconjugate journal. 2011; 28:137-147.
27. Gu Y, Zhang J, Mi W, Yang J, Han F, Lu X, Yu W. Silencing of GM3 synthase suppresses lung metastasis of murine breast cancer cells. Breast Cancer Res. 2008; 10:R1.
28. Kroes RA, He H, Emmett MR, Nilsson CL, Leach FE 3rd, Amster IJ, Marshall AG, Moskal JR. Overexpression of ST6GalNAcV, a ganglioside-specific alpha2,6-sialyltransferase, inhibits glioma growth in vivo. Proceedings of the National Academy of Sciences of the United States of America. 2010; 107:12646-12651.
29. Liu Y, Yan S, Wondimu A, Bob D, Weiss M, Sliwinski K, Villar J, Notario V, Sutherland M, Colberg-Poley AM, Ladisch S. Ganglioside synthase knockout in oncogene-transformed fibroblasts depletes gangliosides and impairs tumor growth. Oncogene. 2010; 29:3297-3306.
30. Huang WC, Tsai CC, Chen CL, Chen TY, Chen YP, Lin YS, Lu PJ, Lin CM, Wang SH, Tsao CW, Wang CY, Cheng YL, Hsieh CY, et al. Glucosylceramide synthase inhibitor PDMP sensitizes chronic myeloid leukemia T315I mutant to Bcr-Abl inhibitor and cooperatively induces glycogen synthase kinase-3-regulated apoptosis. FASEB J. 2011; 25:3661-3673.
31. Lee YS, Choi KM, Lee S, Sin DM, Lim Y, Lee YM, Hong JT, Yun YP, Yoo HS. Myriocin, a serine palmitoyltransferase inhibitor, suppresses tumor growth in a murine melanoma model by inhibiting de novo sphingolipid synthesis. Cancer Biol Ther. 2012; 13:92-100.
32. Weiss M, Hettmer S, Smith P, Ladisch S. Inhibition of melanoma tumor growth by a novel inhibitor of glucosylceramide synthase. Cancer research. 2003; 63:3654-3658.
33. Ichikawa S, Ozawa K, Hirabayashi Y. Molecular cloning and characterization of the mouse ceramide glucosyltransferase gene. Biochemical and biophysical research communications. 1998; 253:707-711.
34. Hidari K, Ichikawa S, Fujita T, Sakiyama H, Hirabayashi Y. Complete removal of sphingolipids from the plasma membrane disrupts cell to substratum adhesion of mouse melanoma cells. The Journal of biological chemistry. 1996; 271:14636-14641.
35. Schnaar RL. Glycosphingolipids in cell surface recognition. Glycobiology. 1991; 1:477-485.
36. Groux-Degroote S, van Dijk SM, Wolthoorn J, Neumann S, Theos AC, De Maziere AM, Klumperman J, van Meer G, Sprong H. Glycolipid-dependent sorting of melanosomal from lysosomal membrane proteins by lumenal determinants. Traffic. 2008; 9:951-963.
37. Sprong H, Degroote S, Claessens T, van Drunen J, Oorschot V, Westerink BH, Hirabayashi Y, Klumperman J, van der Sluijs P, van Meer G. Glycosphingolipids are required for sorting melanosomal proteins in the Golgi complex. J Cell Biol. 2001; 155:369-380.
38. Tamboli IY, Prager K, Barth E, Heneka M, Sandhoff K, Walter J. Inhibition of glycosphingolipid biosynthesis reduces secretion of the beta-amyloid precursor protein and amyloid beta-peptide. The Journal of biological chemistry. 2005; 280:28110-28117.
39. Hakomori S. Bifunctional role of glycosphingolipids. Modulators for transmembrane signaling and mediators for cellular interactions. The Journal of biological chemistry. 1990; 265:18713-18716.
40. Lingwood D, Simons K. Lipid rafts as a membrane-organizing principle. Science. 2010; 327:46-50.
41. Kabayama K, Sato T, Saito K, Loberto N, Prinetti A, Sonnino S, Kinjo M, Igarashi Y, Inokuchi J. Dissociation of the insulin receptor and caveolin-1 complex by ganglioside GM3 in the state of insulin resistance. Proceedings of the National Academy of Sciences of the United States of America. 2007; 104:13678-13683.
42. Tagami S, Inokuchi Ji J, Kabayama K, Yoshimura H, Kitamura F, Uemura S, Ogawa C, Ishii A, Saito M, Ohtsuka Y, Sakaue S, Igarashi Y. Ganglioside GM3 participates in the pathological conditions of insulin resistance. The Journal of biological chemistry. 2002; 277:3085-3092.
43. Yamashita T, Hashiramoto A, Haluzik M, Mizukami H, Beck S, Norton A, Kono M, Tsuji S, Daniotti JL, Werth N, Sandhoff R, Sandhoff K, Proia RL. Enhanced insulin sensitivity in mice lacking ganglioside GM3. Proceedings of the National Academy of Sciences of the United States of America. 2003; 100:3445-3449.
44. Nordstrom V, Willershauser M, Herzer S, Rozman J, von Bohlen Und Halbach O, Meldner S, Rothermel U, Kaden S, Roth FC, Waldeck C, Gretz N, de Angelis MH, Draguhn A, et al. Neuronal expression of glucosylceramide synthase in central nervous system regulates body weight and energy homeostasis. PLoS Biol. 2013; 11:e1001506.
45. Liu Y, Su Y, Wiznitzer M, Epifano O, Ladisch S. Ganglioside depletion and EGF responses of human GM3 synthase-deficient fibroblasts. Glycobiology. 2008; 18:593-601.
46. Coskun U, Grzybek M, Drechsel D, Simons K. Regulation of human EGF receptor by lipids. Proceedings of the National Academy of Sciences of the United States of America. 2011; 108:9044-9048.
47. Wang XQ, Sun P, Paller AS. Ganglioside GM3 blocks the activation of epidermal growth factor receptor induced by integrin at specific tyrosine sites. The Journal of biological chemistry. 2003; 278:48770-48778.
48. Jennemann R, Rothermel U, Wang S, Sandhoff R, Kaden S, Out R, van Berkel TJ, Aerts JM, Ghauharali K, Sticht C, Grone HJ. Hepatic glycosphingolipid deficiency and liver function in mice. Hepatology. 2010; 51:1799-1809.
49. Roessler S, Jia HL, Budhu A, Forgues M, Ye QH, Lee JS, Thorgeirsson SS, Sun Z, Tang ZY, Qin LX, Wang XW. A unique metastasis gene signature enables prediction of tumor relapse in early-stage hepatocellular carcinoma patients. Cancer research. 2010; 70:10202-10212.
50. Roessler S, Long EL, Budhu A, Chen Y, Zhao X, Ji J, Walker R, Jia HL, Ye QH, Qin LX, Tang ZY, He P, Hunter KW, et al. Integrative genomic identification of genes on 8p associated with hepatocellular carcinoma progression and patient survival. Gastroenterology. 2012; 142:957-966 e912.
51. Makowska Z, Boldanova T, Adametz D, Quagliata L, Vogt JE, Dill MT, Matter MS, Roth V, Terracciano L, Heim MH. Gene expression analysis of biopsy samples reveals critical limitations of transcriptome-based molecular classifications of hepatocellular carcinoma. The journal of pathology Clinical research. 2016; 2:80-92.
52. Kushida M, Kamendulis LM, Peat TJ, Klaunig JE. Dose-related induction of hepatic preneoplastic lesions by diethylnitrosamine in C57BL/6 mice. Toxicol Pathol. 2011; 39:776-786.
53. Nakamura K, Suzuki H, Hirabayashi Y, Suzuki A. IV3 alpha (NeuGc alpha 2-8NeuGc)-Gg4Cer is restricted to CD4+ T cells producing interleukin-2 and a small population of mature thymocytes in mice. The Journal of biological chemistry. 1995; 270:3876-3881.
54. Yohe HC, Ye S, Reinhold BB, Reinhold VN. Structural characterization of the disialogangliosides of murine peritoneal macrophages. Glycobiology. 1997; 7:1215-1227.
55. Jakszyn P, Gonzalez CA. Nitrosamine and related food intake and gastric and oesophageal cancer risk: a systematic review of the epidemiological evidence. World journal of gastroenterology. 2006; 12:4296-4303.
56. Verna L, Whysner J, Williams GM. N-nitrosodiethylamine mechanistic data and risk assessment: bioactivation, DNA-adduct formation, mutagenicity, and tumor initiation. Pharmacol Ther. 1996; 71:57-81.
57. Obeid LM, Linardic CM, Karolak LA, Hannun YA. Programmed cell death induced by ceramide. Science. 1993; 259:1769-1771.
58. Hla T. Physiological and pathological actions of sphingosine 1-phosphate. Semin Cell Dev Biol. 2004; 15:513-520.
59. Maceyka M, Harikumar KB, Milstien S, Spiegel S. Sphingosine-1-phosphate signaling and its role in disease. Trends in cell biology. 2012; 22:50-60.
60. Uranbileg B, Ikeda H, Kurano M, Enooku K, Sato M, Saigusa D, Aoki J, Ishizawa T, Hasegawa K, Kokudo N, Yatomi Y. Increased mRNA Levels of Sphingosine Kinases and S1P Lyase and Reduced Levels of S1P Were Observed in Hepatocellular Carcinoma in Association with Poorer Differentiation and Earlier Recurrence. PLoS One. 2016; 11:e0149462.
61. Guidotti JE, Bregerie O, Robert A, Debey P, Brechot C, Desdouets C. Liver cell polyploidization: a pivotal role for binuclear hepatocytes. The Journal of biological chemistry. 2003; 278:19095-19101.
62. Kudryavtsev BN, Kudryavtseva MV, Sakuta GA, Stein GI. Human hepatocyte polyploidization kinetics in the course of life cycle. Virchows Arch B Cell Pathol Incl Mol Pathol. 1993; 64:387-393.
63. Margall-Ducos G, Celton-Morizur S, Couton D, Bregerie O, Desdouets C. Liver tetraploidization is controlled by a new process of incomplete cytokinesis. J Cell Sci. 2007; 120:3633-3639.
64. Nomura KH, Murata D, Hayashi Y, Dejima K, Mizuguchi S, Kage-Nakadai E, Gengyo-Ando K, Mitani S, Hirabayashi Y, Ito M, Nomura K. Ceramide glucosyltransferase of the nematode Caenorhabditis elegans is involved in oocyte formation and in early embryonic cell division. Glycobiology. 2011; 21:834-848.
65. Atilla-Gokcumen GE, Muro E, Relat-Goberna J, Sasse S, Bedigian A, Coughlin ML, Garcia-Manyes S, Eggert US. Dividing cells regulate their lipid composition and localization. Cell. 2014; 156:428-439.
66. Normand G, King RW. Understanding cytokinesis failure. Adv Exp Med Biol. 2010; 676:27-55.
67. Naugler WE, Sakurai T, Kim S, Maeda S, Kim K, Elsharkawy AM, Karin M. Gender disparity in liver cancer due to sex differences in MyD88-dependent IL-6 production. Science. 2007; 317:121-124.
68. Jennemann R, Kaden S, Sandhoff R, Nordstrom V, Wang S, Volz M, Robine S, Amen N, Rothermel U, Wiegandt H, Grone HJ. Glycosphingolipids are essential for intestinal endocytic function. The Journal of biological chemistry. 2012; 287:32598-32616.
69. Makino A, Ishii K, Murate M, Hayakawa T, Suzuki Y, Suzuki M, Ito K, Fujisawa T, Matsuo H, Ishitsuka R, Kobayashi T. D-threo-1-phenyl-2-decanoylamino-3-morpholino-1-propanol alters cellular cholesterol homeostasis by modulating the endosome lipid domains. Biochemistry. 2006; 45:4530-4541.
70. Jennemann R, Rabionet M, Gorgas K, Epstein S, Dalpke A, Rothermel U, Bayerle A, van der Hoeven F, Imgrund S, Kirsch J, Nickel W, Willecke K, Riezman H, et al. Loss of ceramide synthase 3 causes lethal skin barrier disruption. Hum Mol Genet. 2012; 21:586-608.