
INTRODUCTION
Celastrol, a quinone methide triterpene, is a pharmacologically active compound derived from the Chinese medicinal plant, Tripterygium wilfordii [1]. Two carbons of celastrol, C2 of the A-ring and C6 of the B-ring (Figure 1A), reportedly show high susceptibilities for nucleophilic attack [2]. Celastrol can react with the nucleophilic thiol groups of cysteine residues and form covalent Michael adducts [3-6]. This seems to be the major mechanism through which celastrol can alter the functions of various proteins. Celastrol has traditionally been used to treat autoimmune diseases [7], chronic inflammation [8], asthma [9], and neurodegenerative diseases [10]. More recently, it has attracted interest as a potential anti-cancer agent, since it has been shown to inhibit proliferation and suppress the initiation, progression and metastasis of tumors in a wide variety of models in vitro and in vivo [11-14]. To date, the studies on the cancer-killing activity of celastrol have mainly focused on its ability to induce apoptosis [15,16]. In the present study, in contrast, we show that celastrol kills breast and colon cancer cell lines via inducing paraptosis. Despite recent improvements in anti-cancer therapies, inherent or acquired cellular resistance to various pro-apoptotic treatments often leads to therapeutic failure [17]. Thus, a better understanding of alternative, non-apoptotic cell death pathways, including paraptosis, may facilitate the design of novel therapeutics against malignant cancer cells that harbor defective apoptotic machineries. The term “paraptosis” was originally introduced to describe a form of programmed cell death that is morphologically and biochemically distinct from apoptosis [18,19]. It is characterized by: extensive cytoplasmic vacuolization that arises via swelling of the ER [19-21] and/or mitochondria [19,21,22]; the lack of characteristic apoptotic features, such as pyknosis, DNA fragmentation and caspase activation [19,21,23]; insensitivity to caspase inhibitors [18,24]; and overexpression of anti-apoptotic Bcl-2-like proteins [18,21,24]. Therefore, identification of agents that can induce paraptosis by targeting both mitochondria and the ER may provide a rational therapeutic strategy for effectively killing malignant cancer cells that resist apoptosis. However, the mechanisms underlying paraptosis, particularly the signals responsible for triggering dilation of mitochondria and the ER are still poorly defined. Observations that paraptosis can be inhibited by cycloheximide indicate that the paraptotic process requires protein synthesis [19,21,22,25]. MAP kinase activation has been associated with paraptosis induced by insulin-like growth factor I receptor (IGFIR) [18], curcumin [21,22], celastrol [25], and taxol [26], although the importance of the respective MAP kinase differs depending on the stimulus [18,21,22,25,26]. We recently showed that proteasomal dysfunction and the generation of mitochondrial superoxide are critical for the curcumin-induced dilation of mitochondria/ER and subsequent paraptotic cell death in breast cancer cells [21]. We propose here that the IP3R-mediated release of Ca2+ from the ER and its subsequent mitochondrial Ca2+ uniporter-mediated influx into mitochondria may critically contribute to extensive dilation of mitochondria and the ER, leading to celastrol-induced paraptotic cell death.
RESULTS
Neither apoptosis nor autophagy is critically involved in celastrol-induced cancer cell death
To investigate the anti-cancer effects of celastrol, we treated two breast cancer cell lines (MDA-MB 435S and MCF-7) and two colon cancer cell lines (DLD-1 and RKO) with various doses of celastrol for 24 h and performed cell viability assays using calcein-AM and EthD-1 to detect live and dead cells, respectively. We found that celastrol dose-dependently increased cell death over a range of 1-3 μM (Figure 1B). To test whether celastrol kills these cancer cells via apoptosis, we used the tumor necrosis factor-related apoptosis-inducing ligand (TRAIL), a cytokine that induces apoptosis by binding to the death receptors DR4 and DR5 [27] as a positive control. Treatment of MDA-MB 435S cells for 24 h with the apoptosis inducer TRAIL (0.2 μg/ml) effectively induced cell death (Figure 1C) in association with the effective proteolytic cleavage of caspase-8, -9, and -3 (Figure 1D). Pretreatment with z-VAD-fmk, a pan-caspase inhibitor, almost completely blocked TRAIL-induced cell death, but not celastrol-induced cell death in these cells (Figure 1C). Consistent with this, celastrol treatment was not accompanied by detectable proteolytic processing of cspase-8 or -9, except the minimal expression of p20 intermediate form of caspase-3 (Figure 1D). Furthermore, z-VAD-fmk pretreatment did not significantly inhibit celastrol-induced cell death in MCF-7 and DLD-1 cells, although it slightly attenuated cell death in RKO cells (Figure 1E). Moreover, chromatin condensation, DNA fragmentation, and PARP cleavage were frequently observed in MDA-MB 435S cells treated with TRAIL, as revealed by DAPI staining and immunostaining for cleaved PARP, but not in cells treated with celastrol (Supplementary Figure 1A). Immunocytochemical analysis further revealed that TRAIL induced the release of mitochondrial cytochrome c, whereas celastrol did not (Supplementary Figure 1B). Taken together, these results indicate that apoptosis may not critically contribute to the cytotoxicity of celastrol toward the tested cancer cell lines.
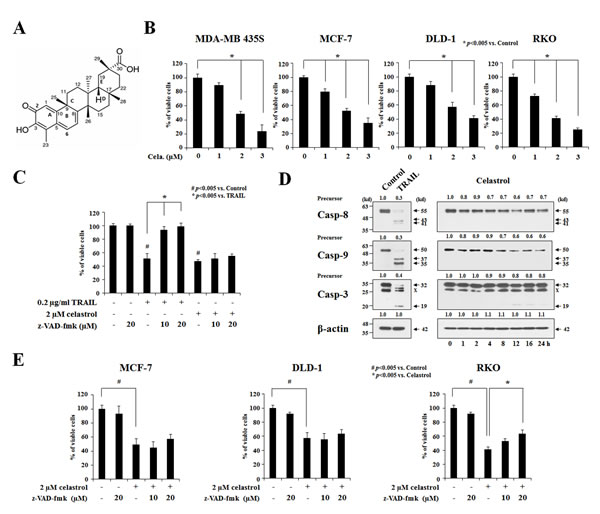
Figure 1: Apoptosis is not critically involved in the celastrol-induced cancer cell death. (A) The chemical structure of celastrol. (B) Two breast cancer cell lines (MDA-MB 435S and MCF-7) and two colon cancer cell lines (DLD-1 and RKO) were treated with celastrol at the indicated concentrations for 24 h. Cellular viability was assessed using calcein-AM and EthD-1 to detect live and dead cells, respectively. (C) MDA-MB 435S cells were pretreated with the indicated concentrations of z-VAD-fmk for 30 min and further treated with 0.2 μg/ml TRAIL or 2 μM celastrol for 24 h. Cellular viability was assessed using calcein-AM and EthD-1. (D) MDA-MB 435S cells were treated with 0.2 μg/ml TRAIL for 24 h or 2 μM celastrol for the indicated time points. Whole cell extracts were prepared from the treated cells and subjected to Western blotting. β-actin was used as a loading control in Western blots. The fold change of protein levels compared to control (untreated cells) was determined by a densitometric analysis. (E) Cells were pretreated with the indicated concentrations of z-VAD-fmk for 30 min and further treated with or without 2 μM celastrol for 24 h. Cellular viability was assessed using calcein-AM and EthD-1.
When we examined the cellular morphologies following celastrol treatment, we found that marked cellular vacuolation commonly preceded cell death in MDA-MB 435S, MCF-7, DLD-1 and RKO cells (Figure 2A). Therefore, we examined whether celastrol-induced vacuolation and subsequent cell death were associated with autophagy. First, we tested the possibility that celastrol induces lysosomal activation, a late step in autophagy, by staining with LysoTracker-Red. Treatment of MDA-MB 435S cells with Torin1, an autophagy inducer with mTOR (mechanistic target of rapamycin) inhibitory activity [28], markedly increased LysoTracker-Red staining, whereas bafilomycin A1, an autophagy inhibitor, substantially reduced it (Figure 2B). Interestingly, celastrol treatment, like bafilomycin A1 treatment, also inhibited LysoTracker-Red staining. We further measured autophagic flux activity in MDA-MB 435S cells employing the tandem fluorescent construct, mRFP/GFP-LC3 [29]. In this assay, RFP fluorescence is relatively stable in acidic compartments, whereas GFP fluorescence is rapidly quenched in such environments. Accordingly, mRFP/GFP-LC3 in mature autolysosomes will be detected as red puncta, whereas blocking autophagosome-lysosome fusion or suppressing lysosomal degradation (i.e., through an increase in lysosomal pH) will increase the number of yellow puncta [29]. We found that celastrol treatment increased the number of yellow puncta (RFP(+)/GFP(+)-LC3) similar to bafilomycin A1 treatment, whereas Torin1 treatment increased red puncta (RFP(+)/GFP(-)-LC3 puncta) (Figure 3A-3C). Time-course experiments showed that LC3 (both I and II form), as well as p62 [30] and NBR1 (Neighbor of Braca1 gene) [31], the substrates of autophagy, progressively accumulated in both MDA-MB 435S and MCF-7 cells treated with celastrol, similar to those obtained with bafilomycin A1 treatment (Figure 3D). Also similar to bafilomycin A1 treatment, celastrol inhibited the proteolytic processing of cathepsin L, a major lysosomal protease. These results would seem to suggest that celastrol might inhibit autophagy, possibly at the lysosomal step. However, we found that neither celastrol-induced cell death nor cellular vacuolation was affected not only by pretreatment with the autophagy inhibitors, 3-MA, bafilomycin A1, and chloroquine (CQ) but also by knockdown of ATG5, Beclin-1 and LAMP2 (Supplementary Figure 2A-2D). Furthermore, celastrol-induced cell death was not affected by the pretreatment with necrostatin-1, an inhibitor of necroptosis (Supplementary Figure 2E and 2F). Collectively, these results suggest that celastrol-induced vacuolation and subsequent cell death in MDA-MB 435S cells do not involve modulation of autophagy or necroptosis.
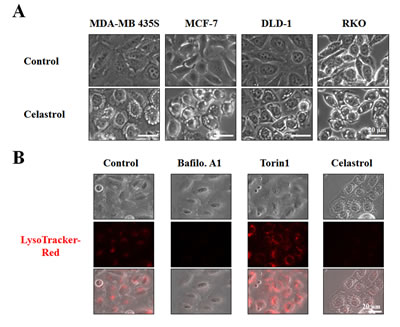
Figure 2: Celastrol induces vacuolation, but not lysosomal activation. (A) Cells were treated with 2 μM celastrol for 8 h and observed under the phase contrast microscope. (B) MDA-MB 435S cells were left untreated or treated with 10 nM bafilomycin A1 (Baflo. A1), 1 μM Torin1, or 2 μM celastrol for 8 h, stained with 50 nM LysoTracker-Red for 20 min, and then observed under the phase contrast and a fluorescence microscope.
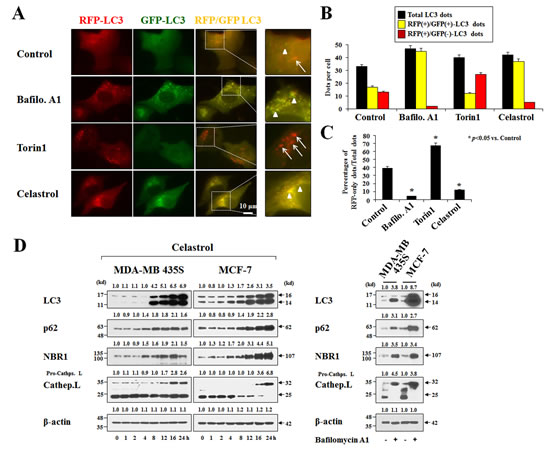
Figure 3: Celastrol inhibits autophagy. (A) MDA-MB 435S cells transiently transfected with mRFP-GFP-LC3 plasmid for 24 h were further treated with 10 nM bafilomycin A1 (Baflo. A1), 1 μM Torin1, or 2 μM celastrol for 8 h. Representative fluorescence microscopic images are shown. Arrow heads: yellow dots (RFP(+)/GFP(+)-LC3 puncta), arrows: RFP-LC3-only dots (RFP(+)/GFP(-)-LC3 puncta). (B,C) Total, RFP(+)/GFP(+)-LC3, and RFP(+)/GFP(-)-LC3 dots were quantified and their percentages were calculated (>20 cells were counted in each experiment from at least three independent experiments. (D) Cells were treated with 2 μM celastrol for the indicated time points (left) or 10 nM bafilomycin A1 for 24 h (right). Whole cell extracts were prepared from the treated cells and subjected to Western blotting. β-actin was used as a loading control in Western blots. The relative expression levels were determined by the fold change of densitometric values in treated groups to the values in the control (untreated) group.
Celastrol induces paraptosis in MDA-MB 435S cells
Next, to test whether the celastrol-induced vacuoles might originate from mitochondria and/or the ER, we used MDA-MB 435S sublines stably expressing fluorescence selectively in mitochondria or the ER, YFP-Mito cells and YFP-ER cells [21]. As shown in Figure 4A, mitochondria in untreated YFP-Mito cells exhibited a filamentous, elongated morphology, whereas the ER in untreated YFP-ER cells formed a reticulate structure. At 3 h after treatment with 2 μM celastrol, numerous fluorescent vacuoles were observed in both YFP-Mito and YFP-ER cells. Immunocytochemistry using specific antibodies against the subunit A of succinate dehydrogenase (SDHA), a mitochondrial protein, and protein disulfide-isomerase (PDI), an ER-resident protein, showed many small rings of SDHA expression and larger rings of PDI expression in MDA-MB 435S cells treated with celastrol for 3 h (Figure 4B). A more detailed electron microscopy revealed swollen mitochondria and the ER structures in MDA-MB 435S cells treated with 2 μM celastrol for 3 h. At 6 h of celastrol treatment, fusion among swollen mitochondria and the swollen ER had further progressed (Figure 4C). In contrast, untreated MDA-MB 435S cells possessed mitochondria with intact cristae and the ER structures with a reticular morphology. Collectively, these results indicate that celastrol induces paraptotic morphologies. We next sought biochemical evidence for the induction of paraptosis by celastrol. We first tested the effect of the protein synthesis inhibitor, cycloheximide, on celastrol-induced cell death. Pretreatment with cycloheximide (CHX) very effectively blocked cell death in celastrol-treated MDA-MB 435S cells (Figure 5A), and prevented mitochondrial/ER dilation in celastrol-treated YFP-Mito and YFP-ER cells (Figure 5B). Recently, we showed that proteasome dysfunction is required for dilation of mitochondria/ER and consequent paraptotic cell death [21,22]. Thus, we asked whether celastrol also impairs proteasome activity. We found that celastrol-treated cells progressively accumulated poly-ubiquitinated proteins (Figure 5C). Furthermore, celastrol treatment markedly increased the protein levels of ATF4, CHOP, and KDEL in MDA-MB 435S and MCF-7 cells, indicating that celastrol induces ER stress. When we examined the activity changes in MAP kinases, we found that ERKs were progressively activated in MDA-MB 435S cells treated with celastrol. In contrast, the activities of ERKs increased with a peak at 2 h of celastrol treatment and then slowly reduced in MCF-7 cells (Figure 5D). In both MDA-MB 435S and MCF-7 cells, JNKs demonstrated biphasic activation patterns following celastrol treatment, whereas p38 showed transient activation with a peak at 2 h after celastrol treatment. When we investigated the importance of these signals, we found that celastrol-induced cell death was significantly inhibited by SP600125-induced inhibition of JNK, inhibited by PD98059-induced inhibition of ERK at lesser extent, and unaffected by SB203580-induced inhibition of p38 (Figure 5E). Taken together, our results indicate that celastrol may induce paraptosis in the tested breast cancer cell lines.
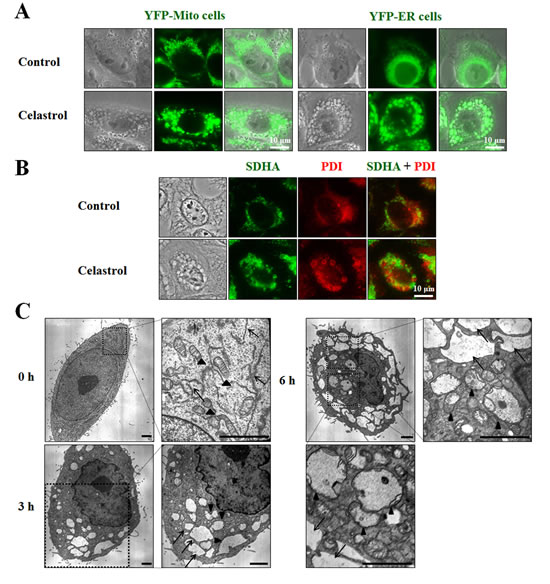
Figure 4: Celastrol-induced vacuoles are derived from mitochondria and the ER. (A) YFP-Mito or YFP-ER cells treated with 2 μM celastrol for 3 h were observed under the phase contrast and fluorescence microscope. (B) MDA-MB 435S cells were treated with or without 2 μM celastrol for 3 h. Immunocytochemistry using anti-SDHA (green) and anti-PDI (red) antibodies was performed and the representative phase contrast and fluorescence microscopic images of cells are shown. (C) MDA-MB 435S cells were treated with 2 μM celastrol for the indicated time points and observed by transmission electron microscopy. Arrowheads indicate mitochondria and arrows denote the ER. Swelling and fusion of mitochondria and the ER are seen after celastrol treatment. Bars, 2 μm.
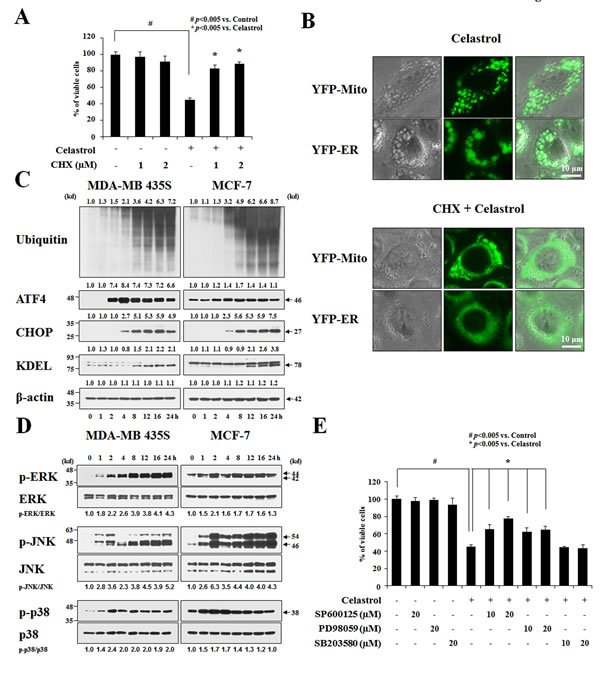
Figure 5: Celastrol induces paraptosis. (A) MDA-MB 435S cells were left untreated or were pretreated with cycloheximide (CHX) at the indicated concentrations for 30 min and then treated with 2 μM celastrol for an additional 24 h in the continued presence of CHX. Cellular viability was assessed using calcein-AM and EthD-1. (B) YFP-Mito or YFP-ER cells were left untreated or were pretreated with 1 μM CHX and further treated with 2 μM celastrol for an additional 3 h in the continued presence of CHX. Cells were observed under the phase contrast and fluorescence microscope. (C) Cells were treated with 2 μM celastrol for the indicated time points and Western blotting was performed. β-actin was used as a loading control in Western blots. The relative expression levels were determined by the fold changes of densitometric values in treated groups to the values in the control (untreated) group. (D) Cells were treated with 2 μM celastrol for the indicated time points and Western blotting was performed. The relative phosphorylation levels of the respective MAP kinase were determined by the fold changes of densitometric values in treated groups to the values in the control group. Densitometric values for the phospho-proteins of interest were normalized for protein loading with their total proteins. Similar results were obtained from three independent experiments. (E) MDA-MB 435S cells were untreated or pretreated with the indicated specific inhibitors (SP600125, PD98059, and SB203580) at the indicated concentrations for 30 min and further treated with 2 μM celastrol for 24 h. Cellular viability was assessed using calcein-AM and EthD-1.