
INTRODUCTION
Endometrial cancer (EC) is the most common gynaecologic malignancy in the high-income countries, and its incidence has increased by 21% since 2008 [1]. Presently, the treatment and prognosis are influenced by a subset of parameters based on molecular markers and the microscopic appearance of the tumours. Although approximately 75% of patients are primary curable by surgery and adjuvant treatment, 15-20% of these tumours will recur, with an aggressive and therapy-resistant behavior [2]. Several events (including genetic alterations and tumour microenvironment factors) have been reported to be activated or co-existing in aggressive endometrial cancer [3].
Angiogenesis is an essential mechanism for tumour growth, invasion and metastatic spread in many cancers types [4]. Moreover, tumour-associated vessels are frequently structurally and functionally abnormal, exhibiting delayed maturation and increased permeability [5].
In EC, increased microvascular proliferation correlates with a more aggressive phenotype [6-8]. Furthermore, high microvascular proliferation is associated with lower tumour blood flow (Fb) based on dynamic contrast-enhanced magnetic resonance imaging (DCE-MRI), and low tumour Fb is observed in EC patients with reduced recurrence /progression-free survival [6, 9]. Altogether, is consistent with the hypothesis that vascular proliferation with coexisting disorganized angiogenesis promotes tumour progression and metastatic spread in EC [6].
Cancer was primarily considered a proliferative disorder; however, altered cell metabolism has emerged as a “hallmark of cancer”, since growing tumour cells rewire their metabolic program to meet the biosynthetic and bioenergetic demands of constant cell growth and phenotype changes. Metabolomics analysis provides direct evidences of biochemical context-dependent changes that can be correlated with the pathologic state of a cell, tissue or organ [10]. Therefore, metabolomics has been applied to reveal new mechanisms in cancer development and has identified specific biomarkers relevant for diagnosis and prognosis in various cancers.
The present study explores the different metabolomic tumour signatures potentially characterizing EC lesions exhibiting high versus low tumour blood flow at DCE-MRI. The identification of high versus low Fb metabolic biomarkers may highlight preoperative functional tumour characteristics with potential relevance for preoperative risk assessment and for identification of EC patients with expected poor outcome.
RESULTS
The main objective of this work was to determine metabolomics differences based on tumour Fb using a non-targeted metabolomics approach. We employed multivariate statistics to study changes in whole sample metabolome both in unsupervised-principal component (PCA) and hierarchical clustering analysis- and in supervised approaches-partial least discriminate analysis (PLS-DA), ortho-PLS-DA and Random Forest (RF) [11].
Patients had a mean age of 68 years and 20/26 (77%) of tumours had endometrioid histology (Table 1). In total 17/26 (66%) were classified as early stage (FIGO 1: Federation International of Gynecology and Obstetrics), and received no adjuvant therapy in accordance with national guidelines. 4/6 (67%) of non endometrioid histological subtype patients received adjuvant chemotherapy.
Table 1: Clinicopathological patient characteristics (n = 26) of women treated for endometrial cancer and evaluated by enhanced contrast MRI and metabolomics
Age; mean (range) years |
68 (41-93) |
|---|---|
Postmenopausal, n (%) |
23 (89) |
Lymph node sampling performed, n (%) |
21 (81) |
Adjuvant therapy received, n (%) |
9 (35) |
FIGO stagea, n (%) |
|
IA |
10 (39) |
IB |
7 (27) |
II |
4 (15) |
III |
4 (15) |
IV |
1 (4) |
Histologic differentiation, n (%) |
|
Grade 1 |
5 (19) |
Grade 2 |
5 (19) |
Grade 3 |
16 (62) |
Histologic subtype, n (%) |
|
Endometrioid |
20 (77) |
Clear cell |
1 (4) |
Serous |
3 (11) |
Carcinosarcoma |
2 (8) |
aAccording to International Federation of Gynaecology and Obstetrics (FIGO) 2009 staging criteria (ref)
In the present work PCA analysis was chosen as an unsupervised method (Figure 1). This analysis showed that lesions with high tumour Fb clustered better than lesions exhibiting low tumour blood flow. Once we discarded the presence of outliers and checked the technical quality of the technique we applied ortho-PLSDA as a specific tool for clustering (Figure 2A). This analysis resulted in two well-defined clusters (Q2=0.656 and R2Y =0.985). RF analysis reinforced these results showing an out of bag error of 0.07 (Figure 2B). Because of endometrioid and non-endometrioid tumours are different EC subtypes we also performed statistics excluding non-endometrioid EC patients obtaining similar results (Supplementary Figure 1A-1C). Specifically multivariate statistics show a good culsterization according to high and low tumour Fb (ortho-PLSDA parameters: Q2 =0.553 and R2Y =0.979, random forest out of bag error = 0.1).
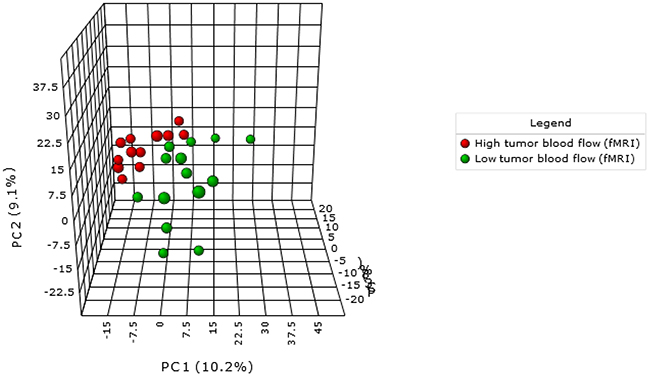
Figure 1: PCA demonstrate a metabolomic-specific signature depending on tumour blood flow in endometrial cancer patients. Red spots represent high tumour blood flow and green spots represent low tumour blood flow as determined by DCE-MRI.
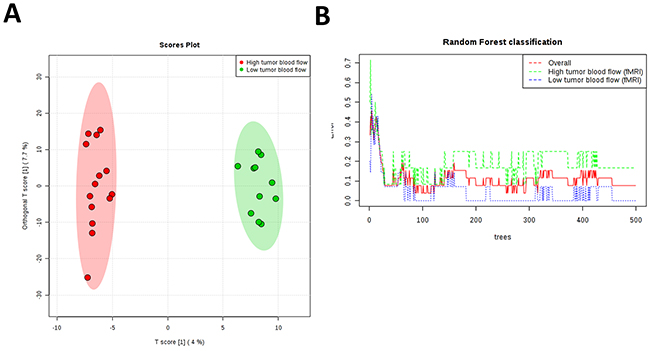
Figure 2: (A) Ortho-PLSDA algorithm using all metabolites found in samples from endometrial cancer tumours is able to discriminate groups with an observed Q2 of 0. 656 and observed R2Y of 0.985. Red spots represent high tumour blood flow patients and green spots represent low tumour blood flow as determined by DCE- MRI. (B) RF classification shows and overall classification error of 0.07.
The analysis revealed 28 statistically significant molecules (Table 2). The annotation process (using exact mass, retention time and isotopic distribution) disclosed several lipids belonging to phospholipid, glycerolypid and sphinogolipid families. Specifically, four lysophosphatidylcholines were up-regulated in tumours with high Fb. Moreover, resolvin D was identified as a potential tumour Fb biomarker. The ROC curve of resolvin D (AUC= 0.855, specificity= 0.9 and sensitivity = 0.7) confirmed the robustness of this metabolite to predict high tumour Fb (Figure 3A). To further study the predictive value of the metabolites found, we applied ROC curves using groups of metabolites (5, 10, 15, 25, 50 and 100) with lowest p-value obtained from T-Test between EC tumours with high versus low Fb observing a higher sensitivity and specificity when only the statistical significant metabolites (T-Test, Benjamini Hochberg False Discovery Rate, p<0.05) with a potential identity were used (Supplementary Figure 2). Using these metabolites we could reach a higher predictive value than using only Resolvin D1. Finally, we applied hierarchical clustering analyses using the 25 most statistically significant metabolites and an almost perfect separation between groups was observed (Figure 3B).
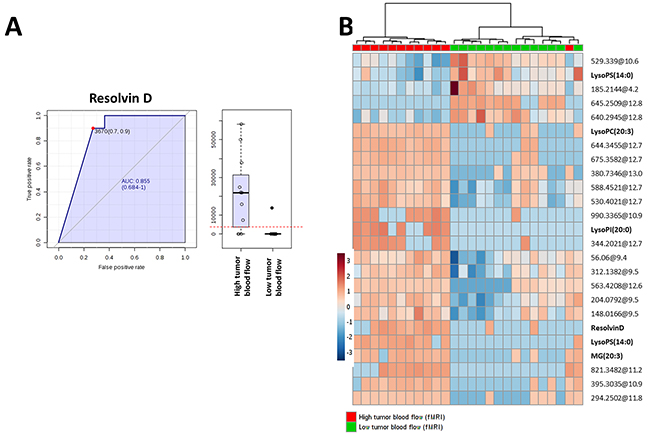
Figure 3: (A) ROC curve of tumour resolvin D levels. (B) Hierarchical clustering analyses using 25 most statistical significant metabolites significantly different between endometrial cancer tumours with high versus low blood flow (Student’s T-Test, Benjamini Hochberg False Discovery Rate, p<0.05). Unknown identities are represented as exact mass@retention time.
Table 2: Metabolites from endometrial cancersignificantly different expressed in tumors with high versus low blood flow (Fb) determined by dynamic contrast enhanced (DCE)-MRI blood flow (Student’s T-Test, p<0.05)
Potential ID (exact mass) |
p (Corr) |
Regulation (H vs L) |
FC |
Mass |
Retention Time |
|---|---|---|---|---|---|
Unknown |
0.001717 |
down |
-3140.98 |
645.2509 |
12.776092 |
Unknown |
0.002955 |
down |
-1.55451 |
529.339 |
10.614731 |
Unknown |
0.002955 |
down |
-2.36942 |
640.2945 |
12.776231 |
LysoPS(14:0) |
0.002955 |
up |
1313.153 |
469.2301 |
11.289364 |
Unknown |
0.002955 |
up |
2939.315 |
644.3455 |
12.713154 |
MG(20:3) |
0.005209 |
up |
2786.49 |
380.2894 |
11.154073 |
LysoPI(20:0) |
0.00663 |
up |
451.2966 |
628.3694 |
12.711375 |
LysoPC(18:1) |
0.0079 |
up |
7360.114 |
521.3482 |
11.1267 |
Unknown |
0.0079 |
up |
744.7858 |
675.3582 |
12.709785 |
Unknown |
0.0079 |
up |
784.6694 |
380.7346 |
13.018824 |
Unknown |
0.008335 |
up |
3.061549 |
588.4521 |
12.71631 |
Unknown |
0.008335 |
up |
1489.749 |
395.3035 |
10.927358 |
Unknown |
0.009024 |
up |
4.129054 |
530.4012 |
12.716731 |
Unknown |
0.010229 |
up |
584.1685 |
294.2502 |
11.812234 |
Unknown |
0.017847 |
down |
-1.76119 |
497.3935 |
5.910731 |
LysoPC(20:3) |
0.027094 |
up |
1097.7 |
545.3473 |
10.9397335 |
Unknown |
0.029734 |
down |
-1.53841 |
185.2144 |
4.237846 |
Resolvin D |
0.03647 |
up |
480.5512 |
376.2332 |
10.606182 |
Unknown |
0.03647 |
down |
-135.16 |
639.5252 |
12.372849 |
PC(42:2) |
0.03647 |
down |
-251.465 |
869.6867 |
13.405749 |
Unknown |
0.03647 |
down |
-175.365 |
915.7157 |
13.490999 |
Unknown |
0.03647 |
up |
319.0776 |
563.4208 |
12.652739 |
Unknown |
0.03647 |
up |
275.0069 |
344.2021 |
12.714 |
Unknown |
0.03647 |
down |
-297.762 |
890.7981 |
14.891124 |
NeuAcalpha2-3Galbeta-Cer(d34:1) |
0.03647 |
up |
274.8682 |
990.6635 |
10.921999 |
Unknown |
0.03647 |
up |
383.5934 |
410.2134 |
11.286181 |
Unknown |
0.04131 |
up |
861.9869 |
901.5447 |
13.720384 |
PI-Cer(t46:0(2OH)) |
0.044655 |
up |
223.0672 |
981.7524 |
12.743363 |
DISCUSSION
Advanced DCE-MRI techniques enable visualization and quantification of functional tumour characteristics in vivo. Previous studies revealed that in EC, low tumour Fb accompanied by increased capillary leakage and high microvascular proliferation is associated with reduced recurrence/progression free survival [6, 9]. These associations are somewhat puzzling, but may be related to the fact that tumoural angiogenesis generates vessels that in spite of being abundant, are heterogenous and rough making them altogether dysfunctional [12]. Further, the negative impact of low tumour Fb and disorganized angiogenesis have suggested tumour hypoxia promotes tumour progression and metastatic spread in endometrial carcinomas [13].
Based on these premises we designed an experiment to evaluate potential changes in tissue metabolome according to whether the tumours preoperatively exhibited high- or low Fb.
Previous studies have suggested a specific metabolomics signature of EC compared to normal tissue [14], but the present results indicate that there is a specific metabolome associated with tumour Fb, suggesting important changes in tumour metabolism which could modulate EC progression and angiogenesis related resistance to treatment [15]. Among all statistically different molecules found, we detected lipid species belonging to different families including phospholipids and, specifically, lysophospholipids (LPL). LPL were first discovered as constituents of cell membranes; however, today we know that they can also act as signalling molecules, playing important roles in central processes in cancer: stimulating angiogenesis, inhibiting apoptosis or modulating immune response [16]. In our study we identified several LPL species increased in high Fb EC patient tissues. Specifically, in this work we describe, for the first time, the potential role of lysophophatydilcholine (18:1), lysophosphatydilserine (14:0), lysophosphatydilinositol (20:0) and lysophosphatydilcholine (20:3) in EC tumour progression. These results reinforce the idea of LPL metabolism as a disease modifier in EC progression. Furthermore, this study has revealed that tissue resolvin D could be a good predictor of high tumour Fb (generally correlated to better patient survival). Resolvin D is known to be involved in the resolution of inflammation processes and shows potent effects in protecting against neovascularization and hypoxia in some pathological diseases [17]. Thus, our findings suggest that loss of the protective and inflammatory-resolution effect induced by tumour LPL and Resolvin D coexists with vascular proliferation leading to disorganized angiogenesis and hypoxia, relevant mechanisms in tumour progression and metastatic spread in EC [13].
All in all, the present work delves into the different signalling molecules involved in tumour progression. These achievements can serve to better understand EC metabolism helping to develop, in a near future, novel and more personalized therapies. Moreover, our results support the promising role of DCE-MRI as preoperative non-invasive imaging tool depicting tumour vascular features relevant for the corresponding metabolomic tumour signature that may be targetable in EC therapy.
MATERIALS AND METHODS
Patients and tissue samples
Endometrial tissue from hysterectomy specimens was collected from 26 patients surgically treated for endometrial carcinoma. All patients were diagnosed and treated at the same university hospital (Haukeland University Hospital, Bergen, Norway) written informed consent was obtained from all patients for the collection of imaging data and specimens for biomarker studies included in an institutional review board-approved protocol (Rek Vest 2009/2315).
Dynamic contrast enhanced (DCE)-MRI protocol and blood flow (Fb) analysis
Preoperative pelvic magnetic resonance imaging (MRI) was performed in all patients on a 1.5 Tesla MRI scanner (Siemens Avanto running Syngo v. B17, Germany) using a six-channel body coil and a standardized imaging protocol [6, 9] 20 mg butyl-scopolamine bromide (Buscopan; Boehringer, Germany) was administered intravenously prior to scanning in order to reduce motion artefacts. Contrast agent was administrated intravenously (Dotarem, Guerbet: 0.1 mmol gadolinium/kg, 3 ml/s injection speed). Pelvic sagittal and axial oblique (perpendicular to the long axis of the uterus) T2-weighted images were acquired together with axial oblique T1-weighted gradient-echo images prior to contrast agent administration. Pelvic DCE-MRI was obtained for 12 axial oblique slices applying a 3D spoiled gradient echo (FLASH) sequence (echo time/repetition time (TE/TR) = 1.05/2.64 ms, flip angle (FA) = 12°, matrix = 256x256, field of view (FOV) = 300 x 300 mm2, slice thickness = 5 mm, number of averages (NA) = 1). The temporal resolution was 2.49 s. and sequential images were acquired from 30 s before i.v. administration of contrast medium to 6.3 min after contrast injection. At 2 min post contrast medium administration, a pause of 33 s was utilized to acquire axial oblique T1-weighted gradient-echo contrast-enhanced images.
Regions of interests (ROIs) were drawn within the endometrial tumour by a radiologist (ISH with > 7 years of experience with pelvic MRI) who was blinded for tumour stage, histological diagnosis and patient outcome. Care was taken to avoid including necrotic and haemorrhagic areas of the tumours in the ROIs. The dynamic image series were analysed using an in-house implementation of the adiabatic approximation model of Johnson and Wilson [18]. Representative diagnostic MRI images and parametric DCE-MRI maps illustrating endometrial tumours with high and low blood flow (Fb) are shown in Figure 4.
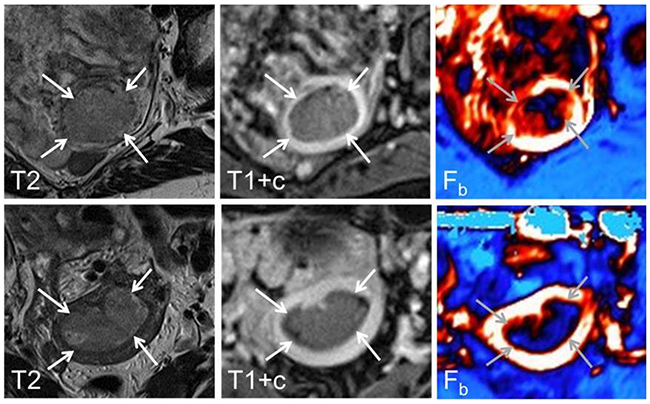
Figure 4: Axial oblique T2-weighted MRI (left panel), contrast-enhanced T1-weighted MRI (middle panel) and parametric blood flow (Fb, right panel) map from a 68 year-old patient with FIGO stage 1B, grade 3 and high tumour Fb (upper panel) and a 52 year-old patient with FIGO stage 1B, grade 1 and low tumour Fb (lower panel). At conventional diagnostic MRI the endometrial carcinomas (arrows) are typically depicted as hyper-intense relative to the surrounding myometrium on T2-weigthed image while hypo-intense on contrast-enhanced T1-weighed image. On the corresponding parametric maps high blood flow is depicted as white/red while low blood flow is depicted as dark blue.
Metabolomic analyses
Tissue samples (50–70 mg) were homogenized using 20 volumes of cold methanol as previously described [14]. Metabolite extracts were subjected to mass spectrometry using an HPLC 1290 series coupled to an ESI-Q-TOF MS/MS 6520 (Agilent Technologies, Santa Clara, CA, USA) as previously described [14]. Multivariate statistic analyses were performed using Metaboanalyst platform [19]. The preliminary identification of differential metabolites (Student’s T-Test, Benjamini Hochberg False Discovery Rate, p<0.05) was performed using the PCDL database from Agilent (Agilent Technologies, Barcelona, Spain), which accounts retention times in a standardized chromatographic system, exact mass and isotope distribution as an orthogonal searchable parameters to complement accurate mass data (AMRT approach) according to previously published works [14]. The version of the PCDL database used had retention times and accurate mass data for 679 compounds. To complete the identification process we searched for unidentified metabolites in Metlin Database (https://metlin.scripps.edu/index.php) which includes accurate masses and MS/MS spectrum for 961.829 molecules.
Ethical approval
All procedures performed in studies involving human participants were in accordance with the ethical standards of the institutional research committee and with the 1964 Declaration of Helsinki and its later amendments or comparable ethical standards. Written informed consent was obtained from all patients for the collection of imaging data and specimens for biomarker studies; included in an institutional review board-approved protocol (Rek Vest 2009/2315). This article does not contain any studies with animals performed by any of the authors.
Abbreviations
EC: Endometrial Cancer; DCE-MRI: Dynamic Contrast-Enhanced Magnetic Resonance Imaging; Fb: Blood Flow; FIGO: Federation International of Gynecology and Obstetrics; LPL: Lysophospholipids; RF: Random Forest; ROC: Receiver operating characteristics; ROI: Region of Interest; PCA: Principal Component Analysis; PLS-DA: Partial Least Discriminate Analysis
Author contributions
Conceive experiments: NE, MJ, MPO, RP, ISH and XMG
Carry out experiments: NE, MJ, SG, KEF, JT and CK
Analyze data: MJ, JS, KEF, JT, CK, ISH and XMG
Write the paper: NE, MJ, MPO, RP, CK, ISH and XMG
Generation of the figures: MJ, KEF, SG, JT, CK, KEF and ISH
Approve the submitted version: All authors
CONFLICTS OF INTEREST
None.
FUNDING
Supported by grants, PI13/01701 and PI16/00692 from Fondo de Investigaciones Sanitarias del Instituto de Salud Carlos III cofinanciado por Fondo Europeo de Desarrollo Regional (FEDER) (“Una manera de hacer Europa”), Red Temática de investigación en Cáncer RD12/0036/0013 and Red de Oncología (CIBERONC-ONCG33/2017) and the Department of Health from the Generalitat of Catalonia (SLT002/16/00250). Grups consolidats de la Generalitat de Catalunya (2009SGR794 and 2014SGR168), Fundació La Marató de TV3 (2/C2013), Grupos estables AECC, Plataforma de Biobancos ISCIII (PT13/0010/0014) and ENITEC NETWORK. NE holds a postdoctoral fellowship from Generalitat de Catalunya (SLT002/16/00274).
The funders had no role in study design, data collection and analysis, decision to publish, or preparation of the manuscript.
REFERENCES
1. Ferlay J, Soerjomataram I, Dikshit R, Eser S, Mathers C, Rebelo M, Parkin DM, Forman D, Bray F. Cancer incidence and mortality worldwide: sources, methods and major patterns in GLOBOCAN 2012. Int J Cancer. 2015; 136:E359–86. https://doi.org/10.1002/ijc.29210.
2. Salvesen HB, Haldorsen IS, Trovik J. Markers for individualised therapy in endometrial carcinoma. Lancet Oncol. 2012; 13:e353–61. https://doi.org/10.1016/S1470-2045(12)70213-9.
3. Eritja N, Yeramian A, Chen BJ, Llobet-Navas D, Ortega E, Colas E, Abal M, Dolcet X, Reventos J, Matias-Guiu X. Endometrial Carcinoma: Specific Targeted Pathways. Adv Exp Med Biol. 2017; 943:149–207. https://doi.org/10.1007/978-3-319-43139-0_6.
4. Hanahan D, Weinberg RA. Hallmarks of cancer: the next generation. Cell. 2011; 144:646–74. https://doi.org/10.1016/j.cell.2011.02.013.
5. Baluk P, Morikawa S, Haskell A, Mancuso M, McDonald DM. Abnormalities of basement membrane on blood vessels and endothelial sprouts in tumors. Am J Pathol. 2003; 163:1801–15. https://doi.org/10.1016/S0002-9440(10)63540-7.
6. Haldorsen IS, Stefansson I, Grüner R, Husby JA, Magnussen IJ, Werner HM, Salvesen ØO, Bjørge L, Trovik J, Taxt T, Akslen LA, Salvesen HB. Increased microvascular proliferation is negatively correlated to tumour blood flow and is associated with unfavourable outcome in endometrial carcinomas. Br J Cancer. 2014; 110:107–14. https://doi.org/10.1038/bjc.2013.694.
7. Stefansson IM, Salvesen HB, Akslen LA. Vascular proliferation is important for clinical progress of endometrial cancer. Cancer Res. 2006; 66:3303–09. https://doi.org/10.1158/0008-5472.CAN-05-1163.
8. Stefansson IM, Raeder M, Wik E, Mannelqvist M, Kusonmano K, Knutsvik G, Haldorsen I, Trovik J, Øyan AM, Kalland KH, Staff AC, Salvesen HB, Akslen LA. Increased angiogenesis is associated with a 32-gene expression signature and 6p21 amplification in aggressive endometrial cancer. Oncotarget. 2015; 6:10634–45. https://doi.org/10.18632/oncotarget.3521.
9. Haldorsen IS, Grüner R, Husby JA, Magnussen IJ, Werner HM, Salvesen OO, Bjørge L, Stefansson I, Akslen LA, Trovik J, Taxt T, Salvesen HB. Dynamic contrast-enhanced MRI in endometrial carcinoma identifies patients at increased risk of recurrence. Eur Radiol. 2013; 23:2916–25. https://doi.org/10.1007/s00330-013-2901-3.
10. Armitage EG, Barbas C. Metabolomics in cancer biomarker discovery: current trends and future perspectives. J Pharm Biomed Anal. 2014; 87:1–11. https://doi.org/10.1016/j.jpba.2013.08.041.
11. Trygg J, Holmes E, Lundstedt T. Chemometrics in metabonomics. J Proteome Res. 2007; 6:469–79. https://doi.org/10.1021/pr060594q.
12. Carmeliet P, Jain RK. Molecular mechanisms and clinical applications of angiogenesis. Nature. 2011; 473:298–307. https://doi.org/10.1038/nature10144.
13. Berg A, Fasmer KE, Mauland KK, Ytre-Hauge S, Hoivik EA, Husby JA, Tangen IL, Trovik J, Halle MK, Woie K, Bjørge L, Bjørnerud A, Salvesen HB, et al. Tissue and imaging biomarkers for hypoxia predict poor outcome in endometrial cancer. Oncotarget. 2016; 7:69844–56. https://doi.org/10.18632/oncotarget.12004.
14. Jové M, Gatius S, Yeramian A, Portero-Otin M, Eritja N, Santacana M, Colas E, Ruiz M, Pamplona R, Matias-Guiu X. Metabotyping human endometrioid endometrial adenocarcinoma reveals an implication of endocannabinoid metabolism. Oncotarget. 2016; 7:52364–74. https://doi.org/10.18632/oncotarget.10564.
15. Brachmann SM, Kleylein-Sohn J, Gaulis S, Kauffmann A, Blommers MJ, Kazic-Legueux M, Laborde L, Hattenberger M, Stauffer F, Vaxelaire J, Romanet V, Henry C, Murakami M, et al. Characterization of the mechanism of action of the pan class I PI3K inhibitor NVP-BKM120 across a broad range of concentrations. Mol Cancer Ther. 2012; 11:1747–57. https://doi.org/10.1158/1535-7163.MCT-11-1021.
16. Rolin J, Maghazachi AA. Effects of lysophospholipids on tumor microenvironment. Cancer Microenviron. 2011; 4:393–403. https://doi.org/10.1007/s12307-011-0088-1.
17. Connor KM, SanGiovanni JP, Lofqvist C, Aderman CM, Chen J, Higuchi A, Hong S, Pravda EA, Majchrzak S, Carper D, Hellstrom A, Kang JX, Chew EY, et al. Increased dietary intake of omega-3-polyunsaturated fatty acids reduces pathological retinal angiogenesis. Nat Med. 2007; 13:868–73. https://doi.org/10.1038/nm1591.
18. St Lawrence KS, Lee TY. An adiabatic approximation to the tissue homogeneity model for water exchange in the brain: I. Theoretical derivation. J Cereb Blood Flow Metab. 1998; 18:1365–77. https://doi.org/10.1097/00004647-199812000-00011.
19. Xia J, Wishart DS. Using MetaboAnalyst 3.0 for Comprehensive Metabolomics Data Analysis. Curr Protoc Bioinformatics. 2016; 55:14.10.1–14. https://doi.org/10.1002/cpbi.11.