
INTRODUCTION
Colorectal cancer (CRC) occurs in an estimated 376,300 new cases and 191,000 deaths in 2015 in China [1]. Tumor progression is dictated by the intimately continuous interaction between malignant cells and the tumor microenvironment such as immune effector molecules and immune regulatory factors, and infiltration of various immune cells [2, 3]. Unfortunately, tumor cells have developed various strategies to avoid recognition and destruction by the host immune milieus, and the resistant variants eventually results in cancer [4].
The immune suppressive molecule human leukocyte antigen G (HLA-G), is rarely observed in normal adult tissues. However, it is found frequently neoexpressed in most tumor cells as cell membrane-bound or soluble forms [5]. Amounts of in vitro and in vivo evidence showed HLA-G could directly interact with its receptors expressed on almost all types of immune cells or by the pathway of “trogocytosis”, revealing a broad immune inhibiting function on both innate and adaptive immune responses [6]. In clinical settings and animal models, earlier studies have demonstrated the aberrant neoexpressed HLA-G in various types of cancers was related to advanced tumor grade, more aggressive behavior and worse disease outcome [7].
To be mentioned, we recently found that levels of peripheral soluble HLA-G in CRC patients were strongly related to prognosis, and it could improve the prognostic value by traditional prognosticators [8]. Indeed, different proportion of lesion HLA-G expression has been found between different cancer types and also between tumors from individuals with the same type of cancer, and the prognostic significance of the different degree of HLA-G expression remains rather limited. With the combination of lesion HLA-G expression percentages, we also aim to evaluate whether it could improve the prognostic value of traditional clinical prognosticators.
In the current study, HLA-G expression in 457 primary colorectal cancer lesions was analyzed with immunohistochemistry, and the differential lesion HLA-G expression for prognostic stratification with traditional prognosticators was analyzed.
RESULTS
HLA-G expression in primary CRC lesions
Different proportion of HLA-G expression was found and its expression in CRC lesions was from negative to 99% (Figure 1). Overall, 70.7% (323/457) of primary CRC samples were HLA-G positive, which was positive in 76.7% of the colon (178/232) and 64.4% of the rectal carcinoma lesions (145/225), respectively (Table 1).
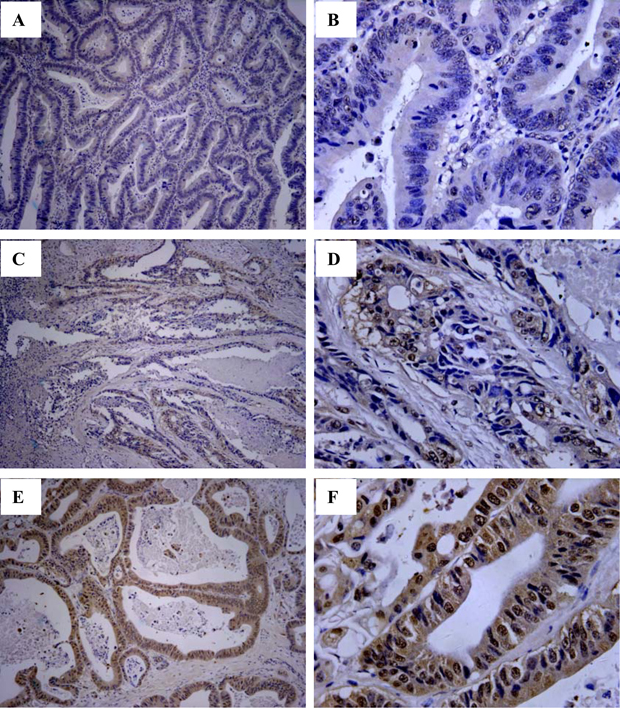
Figure 1: Immunohistochemistry analysis of HLA-G expression in primary CRC lesions. Representative staining of negative (A and B), and positive expression (C and D; E and F) of HLA-G in CRC lesions. Original magnification: A, C, E (100×) and B, D, F (400×).
Table 1: Association of lesion HLA-G expression with clinical parameters in CRC patients
Variables |
No. of cases |
HLA-G expression (5%, HLA-GLow) |
HLA-G expression (55%, HLA-GHigh) |
||||
|---|---|---|---|---|---|---|---|
Neg. |
Pos. (%) |
p* |
Neg. |
Pos. (%) |
p* |
||
Histological type |
457 |
134 |
323 (70.7) |
158 |
299 (65.4) |
||
Colon carcinoma |
232 |
54 |
178 (76.7) |
0.004 |
64 |
168 (72.4) |
0.001 |
Rectal carcinoma |
225 |
80 |
145 (64.4) |
94 |
131 (58.2) |
||
Gender |
|||||||
Male |
268 |
84 |
184 (68.7) |
0.258 |
99 |
169 (62.7) |
0.205 |
Female |
189 |
50 |
139 (73.0) |
59 |
130 (68.8) |
||
Age |
|||||||
≤median (66 ys) |
239 |
67 |
172 (72.0) |
0.526 |
85 |
154 (64.4) |
0.641 |
>median |
218 |
67 |
151 (69.3) |
73 |
145 (66.5) |
||
TNM stage |
|||||||
Tumor status |
|||||||
T1+2 |
113 |
28 |
85 (75.2) |
0.128 |
34 |
79 (70.6) |
0.147 |
T3 |
319 |
96 |
233 (69.9) |
113 |
205 (64.3) |
||
T4 |
19 |
9 |
10 (52.6) |
10 |
9 (47.4) |
||
Nodal status |
|||||||
N0 |
242 |
68 |
174 (71.9) |
0.826 |
83 |
159 (65.7) |
0.997 |
N1 |
132 |
41 |
91 (68.9) |
45 |
87 (65.9) |
||
N2 |
81 |
23 |
58 (71.6) |
28 |
53 (65.4) |
||
Metastasis status |
|||||||
M0 |
441 |
131 |
310 (70.3) |
0.344 |
155 |
286 (64.9) |
0.176 |
M1 |
16 |
3 |
13 (81.3) |
3 |
13 (81.3) |
||
Disease stage |
|||||||
I |
90 |
24 |
66 (73.3) |
0.695 |
29 |
61 (67.8) |
0.522 |
II |
149 |
44 |
105 (70.5) |
54 |
95 (63.8) |
||
III |
200 |
62 |
138 (69.0) |
71 |
129 (64.5) |
||
IV |
16 |
3 |
13 (81.3) |
3 |
13 (81.3) |
||
*Comparison of HLA-G expression status between or among each variable using the Pearson chi-square test. TNM, lymph-node-metastasis and stage according to the TNM classification.
Kaplan–Meier survival analysis was performed to determine the minimum proportion of HLA-G expression which reaches statistic significance to patient survival. Data showed that, with the percentage at 5% as the cut-off value, HLA-G expression wasn’t associated with the patient survival (p = 0.109), while HLA-G expression above 55% reached significantly to the patient survival (p = 0.042; Table 2). Base on this data, the different proportion of HLA-G expression in CRC lesions was divided into two groups as HLA-GLow (cut-off = 5%) and HLA-GHigh (cut-off = 55%) in this study.
Table 2: Log-rank Mantel–Cox analysis of clinical parameters in survival in CRC patients
Variables |
No. Total |
No. Events |
Mean survival |
95% CI |
p value |
|
|---|---|---|---|---|---|---|
Histological type |
Colon |
216 |
74 |
73.8 |
68.5–79.2 |
0.172 |
Rectal |
201 |
78 |
62.5 |
57.8–67.2 |
||
Sex |
Male |
247 |
90 |
71.4 |
66.4–76.4 |
0.830 |
Female |
170 |
62 |
71.2 |
65.0–77.4 |
||
Age |
≤ 66 ys |
215 |
75 |
73.7 |
68.4–79.0 |
0.219 |
> 66 ys |
202 |
77 |
68.7 |
63.0–74.4 |
||
Tumor status |
T1+2 |
102 |
21 |
83.4 |
76.5–90.3 |
<0.001 |
T3 |
292 |
117 |
67.9 |
63.2–72.7 |
||
T4 |
18 |
11 |
54.8 |
36.5–73.1 |
||
Nodal status |
N0 |
217 |
50 |
83.5 |
78.7–88.2 |
<0.001 |
N1 |
126 |
62 |
60.3 |
53.2–67.5 |
||
N2 |
72 |
40 |
51.5 |
41.5–61.5 |
||
Metastasis status |
M0 |
401 |
142 |
72.6 |
68.6–76.5 |
0.003 |
M1 |
16 |
10 |
46.3 |
25.2–67.5 |
||
Clinical stage |
I |
81 |
12 |
85.4 |
78.8–91.9 |
<0.001 |
II |
133 |
36 |
80.4 |
74.1–86.7 |
||
III |
185 |
93 |
58.0 |
52.0–64.0 |
||
IV |
16 |
10 |
46.3 |
25.2–67.5 |
||
HLA-GLow |
<5% |
121 |
38 |
76.7 |
70.0–83.5 |
0.109 |
>5% |
296 |
114 |
68.5 |
64.0–73.2 |
||
HLA-GHigh |
<55% |
144 |
46 |
77.4 |
71.4–83.4 |
0.042 |
>55% |
273 |
106 |
67.7 |
62.7–72.6 |
||
Abbreviations: 95% CI = 95% confidence interval; TNM, lymph-node-metastasis and stage according to the TNM classification.
Association between and HLA-G expression and clinical parameters
Data showed that (Table 1), a higher proportion of HLA-G expression was observed in colon carcinoma than that in rectal carcinoma lesions [HLA-GLow:76.7% (178/232) vs. 64.4% (145/225), p = 0.004; HLA-GHigh:72.4% (168/232) vs. 58.2% (131/225), p = 0.001], while no significance was found between the HLA-G expression and patient sex, age, primary tumor burden (T), regional lymph node status (N), distant metastases (M), and clinical disease stage. Also, no significant difference was observed for the relationship between the HLA-G expression and the clinical parameters either in colon or in rectal carcinoma patients (Supplementary Table 1).
HLA-G status and clinical parameters to CRC patient survival
Herein, HLA-G status and clinical parameters such as tumor histological type, patient sex, age, TNM categories, and clinical disease stage to the clinical outcome of CRC patients was evaluated. Data revealed that HLA-GLow was not associated with patient prognosis (p = 0.109; Figure 2A). The mean survival for the HLA-G (<5%) and (>5%) in HLA-GLow group was 76.7 months (n = 121; 95% CI: 70.0–83.5) and 68.5 months (n = 296; 95% CI: 64.0–73.2), respectively (Table 2). However, HLA-GHigh was significantly related to the prognosis (p = 0.042, Figure 2B), where patients with HLA-G (>55%) had a worse outcome than patients with HLA-G (<55%) in HLA-GHigh group. The mean survival for HLA-G (<55%) and (>55%) in HLA-GHigh group was 77.4 months (n = 144; 95% CI: 71.4–83.4) and 67.7 months (n = 273; 95% CI: 62.7–72.6), respectively (Table 2).
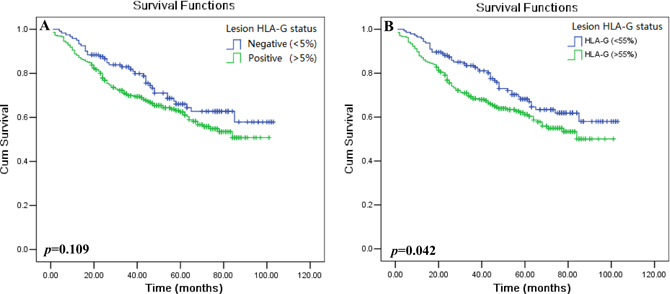
Figure 2: Kaplan–Meier survival analysis of HLA-G expression in CRC patients. Comparison of the overall survival (A) between HLA-G negative and HLA-G positive patients with the cut-off = 5% (HLA-GLow; p = 0.109), and (B) between HLA-G negative and HLA-G positive patients with the cut-off = 55% (HLA-GHigh; p = 0.042).
Among other clinicopathological variables, T, N, M categories and clinical disease stage was found significantly related to survival (Table 2, Figure 3). Patients with T1+2 [n = 102, mean: 83.4 months (95% CI: 76.5–90.3)] survived obviously longer than patients with T3 [n = 292; mean: 67.9 months (95% CI: 63.2–72.7)] or T4 [n = 18; mean: 54.8 months (95% CI: 36.5–73.1), p < 0.001]. Patients with N0 [n = 217, mean: 83.5 months (95% CI: 78.7–88.2)] had a better survival time than those with N1 [n = 126; mean: 60.3 months (95% CI: 53.2–67.5)] and N2 [n = 72; mean: 51.5 months (95% CI: 41.5–61.5), p < 0.001]. Patients with M0 (n = 401) had a better survival time than those with M1 [n = 16; mean: 72.6 months (95% CI: 68.6–76.5) vs. 46.3 months (95% CI: 25.2–67.5), p = 0.003]. Patients with stage I+II (n = 213) had a longer survival than those with stage III+IV [n = 201; mean: 83.7 months (95% CI: 79.2–88.7) vs. 57.2 months (95% CI: 51.4–63.0), p < 0.001]. The mean survival for stage I, I, III and IV was 85.4, 80.4, 58.0 and 46.3 months, respectively. However, CRC tumor histological type (p = 0.172), sex (p = 0.830) and patient age (p = 0.219) was not associated with patient survival.
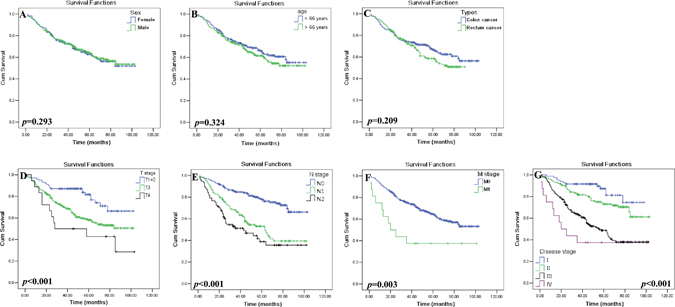
Figure 3: Kaplan–Meier survival analysis of clinical parameters in CRC patients. Comparison of the overall survival between the (A) male (n = 247) and female (n = 170) patients (p = 0.293); (B) patients with age above (n = 202) and below (n = 215) the median of 66 years (p = 0.324); (C) tumor histological types of colon (n = 216) and rectal (n = 201) cancer (p = 0.209); (D) primary tumor status T1+2 (n = 102), T3 (n = 292) and T4 (n = 18; p < 0.001); (E) regional lymphnode status N0 (n = 217), N1 (n = 126) and N2 (n = 72; p < 0.001); (F) tumor metastasis status M0 (n = 401) and M1 (n = 16; p = 0.003); and (G) disease stages I (n = 81) , II (n = 133), III (n = 185) and IV (n = 16; p < 0.001) of CRC patients.
Univariate analysis with Cox’s proportional hazards model showed that clinical parameters including burden of primary tumor (T3+4 vs. T1+2, HR = 2.302, p < 0.001), regional lymph node status (N1+2 vs. N0, HR = 3.071, p < 0.001), distant metastases (M1 vs. M0, HR = 2.529, p = 0.005), and clinical disease stage (III + IV vs. I + II, HR = 3.162, p < 0.001) was significantly associated with a poor prognosis. For the HLA-G expression status, HLA-GLow (>5% vs. <5%, HR = 1.348, p = 0.111) wasn’t related to the prognosis, while HLA-GHigh (>55% vs. <55%), HR = 1.428, p = 0.044) was associated with the prognosis (Table 3).
Table 3: Cox proportional hazards model analysis of variables in survival by HLA-GLow or HLA-GHigh expression in CRC patients
Variables |
Categories |
Univariate Analysis |
Multivariate Analysis |
||||
|---|---|---|---|---|---|---|---|
HLA-GLow |
HLA-GHigh |
HR (95% CI) |
P |
HR (95% CI) |
P |
HR (95% CI) |
P |
Histological type |
Rectal vs.Colon |
1.248 (0.907–1.718) |
0.174 |
||||
Sex |
Female vs. Male |
1.036 (0.750–1.432) |
0.931 |
||||
Age (years) |
>66 vs. ≤ 66 |
1.220 (0.887–1.678) |
0.221 |
||||
Tumor status |
T3+4 vs. T1+2 |
2.302 (1.451–3.654) |
<0.001 |
1.679 (1.041–2.708) |
0.034 |
1.694 (1.050–2.724) |
0.031 |
Nodal status |
N1+2 vs. N0 |
3.071 (2.184–4.318) |
<0.001 |
1.416 (0.176–11.38) |
0.744 |
1.428 (0.178–11.48) |
0.737 |
Metastasis status |
M1 vs.M0 |
2.529 (1.331–4.807) |
0.005 |
1.501 (0.727–3.099) |
0.273 |
1.458 (0.705–3.013) |
0.309 |
Clinical stage |
III+IV vs. I+II |
3.162 (2.239–4.465) |
<0.001 |
1.981 (0.238–16.48) |
0.527 |
1.958 (0.235–16.29) |
0.534 |
HLA-GLow cut-off = 5% |
Pos (>5%) vs. Neg (<5%) |
1.348 (0.933–1.946) |
0.111 |
1.423 (0.982–2.061) |
0.062 |
/ |
/ |
HLA-GHigh cut-off = 55% |
Pos (>55%) vs. Neg (<55%) |
1.428 (1.010–2.021) |
0.044 |
/ |
/ |
1.481 (1.043–2.104) |
0.028 |
Abbreviations: HR = hazard ratio; 95% CI = 95% confidence interval; TNM, lymph-node-metastasis and stage according to the TNM classification.
Multivariate analysis revealed that, HLA-GHigh (HR = 1.481, p = 0.028) but not HLA-GLow (HR = 1.423, p = 0.062), represented as an independent prognostic factor for CRC patients. Moreover, among traditional clinicopathological prognosticators, only the category of primary tumor burden (T) was found to be an independent prognostic factor when taking the status of HLA-GLow (THR = 1.694, p = 0.031) and HLA-GHigh (THR = 1.694, p = 0.031) as covariates respectively (Table 3).
Significance of HLA-G status on the prognostic value of clinical parameters in CRC patients
Furthermore, we analyzed the prognostic significance of HLA-G status with stratification of clinical parameters in CRC patients. Briefly, The tumor histological type was stratified to colon and rectal carcinoma, patient sex to male and female, age to below and above the median age (66 years), categories T to T1, T2,T3 and T4; N to N0, N1 and N2; M status to M0 and M1, and clinical stage to I, II, III and IV, respectively.
Kaplan–Meier survival analysis revealed that both HLA-GLow and HLA-GHigh status could significantly affects the CRC patient survival when clinical parameters were stratified. To be noted, HLA-GLow status (Table 4) was less powerful than the HLA-GHigh status (Table 5) in affecting the patient survival between stratified clinical parameters. Data showed female patients whose HLA-G above the cut-off 5% (HLA-GLow) have a marked worse survival than those below the 5% level (mean: 63.5 months vs. 82.6 months, p = 0.042; Figure 4Ab). Similarly, the elder patients have worse survival with HLA-G above 5% (HLA-GLow) than those HLA-G expression was lower (mean: 61.3 months vs. 77.9 months, p = 0.037; Figure 4Bb). Furthermore, patients with HLA-G expression above the cut-off 55% (HLA-GHigh) have dramatically worse survival than those HLA-G expression was lower among the female (mean: 59.1 months vs 83.5 months, p = 0.013; Figure 4Ad), the elder patients (mean: 60.0 months vs. 78.2 months, p = 0.023; Figure 4Bd), and patients with colon carcinoma (mean: 68.1 months vs 84.8 months, p = 0.016; Figure 4Cd ), stage of T3+4 (mean: 62.5 months vs. 74.8 months, p = 0.018; Figure 4Dd), N1+2 (mean: 52.7 months vs. 65.4 months, p = 0.044; Figure 4Ed), and disease stage III+IV (mean: 52.7 months vs. 65.7 months, p = 0.037; Figure 4Gd ).
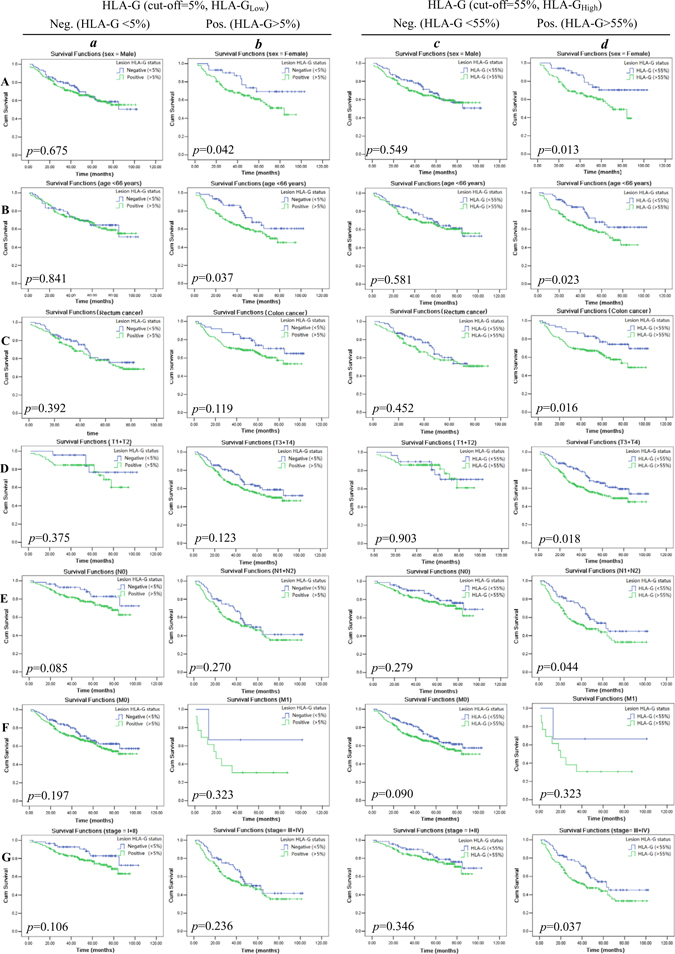
Figure 4: Kaplan–Meier survival analysis of stratified clinical parameters in survival by lesion HLA-G expression (HLA-GLow; A~G-a and -b) and (HLA-GHigh; A~G-c and -d) in CRC patients, respectively. Stratified clinical parameters (A) male and female patients; (B) patients with age above and below the median of 66 years; (C) tumor histological types of colon and rectal cancer; (D) primary tumor status T1+2 and T3+4; (E) regional lymph node status N0 and N1+2; (F) tumor metastasis status M0 and M1; and (G) disease stages I + II and III + IV of CRC patients.
Table 4: Log-rank Mantel–Cox analysis of stratified variables in survival by lesion HLA-G expression with the cut-off value = 5% (HLA-GLow) in CRC patients
Variables |
Stratified variables |
HLA-G <5% |
HLA-G >5% |
|||||||
|---|---|---|---|---|---|---|---|---|---|---|
No. Total |
No. Events |
Mean survival |
95% CI |
No. Total |
No. Events |
Mean survival |
95% CI |
p value |
||
Histological type |
Colon |
49 |
14 |
82.4 |
73.1–91.8 |
167 |
60 |
70.2 |
64.0–76.4 |
0.094 |
Rectal |
72 |
24 |
60.7 |
54.0–67.5 |
129 |
54 |
61.1 |
55.2–67.0 |
||
Sex |
Male |
79 |
28 |
72.8 |
64.2–81.3 |
168 |
62 |
70.3 |
64.3–76.4 |
0.114 |
Female |
42 |
10 |
82.6 |
71.8–93.4 |
128 |
52 |
63.5 |
56.9–70.0 |
||
Age |
≤66 ys |
60 |
20 |
74.1 |
63.9–84.4 |
155 |
55 |
72.4 |
66.3–78.4 |
0.097 |
>66 ys |
61 |
18 |
77.9 |
68.9–87.0 |
144 |
59 |
61.3 |
54.8–67.7 |
||
Tumor status |
T1+2 |
23 |
4 |
89.8 |
79.2–100.4 |
78 |
17 |
75.9 |
68.5–83.3 |
0.060 |
T3 |
87 |
28 |
75.0 |
66.9–83.1 |
205 |
89 |
64.5 |
58.8–70.1 |
||
T4 |
9 |
6 |
53.2 |
27.9–78.5 |
9 |
5 |
50.3 |
29.171.5 |
||
Nodal status |
N0 |
58 |
9 |
90.3 |
82.7–97.9 |
159 |
41 |
76.0 |
71.0–81.0 |
0.069 |
N1 |
40 |
19 |
64.1 |
52.2–75.9 |
86 |
43 |
58.6 |
49.9–67.3 |
||
N2 |
21 |
10 |
57.6 |
38.4–76.8 |
51 |
30 |
43.4 |
34.3–52.6 |
||
Metastasis status |
M0 |
118 |
37 |
76.8 |
69.9–83.7 |
283 |
105 |
69.8 |
65.2–74.5 |
0.128 |
M1 |
3 |
1 |
71.7 |
24.7–118.6 |
13 |
9 |
36.2 |
17.1–55.3 |
||
Clinical stage |
I |
20 |
2 |
91.4 |
82.9–99.8 |
61 |
10 |
79.9 |
72.0–87.7 |
0.062 |
II |
38 |
7 |
87.1 |
76.7–97.6 |
95 |
29 |
73.2 |
66.6–79.9 |
||
III |
59 |
28 |
62.0 |
51.8–72.3 |
126 |
65 |
56.1 |
48.8–63.4 |
||
IV |
3 |
1 |
71.7 |
24.7–118.6 |
13 |
9 |
36.2 |
17.1–55.3 |
||
Abbreviations: 95% CI = 95% confidence interval; TNM, lymph-node-metastasis and stage according to the TNM classification.
Table 5: Log-rank Mantel–Cox analysis of stratified variables in survival by lesion HLA-G expression with the cut-off value = 55% (HLA-GHigh) in CRC patients
Variables |
Stratified variables |
HLA-G <55% |
HLA-G >55% |
|||||||
|---|---|---|---|---|---|---|---|---|---|---|
No. Total |
No. Events |
Mean survival |
95% CI |
No. Total |
No. Events |
Mean survival |
95% CI |
p value |
||
Histological type |
Colon |
59 |
15 |
84.8 |
76.6–93.0 |
157 |
59 |
68.1 |
61.5–74.7 |
0.030 |
Rectal |
85 |
31 |
60.8 |
55.0–66.8 |
116 |
47 |
60.8 |
54.4–67.2 |
||
Sex |
Male |
94 |
35 |
73.4 |
65.8–81.0 |
153 |
56 |
70.0 |
63.6–76.4 |
0.043 |
Female |
50 |
12 |
83.5 |
74.1–93.0 |
120 |
50 |
59.1 |
53.0–65.2 |
||
Age |
≤66 ys |
77 |
26 |
75.9 |
67.4–84.3 |
138 |
49 |
71.6 |
65.0–78.2 |
0.045 |
>66 ys |
67 |
20 |
78.2 |
69.6–86.7 |
135 |
57 |
60.0 |
53.5–66.6 |
||
Tumor status |
T1+2 |
30 |
7 |
85.1 |
74.2–95.9 |
72 |
14 |
77.1 |
69.5–84.8 |
0.016 |
T3 |
103 |
33 |
76.4 |
69.3–83.5 |
189 |
84 |
62.9 |
56.9–68.9 |
||
T4 |
10 |
6 |
58.9 |
34.0–83.8 |
8 |
5 |
45.1 |
23.8–66.5 |
||
Nodal status |
N0 |
73 |
15 |
87.5 |
80.5–94.4 |
144 |
35 |
75.7 |
70.4–81.0 |
0.027 |
N1 |
44 |
20 |
66.0 |
54.9–77.1 |
82 |
42 |
57.6 |
48.7–66.6 |
||
N2 |
25 |
11 |
63.3 |
46.5–80.1 |
47 |
29 |
40.0 |
30.5–49.4 |
||
Metastasis status |
M0 |
141 |
45 |
77.5 |
71.5–83.6 |
260 |
97 |
69.0– |
64.0–74.0 |
0.057 |
M1 |
3 |
1 |
71.7 |
24.7–118.6 |
13 |
9 |
36.2 |
17.1–55.3 |
||
Clinical stage |
I |
25 |
5 |
84.4 |
73.7–94.9 |
56 |
7 |
82.3 |
74.3–90.3 |
0.022 |
II |
48 |
10 |
86.9 |
78.0–95.8 |
85 |
26 |
69.9 |
63.1–76.8 |
||
III |
67 |
30 |
65.4 |
56.0–74.8 |
118 |
63 |
53.9 |
46.2–61.4 |
||
IV |
3 |
1 |
71.6 |
24.7–118.6 |
13 |
9 |
36.2 |
9.8–17.1 |
||
Abbreviations: 95% CI = 95% confidence interval; TNM, lymph-node-metastasis and stage according to the TNM classification.
DISCUSSION
In some cancers, patients within the same TNM stage but their clinical outcomes varied significantly, such as rapid disease progression and cancer-related death with early stage; however, advanced stage cancer can remain stable for years in some patients is often seen [9]. The major reason for the limited predictive power of the traditional staging system is that relies only on the tumor cell characteristics but ignores the effects of the host immune response against the cancers [10]. Indeed, increasing evidence has documented host immune contexture in tumor microenvironment play a critical role in the prediction of prognosis, such as the prognostic value of CD3+, CD8+ and CD45RO+ T cell infiltration in CRCs [11, 12].
Among various factors of host immune contexture in tumor immunology, induction of an immunotolerant HLA-G expression by tumor cells has been observed in numerous tumoral tissues [13]. HLA-G have multiple immune inhibitory effects such as impairing T cell functions by inhibiting of proliferation and cytotoxicity, induction of apoptosis and expansion of regulatory T cells [5]. Moreover, HLA-G expression was found inversely related to the frequency of intratumoral lymphocyte infiltration such as CD8+ T cells or the numbers of peripheral activated T cells (CD8+CD28+ T cells) [14, 15]. Previous studies showed that tumor HLA-G expression was associated with advanced stage or worse clinical outcome and its potential as a prognostic biomarker has been intensively investigated [5]. In CRC patients, Guo et al. [16] evidenced HLA-G was significantly related to the overall survival of CRC patients and it could be an independent prognosticator, similar findings were obtained in a study by Ye et al. [17]. Recently, Kuppen and colleagues [18, 19] found that absence of HLA-G expression indicated a better survival for colon cancer patients and weak expression of HLA-G revealed a worse survival in rectal cancer patients.
Our findings in the current study revealed that different proportion of HLA-G expression in CRC lesions is of significance to the patient survival or prognosis. Analogously, in our recent study, patients with higher levels of peripheral sHLA-G had a significantly worse survival than those with lower levels, and sHLA-G was considered as an independent prognostic factor for CRC patients. Moreover, with stratification of clinical parameters in survival by sHLA-Glow and sHLA-Ghigh, could improve the prognostic power by traditional prognosticators in CRC patients [8]. Our previous in vitro studies had reported that inhibition of NK cytolysis is dependent on the proportion of HLA-G expression. In these studies, data showed that the power of HLA-G in NK cell cytotoxicity was dependent on the level of both HLA-G1 and HLA-G5 expression, and HLA-G1 and HLA-G5 have an additive effect on the NK cell cytolysis suppression [20]. Importantly, a significant inhibition would be reached when the HLA-G expression was more than 60% [21]. Thus, it’s reasonable to speculate that the different proportion of HLA-G expression in tumor lesions could influence disease progression and clinical outcome.
In consistent with our mentioned above findings, CRC lesion HLA-G expression status also could significantly affect the CRC patient survival with the stratified clinical parameters. Applying HLA-G expression above the cut-off level at 5% (HLA-GLow) as positive which were commonly used in previous studies, HLA-GLow was not significantly related to the CRC patient survival; however, when HLA-G expression above the level of 55% (HLA-GHigh), HLA-GHigh reaches a statistic significance point to a worse survival, which echoes a study by Kirana et al. [22] that high, but not negative and moderate local HLA-G expression was closely linked to the CRC patient survival.
Degree of HLA-G expression could be influenced by multiple factors and mechanisms are complex. HLA-G genetic variation such as polymorphisms in 5′upstream regulatory region and 3′untranslated regions affects the affinity of targeted gene for transcriptional or post-transcriptional factors [23], epigenetic pathways through DNA methylation and histone modifications [24], post-transcriptional mechanisms by and microRNAs [25], as well as environmental factors including various cytokines, growth factors and hormones [26]. However, mechanisms underlying the individual or tumor-specific expression of HLA-G are required to be explored. Moreover, different proportion of lesion HLA-G expression has been found between different cancer types, between tumors from individuals with the same type of cancer, and even between the different intra-tumor areas within a single sample. In this context, Rouas-Freiss et al. recently reported that HLA-G and other immune molecules such as PD1/PDL1,ILT2/4 were heterogeneous expressed in the various areas of the same tumor [27]. These findings further highlights more detail and comprehensive evaluation of the intra- and inter- heterogeneity of HLA-G expression is necessary for explore the clinical significance the HLA-G in tumor biology.
Finally, our data showed that HLA-GHigh status was powerful in affecting the patient survival when clinical parameter was stratified. Among female patients, the elder patients, colon carcinoma patients, stage of T3+4, N1+2, and stage III+IV whose HLA-G expression above the cut-off 55% (HLA-GHigh) have dramatically poor survival than those with lower HLA-G expression. In serous ovarian carcinoma, a study by Andersson et al. [14] revealed that HLA-G expression was correlated to a significant worse prognosis in patients with the genotype HLA-A*02. These data indicated that HLA-G expression status together with other clinical parameters, tumor microenvironment factors is possible to discriminate subpopulations and identify patients with even worse prognosis.
Our study demonstrated that different proportion of HLA-G expression in CRC patients influence the patient survival and a combination of HLA-G expression status with traditional clinical risk factors could refine the prediction of specific clinical outcomes of the subpopulations of CRC patients. Taken together, lesion HLA-G expression percentages in patients with CRC could be another prognostic factor which contributes an additional significance to the classical cancer TNM classification system.
MATERIALS AND METHODS
Colorectal cancer patients
Consecutive 457 colorectal cancer lesions including 232 primary colon carcinomas and 225 rectal carcinomas were obtained from patients diagnosed at Taizhou Hospital of Zhejiang Province from November 9th, 2004 to September 12th, 2012. Biosamples were provided by the Tissue Bank of Taizhou Hospital of Zhejiang Province, National Human Genetic Resources Sharing Service Platform (2005DKA21300).
Patient data including age (median: 66 years; range:26 years-90 years), gender (nmale = 268; nfemale = 189), date of initial diagnosis and surgical operation, TNM status including size and extent of primary tumor (T), regional lymph node status (N) and distant metastases (M), and clinical disease stage were documented. The clinical stage classification follows the 7th TNM staging system by UICC and the AJCC [28]. All specimens were pathologically confirmed. All samples were anonymously analyzed in accordance with the Declaration of Helsinki. The study protocol was approved by the Ethical Board of the Taizhou Hospital of Zhejiang Province and a written informed consent was obtained from all patients.
Clinical stage of 455 cases was available among 457 cases. There were 90, 149, 200 and 16 patients with clinical stage I, II, III and IV, respectively. Of them, 417 patients were followed till the last follow-up at May 3rd, 2012. Overall survival was defined from the surgical operation date to the patient death (event) or last follow-up (censored) with the median follow-up of 46.5 months (range: 1–103 months), and 152 cancer-related deaths were occurred which includes 12 (15.0%) stage I, 36 (27.1%) stage II, 93 (50.3%) stage III and 10 (62.5%) stage IV patients, respectively.
Immunohistochemistry and staining evaluation
The four-micrometer paraffin-embedded sections were dewaxed and rehydrated, and incubated overnight at 4oC with the anti-HLA-G mAb 4H84 (1:500, Exbio, Prague, Czech Republic), then thoroughly washed. Finally, sections were stained with Dako EnVison kit (Dako, Glostrup, Denmark).
CRC lesion HLA-G expression was evaluated by two reviewers who have no knowledge of to clinical information for these patients. The percentage of positive cells was based on the presence or absence of HLA-G staining, irrespective of staining intensity. Percentage of HLA-G positive tumor cells was evaluated by each reviewer, and the average was calculated. A sample was considered as positive when HLA-G positive CRC cells was >5% [29].
Statistical analysis
SPSS 13.0 software (SPSS, Inc., Chicago, IL, USA) was used for statistical analysis. Categorical data were analyzed with Pearson chi-square test. Kaplan–Meier and log-rank test was performed for survival analysis. Relationship between the survival and variables were evaluated with the Cox regression method. Significant difference was considered as p < 0.05 (two-tailed).
Author contributions
Study design: AL WHY RLZ. Performed experiments: XZ SSD BH QYH. Material support and data acquisition: RLZ JGZ WJZ. Performed statistical analysis and drafted the manuscript: AL WHY. All authors read and approved the final manuscript.
ACKNOWLEDGMENTS
This work was supported by grants from National Natural Science Foundation of China (31370920, 81372247), Science and Technology Bureau of Zhejiang Province (2013C33112, 2016C33231) and by Zhejiang Provincial program for the cultivation of high-level innovative health talents.
CONFLICTS OF INTEREST
The authors have declared no financial/commercial conflicts of interest.
REFERENCES
1. Chen W, Zheng R, Baade PD, Zhang S, Zeng H, Bray F, Jemal A, Yu XQ, He J. Cancer statistics in China, 2015. CA Cancer J Clin. 2016; 66:115–132.
2. Bose S, Panda AK, Mukherjee S, Sa G. Curcumin and tumor immune-editing: resurrecting the immune system. Cell Div. 2015; 10:6.
3. Wang L, Zhu B, Zhang M, Wang X. Roles of immune microenvironment heterogeneity in therapy-associated biomarkers in lung cancer. Semin Cell Dev Biol. 2017; 64:90–7
4. Parcesepe P, Giordano G, Laudanna C, Febbraro A, Pancione M. Cancer-Associated Immune Resistance and Evasion of Immune Surveillance in Colorectal Cancer. Gastroenterol Res Pract. 2016; 2016:6261721.
5. Carosella ED, Rouas-Freiss N, Tronik-Le Roux D, Moreau P, LeMaoult J. HLA-G: An Immune Checkpoint Molecule. Adv Immunol. 2015; 127:33–144.
6. Carosella ED, Gregori S, LeMaoult J. The tolerogenic interplay(s) among HLA-G, myeloid APCs, and regulatory cells. Blood. 2011; 118:6499–505.
7. Lin A, Yan WH. HLA-G expression in cancers: roles in immune evasion, metastasis and target for therapy. Mol Med. 2015; 21:782–91.
8. Li JB, Ruan YY, Hu B, Dong SS, Bi TN, Lin A, Yan WH. Importance of the plasma soluble HLA-G levels for prognostic stratification with traditional prognosticators in colorectal cancer. Oncotarget. 2017; 8:48854–48862. https://doi.org/10.18632/oncotarget.16457.
9. Mlecnik B, Bindea G, Pagès F, Galon J. Tumor immunosurveillance in human cancers. Cancer Metastasis Rev. 2011; 30:5–12.
10. Kirilovsky A, Marliot F, El Sissy C, Haicheur N, Galon J, Pagès F. Rational bases for the use of the Immunoscore in routine clinical settings as a prognostic and predictive biomarker in cancer patients. Int Immunol. 2016; 28:373–82.
11. Park JH, McMillan DC, Edwards J, Horgan PG, Roxburgh CS. Comparison of the prognostic value of measures of the tumor inflammatory cell infiltrate and tumor-associated stroma in patients with primary operable colorectal cancer. OncoImmunology. 2016; 5:e1098801.
12. Chen Y, Yuan R, Wu X, He X, Zeng Y, Fan X, Wang L, Wang J, Lan P, Wu X. A Novel Immune Marker Model Predicts Oncological Outcomes of Patients with Colorectal Cancer. Ann Surg Oncol. 2016; 23:826–32.
13. Yan WH. Human leukocyte antigen-G in cancer: are they clinically relevant? Cancer Lett. 2011; 311:123–30.
14. Andersson E, Poschke I, Villabona L, Carlson JW, Lundqvist A, Kiessling R, Seliger B, Masucci GV. Non-classical HLA-class I expression in serous ovarian carcinoma: Correlation with the HLA-genotype, tumor infiltrating immune cells and prognosis. OncoImmunology. 2015; 5:e1052213.
15. Xu YF, Lu Y, Cheng H, Jiang J, Xu J, Long J, Liu L, Ni Q, Liu C, Yu XJ. High expression of human leukocyte antigen-G is associated with a poor prognosis in patients with PDAC. Curr Mol Med. 2015; 15:360–7.
16. Guo ZY, Lv YG, Wang L, Shi SJ, Yang F, Zheng GX, Wen WH, Yang AG. Predictive value of HLA-G and HLA-E in the prognosis of colorectal cancer patients. Cell Immunol. 2015; 293:10–6.
17. Ye SR, Yang H, Li K, Dong DD, Lin XM, Yie SM. Human leukocyte antigen G expression: as a significant prognostic indicator for patients with colorectal cancer. Mod Pathol. 2007; 20:375–83.
18. Zeestraten EC, Reimers MS, Saadatmand S, Goossens-Beumer IJ, Dekker JW, Liefers GJ, van den Elsen PJ, van de Velde CJ, Kuppen PJ. Combined analysis of HLA class I, HLA-E and HLA-G predicts prognosis in colon cancer patients. Br J Cancer. 2014; 110:459–68.
19. Reimers MS, Engels CC, Putter H, Morreau H, Liefers GJ, van de Velde CJ, Kuppen PJ. Prognostic value of HLA class I, HLA-E, HLA-G and Tregs in rectal cancer: a retrospective cohort study. BMC Cancer. 2014; 14:486.
20. Zhang WQ, Xu DP, Liu D, Li YY, Ruan YY, Lin A, Yan WH. HLA-G1 and HLA-G5 isoforms have an additive effect on NK cytolysis. Hum Immunol. 2014; 75:182–9.
21. Chen BG, Xu DP, Lin A, Yan WH. NK cytolysis is dependent on the proportion of HLA-G expression. Hum Immunol. 2013; 74:286–9.
22. Kirana C, Ruszkiewicz A, Stubbs RS, Hardingham JE, Hewett PJ, Maddern GJ, Hauben E. Soluble HLA-G is a differential prognostic marker in sequential colorectal cancer disease stages. Int J Cancer. 2017; 140:2577–86.
23. Castelli EC, Veiga-Castelli LC, Yaghi L, Moreau P, Donadi EA. Transcriptional and posttranscriptional regulations of the HLA-G gene. J Immunol Res. 2014; 2014:734068.
24. Ishibashi K, Kumai T, Ohkuri T, Kosaka A, Nagato T, Hirata Y, Ohara K, Oikawa K, Aoki N, Akiyama N, Sado M, Kitada M, Harabuchi Y, et al. Epigenetic modification augments the immunogenicity of human leukocyte antigen G serving as a tumor antigen for T cell-based immunotherapy. OncoImmunology. 2016; 5:e1169356.
25. Seliger B. Role of microRNAs on HLA-G expression in human tumors. Hum Immunol. 2016; 77:760–63.
26. Moreau P, Flajollet S, Carosella ED. Non-classical transcriptional regulation of HLA-G: an update. J Cell Mol Med. 2009; 13:2973–89.
27. Rouas-Freiss N, LeMaoult J, Verine J, Tronik-Le Roux D, Culine S, Hennequin C, Desgrandchamps F, Carosella ED. Intratumor heterogeneity of immune checkpoints in primary renal cell cancer: focus on HLA-G/ILT2/ILT4. OncoImmunology. 2017; 6:e1342023.
28. Edge SB, Compton CC. The American Joint Committee on Cancer: the 7th edition of the AJCC Cancer Staging Manual and the future of TNM. Ann Surg Oncol. 2010; 17:1471–4.
29. Chew SF, Kanaan C, Tait BD. HLA expression and cancer—14th IHIWS immunohistochemistry quality control exercise exchange results. Tissue Antigens. 2007; 69:248–51.