
INTRODUCTION
Ovarian cancer has the highest mortality rate of all gynecological cancers [1]. The standard of care for patients with advanced stage ovarian cancer consists of maximal cytoreductive or debulking surgery, and followed by a platinum-based adjuvant chemotherapy in combination with paclitaxel [2]. Residual disease after surgery is one of the most relevant prognostic factors for the patients [3]. However, even in optimally debulked patients without evidence of macroscopic residual tumor mass and/or with complete clinical response to first-line chemotherapy (according to the GCIG criteria [4]), the disease will recur in about 80% of these patients within 24 months, with fatal outcome.
Currently, there is a major effort to identify biological markers of minimal residual disease (MRD), which remains inaccessible by clinically established staging procedures and measurement of the serum tumor marker CA-125. In this regard, circulating tumor cells (CTCs) have been actively investigated in a number of solid tumor types, predominantly using the FDA approved CellSearch assay (Janssen Diagnostic, USA) [5]. In ovarian cancer, there has been growing evidence that CTCs are of prognostic relevance as well (reviewed by Romero-Laorden et al. [6]). Hematogenous spread has not been deemed a major issue for this type of cancer, until Pradeep and colleagues showed in a parabiosis mouse model that ovarian cancer disseminates to the omentum and subsequently to the peritoneum not only due to intraperitoneal “seeding”, but also via the hematogenous route [7]. Thus we hypothesized that CTCs may serve as indicators for tumor load at any time and for treatment response in ovarian cancer as well, and that CTCs could be used as surrogate markers of the risk of recurrence and metastasis.
The aim of the present study was to investigate the prognostic impact of CTCs on the outcome of ovarian cancer patients included into the OVCAD study cohort, and whether these CTCs could serve as surrogate markers for MRD beyond surgery. Initially, the blood samples were processed using a combined approach consisting of an immune-magnetic enrichment of CTCs expressing the epithelial cell surface marker epithelial cell adhesion molecule (EpCAM) and a subsequent immune-fluorescent staining of intracellular cytokeratins (protocol A). In the course of the study we developed a more comprehensive protocol for the immune-fluorescent multi-marker staining of additional targets, namely epithelial growth factor receptor (EGFR), human epidermal growth factor receptor 2 (HER2), mucin 1 (MUC1), as well as EpCAM and cytokeratins (protocol B). The blood samples were taken at two time-points: First, at primary diagnosis before any therapeutic intervention (baseline samples), and second, six months after completion of the adjuvant platinum-based chemotherapy (follow-up samples). In addition to immune-fluorescent staining of CTCs, we performed fluorescence in situ hybridization (FISH) in some selected cases to investigate the copy number of the stem-cell like fusion genes MECOM/HHLA1 and to pinpoint CTCs as cancer cells in case of doubt.
RESULTS
Patient characteristics
Blood samples were available from 266 of the 275 OVCAD study patients, comprising 241 samples taken at diagnosis, and 134 samples taken six months after completion of the primary treatment. The samples were processed according to protocol A in the first part of the study and to protocol B in the later course (see Figure 1). The patients were mainly diagnosed with FIGO stage III disease (77.1%), with high grade (72.2%), and serous (86.1%) histology. The majority of the patients (68.0%) was optimally debulked leaving no macroscopically visible tumor mass after surgery (R0); in 18.4% of the cases, neo-adjuvant chemotherapy was administered prior to surgery. Six months after completion of the adjuvant chemotherapy, 74.4% of the patients were classified as responders and 24.8% as non-responders according to the RECIST criteria. The proportion of FIGO stage IV patients was significantly higher in the protocol B than in the protocol A baseline samples (30.4% vs. 11.5%; p = 0.001), as well as the proportion of high grade tumors (79.4% vs. 64.7%; p = 0.022). Among the follow-up samples processed according to protocol A, we observed more R0 patients (82.1% vs 62.8%; p = 0.015) and patients having received a neo-adjuvant chemotherapy (26.8% vs. 12.8%; p = 0.046) than in protocol B follow-up samples. The median follow-up time of protocol B patients was 67 months (interquartile range, 61 to 73 months), with 108 recurrences and 83 cases of deaths.
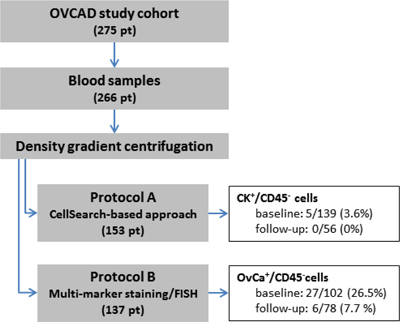
Figure 1: Flow diagram depicting the sample processing according to protocol A and B, including basic results.
CK+/CD45– CTCs in protocol A
In total, blood samples from 153 patients were processed according protocol A, which combined density gradient centrifugation, immune-magnetic isolation of EpCAM-positive cells and immune-fluorescent staining of cytokeratins. Blood samples taken at both time-points were available in 42 cases, whereas just one sample was available in (baseline) and in 14 (follow-up) cases, respectively. We observed CK+/CD45– CTCs in 5/139 (3.6%) baseline samples and in none of the 56 follow-up blood samples [8] (see Figure 1). More than one CK+/CD45– CTC was found in just a single baseline blood sample. The primary tumors of the five CTC-positive patients were classified as FIGO stage III (n = 4) and IV (n = 1). Due to the low number of CTC-positive samples, we did not perform any further statistical evaluation of the data.
Additional CTC markers for protocol B
Based on an extensive literature research we selected EpCAM, EGFR, HER2, and MUC1 to complement the immune-fluorescent detection of CTCs based on cytokeratins alone in protocol A. To find out whether these markers were indeed appropriate to detect CTCs in our cohort, we evaluated the microarray gene expression data from the respective primary tumor tissues. These data, which were available from 93 of the 137 patients whose blood samples had not been processed according protocol A, confirmed the presence of the selected markers at the gene expression level in all tumor tissues samples; moreover, a complementary or additive expression was shown. The strongest positive correlations were observed between EpCAM and KRT18, between KRT8 and KRT18, and between KRT7 and KRT8. Furthermore, we observed a moderate correlation between HER2 and EpCAM, and KRT18, respectively. Moderate to weak negative correlations were found between MUC1 and EGFR and between KRT7 and KRT8 (see Table 1).
Table 1: Correlation between lg2-transformed and normalized gene expression levels of EPCAM, KRT8, KRT18, KRT5, KRT7, HER2, MUC1, and EGFR, resulting from microarray analysis of primary tumor tissue samples
EPCAM |
KRT8 |
KRT18 |
KRT5 |
KRT7 |
HER2 |
MUC1 |
EGFR |
|
|---|---|---|---|---|---|---|---|---|
EpCAM |
1 |
|||||||
KRT8 |
0.370** |
|||||||
KRT18 |
0.654** |
0.760** |
||||||
KRT5 |
- |
0.335** |
0.204* |
|||||
KRT7 |
- |
0.635** |
0.279** |
0.353** |
||||
HER2 |
0.441** |
- |
0.351** |
- |
- |
|||
MUC1 |
0.372** |
–0.240* |
- |
- |
–0.510** |
0.468** |
||
EGFR |
- |
–0.284** |
- |
- |
–0.286** |
0.314** |
0.355** |
1 |
Pearson’ correlation coefficients are given, *correlation significant at the 0.05 level, **correlation significant at the 0.01 level, - correlation not significant.
OvCa+/CD45– CTCs in protocol B and patient/tumor characteristics
Finally, in the second part of the study, we processed blood samples from 137 patients according to protocol B, which combined density gradient centrifugation and multi-marker immune-fluorescent staining targeting EpCAM, EGFR, HER2, MUC1, and cytokeratins. Blood samples from both time-points were available from 43 patients, whereas just one sample was available in 59 (baseline) and in 35 (follow-up) cases, respectively (see Figure 1). OvCa+/CD45– CTCs were identified in 27/102 (26.5%) baseline blood samples and in 6/78 (7.7%) follow-up samples, at a mean count of 12.4 CTCs per ml blood at baseline (median 2.5, range < 1–187), and of 2.8 CTCs per ml blood in the follow-up samples (median 1, range < 1–10) [8]. A detailed description of the positive cases including disease stage and CTC counts is given in Table 3. In none of the ten healthy donor samples OvCa+/CD45– cells were observed [Brandt B, Alpers I., EUTROC European Scientific Meeting 2011, Valencia, Spain].
At baseline, OvCa+/CD45– CTCs were detected more frequently at a higher disease stage (FIGO II/III/IV p = 0.005), whereas at follow-up these CTCs were more likely in patients who were classified as non-responders to chemotherapy (p = 0.015; see Table 2).
Table 2: The presence of CTCs and their association to clinico-pathologic characteristics of the patients
Baseline blood samples |
Follow-up blood samples |
|||||||
|---|---|---|---|---|---|---|---|---|
N |
CTC+ (%) |
CTC– (%) |
p |
N |
CTC+ (%) |
CTC– (%) |
p |
|
Total cases |
102 |
27 (26.5) |
75 (73.5) |
78 |
6 (7.7) |
72(92.3) |
||
Median age, yrs (SD) |
56. 0 (±10.4) |
60.0 (±11.7) |
0.268 |
62.0 (±7.7) |
57.0 (±11.8) |
0.279 |
||
FIGO stage |
0.005 |
0.408 |
||||||
II |
4 |
0 (0.0) |
4 (100.0) |
2 |
0 (0.0) |
2 (100.0) |
||
III |
67 |
12 (17.9) |
55 (82.1) |
62 |
4 (6.5) |
58 (93.5) |
||
IV |
31 |
15 (48.4) |
16 (51.6) |
14 |
2 (14.3) |
12 (85.7) |
||
Histology |
0.758 |
0.442 |
||||||
Serous |
86 |
22 (25.6) |
64 (74.4) |
71 |
5 (7.1) |
66 (92.9) |
||
Non-serous |
16 |
5 (31.3) |
11 (68.7) |
7 |
1 (14.3) |
6 (85.7) |
||
Grade |
0.807 |
0.606 |
||||||
G1 or G2 |
21 |
6 (28.6) |
15 (71.4) |
17 |
2 (11.8) |
15 (88.2) |
||
G3 |
81 |
21 (25.9) |
60 (74.1) |
61 |
4 (6.6) |
57 (93.4) |
||
Response to therapy |
0.708 |
0.015 |
||||||
yes |
72 |
20 (27.8) |
52 (72.2) |
61 |
2 (3.3) |
59 (96.7) |
||
no |
29 |
7 (24.1) |
22 (75.9) |
16 |
4 (25.0) |
12 (75.0) |
||
Neo-adjuvant CT |
0.116 |
0.168 |
||||||
yes |
17 |
7 (41.2) |
10 (58.8) |
10 |
2 (20.0) |
8 (80.0) |
||
no |
85 |
20 (23.5) |
65 (76.5) |
68 |
4 (5.9) |
64 (94.1) |
||
Residual disease |
0.724 |
0.188 |
||||||
yes |
33 |
8 (24.2) |
25 (75.8) |
29 |
4 (13.8) |
25 (86.2) |
||
no |
69 |
19 (27.5) |
50 (72.5) |
49 |
2 (4.1) |
47 (95.4) |
||
Peritoneal carcinosis |
0.152 |
0.313 |
||||||
yes |
67 |
20 (29.9) |
47 (70.1) |
49 |
6 (12.2) |
43 (87.8) |
||
no |
26 |
4 (15.4) |
22 (84.6) |
21 |
0 (0.0) |
21 (100.0) |
||
Ascites |
0.152 |
0.582 |
||||||
yes |
67 |
20 (29.9) |
47 (70.1) |
54 |
5 (9.3) |
49 (90.7) |
||
no |
26 |
4 (15.4) |
22 (84.6) |
16 |
0 (0.0) |
16 (100.0) |
||
CA-125 |
0.369 |
0.148 |
||||||
<35 U/ml |
7 |
3 (42.9) |
4 (57.1) |
26 |
4 (15.4) |
22 (84.6) |
||
≥35 U/ml |
82 |
20 (24.4) |
62 (75.6) |
39 |
1 (2.6) |
38 (97.4) |
||
HE-4 |
0.580 |
|||||||
<290 pM |
42 |
12 (28.6) |
30 (71.4) |
n.a. |
||||
≥291 pM |
51 |
12 (23.5) |
39 (76.5) |
|||||
Cytospin samples from density gradient enriched blood samples taken at diagnosis and six months after completion of first-line chemotherapy were evaluated for the presence of CTCs (OvCa+/CD45– cells) using protocol B. Samples with “ambiguous” staining results were considered to be CTC-negative, unless chromosomal gain was detected by FISH analysis. n.a.: not assessed.
Table 3: Characteristics of CTC-positive patients
Patient ID |
Disease stage |
PFS (months) |
OS (months) |
OvCa+/CD45– cells per ml blood |
|
|---|---|---|---|---|---|
baseline |
follow-up |
||||
H071 |
IV (liver, spleen) |
16 |
58 |
187 |
n.a. |
B151 |
IV (lung) |
65 |
65 |
20 |
n.a. |
B132 |
IV (LN) |
14 |
45 |
11 |
n.a. |
B159 |
IV (liver) |
12 |
27 |
9 |
10 |
H076 |
IV (inguinal LN) |
cPD |
9 |
5 |
n.a. |
B117 |
IV (inguinal LN) |
13 |
37 |
4 |
n.a. |
H079 |
IV (liver, LN) |
§ |
14 |
4 |
n.a. |
V046 |
IV (spleen) |
12 |
44 |
3 |
n.a. |
B131 |
IV (liver) |
25 |
48 |
2 |
n.a. |
B137 |
IV (inguinal LN) |
70 |
70 |
2 |
0 |
B175 |
IV (inguinal LN) |
8 |
14 |
2 |
n.a. |
L177 |
IV (spleen) |
11 |
35 |
2 |
0 |
B126 |
IV (PE) |
15 |
28 |
1 |
0 |
H083 |
IV (spleen) |
§ |
10 |
1 |
0 |
B171 |
IV (inguinal LN) |
12 |
34 |
0 |
3 |
B111* |
IV (PE) |
22 |
44 |
0 |
n.a. |
B120 |
IIIC |
9 |
21 |
28 |
n.a. |
V047 |
IIIC |
10 |
36 |
14 |
n.a. |
B135 |
IIIC |
cPD |
4 |
12 |
n.a. |
B157 |
IIIC |
44 |
44 |
4 |
n.a. |
B146 |
IIIC |
31 |
34 |
3 |
n.a. |
B144 |
IIIC |
21 |
37 |
1 |
n.a. |
H073 |
IIIC |
36 |
53 |
1 |
n.a. |
H082 |
IIIC |
32 |
53 |
< 1 |
n.a. |
I020 |
IIIC |
12 |
18 |
< 1 |
n.a. |
L220 |
IIIC |
15 |
56 |
1 |
0 |
V035 |
IIIC |
13 |
69 |
0 |
1 |
L083 |
IIIC |
11 |
25 |
n.a. |
1 |
L141 |
IIIC |
8 |
9 |
0 |
< 1 |
L227 |
IIIC |
11 |
20 |
n.a. |
< 1 |
B129 |
IIIA |
21 |
39 |
2 |
n.a. |
B168 |
IIIA |
14 |
67 |
11 |
n.a. |
31 patients were scored as CTC-positive due to the presence of OvCa+/CD45– cells in their baseline and/or follow-up blood sample (protocol B). The stage of the disease at diagnosis according to the FIGO classification is given (site of distant metastases in brackets).
*One further patient (B111) was scored as CTC-positive due to chromosomal gain in 8q24.
n.a.: blood sample not available; cPD: clinical progressive disease at completion of adjuvant treatment; §: date of recurrence not assessed; LN lymph node; PE malignant pleural effusion.
The presence of OvCa+/CD45- CTCs at baseline was associated with significantly lower levels of KRT5 (mean lg2 transformed gene expression 1.12 vs. 0.10, p = 0.040) and KRT7 (mean lg2 transformed gene expression 1.34 vs. 0.36, p = 0.034) gene expression in the corresponding tumor tissue samples. To assess whether the gene expression in the primary tumor tissue would predict the presence of CTCs, we performed a binary logistic regression analysis, including disease stage and the respective gene expression levels as continuous variables. The results indicated that advanced disease and low KRT5 gene expression were independent predictors of baseline CTCs (FIGO: HR 4.410 95% CI 2.926–5.894, p = 0.009; 87 KRT5: HR 0.697 95% CI 0.336–1.058, p = 0.020).
Due to our tight criteria for CTC positivity, we additionally observed “ambiguous” cells, which were predominantly double-positive (OvCa+/CD45+), weakly stained (OvCa+/–/CD45–), or double-negative (OvCa–/CD45) with a tumor-like morphology [8]. These “ambiguous” cells were found in 16/102 (15.7%) baseline and in 9/78 (11.5%) follow-up samples. They were more likely in FIGO III than in FIGO IV stage disease (p = 0.031), and were mainly observed in chemo-responders (8/9 cases) [Brandt B, Alpers I., OVCAD Meeting 2009, Leuven, Belgium].
OvCa+/CD45– CTCs and patient survival
Within the entire cohort of 102 patients with baseline blood samples available, the presence of OvCa+/CD45– CTCs at diagnosis did not have a significant impact on survival (OS: HR 1.564, 95% CI 0.923–2.652, p = 0.096; PFS: HR 1.167, 95% CI 0.699–1.948, p = 0.555). In those 78 patients with a follow-up blood sample available, the presence of OvCa+/CD45– CTCs at that time-point was associated with worse outcome (OS: HR 3.305, 95% CI 1.386–7.880, p = 0.007; PFS: HR 5.671, 95% CI 1.560–20.618, p = 0.008).
OvCa+/CD45– CTCs and minimal residual disease
To investigate the potential role of MRD after surgery, we stratified optimally debulked patients (R0) by the presence of OvCa+/CD45– CTCs in their baseline blood samples. In these patients (n = 69), the presence of OvCa+/CD45– CTCs at baseline was significantly associated with shorter OS (HR 2.158, 95% CI 1.111–4.191, p = 0.023) (see Figure 2), but not with shorter PFS. At the end of the total observation period, the majority of these CTC-positive patients (15/19) had already died, whereas about half of the CTC-negative patients (27/50) were still alive. According to multivariate analysis, OvCa+/CD45– CTC-based outcome prediction was independent from patient age, FIGO stage, and the presence of peritoneal carcinomatosis (HR 2.720, 95% CI 1.340–5.522, p = 0.006).
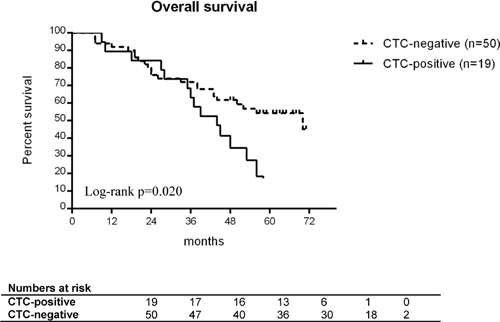
Figure 2: Overall survival of optimally debulked ovarian cancer patients. The patients are stratified by presence (black line) or absence (grey line) of OvCa+/CD45– CTCs at diagnosis. All patients (n = 69) received primary surgery without any macroscopically visible tumor residue left. Differences in survival were compared using the log-rank test.
FISH analysis to confirm and complement CTC phenotyping
CGH profiling had been performed as part of a preliminary study revealing gains at 3q26.2 and/or at 8q24 in 65.6% and 57% of the cases, respectively (Figure 3). The smallest region of overlap of gain at 3q26.2 corresponded to the MDS1/EVI1 (MECOM) locus, while that at 8q24 corresponded to the HHLA1 (POU5F1) locus (Figure 3). BAC clones RP11-250A4 and RP11-240B13 covering the MECOM and HHLA1 fusion loci were subsequently used as probes in FISH experiments in order to confirm the presence of cells related to progressive disease and possibly to metastasis.
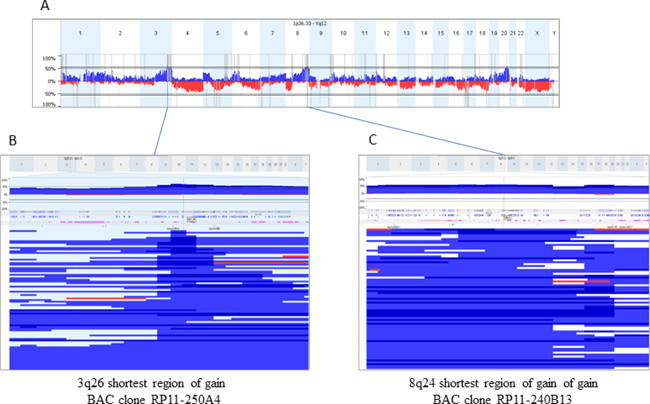
Figure 3: Copy Number Alterations (CNA) in 128 sporadic ovarian carcinomas and mapping of shortest regions of overlap (SRO) for gains at 3q26 and 8q24. (A) represents a whole genome CNA profile (gains blue, losses red). Regions at 3q26.2 and 8q24 were the most frequently gained (65.6 and 57% of the cases respectively). To select BAC best adapted BAC clones for FISH experiments, SROs were mapped (B and C) corresponding to blow up boxes showing profiles of all the tumors gained in the analyzed regions). BAC clones selected were RP11-250A4, at 3q26.2 covering the MECOM locus, and RP11-240B13, at 8q24 encompassing the HHLA1 gene.
A total of 1500 (RP11-240B13) and 3500 (RP11-250A4) leukocytes from three and seven healthy donors, respectively, were scored for gains of the FISH probes. The false-positive hybridization rate (three dots per cell) was 0.1% (RP11-250A4) and 0.5% (RP11-240B13), with more than 98% of the healthy donor leukocytes showing exactly two hybridization dots per cell [8]. In none of these leukocytes we detected more than three dots. Thus, we determined a cut-off value of at least three hybridization spots per cell to confirm that this cell was a tumor cell [8].
For FISH analysis of ovarian cancer CTCs, nine patients with more than two OvCa+/CD45– CTCs per ml blood with three of them having “ambiguous” cells were selected. We found cells with MECOM and/or HHLA1 gains in all of the investigated blood samples (Table 3). Likewise, the detection of chromosomal gains complemented CTC phenotyping in those cases showing “ambiguous” double-negative cells (OvCa–/CD45–) with a tumor-like morphology and weakly stained cells (OvCa+/–/CD45–).
Table 4: Characteristics of FISH-positive patients
Patient |
FIGO |
OvCa+/CD45– cells/ml blood |
CNV (gains) |
Time-point |
|---|---|---|---|---|
H071 |
IV (liver, spleen) |
187 |
MECOM/HHLA1 |
baseline |
B120 |
IIIC |
28 |
MECOM |
baseline |
B151 |
IV (lung) |
20 |
MECOM/HHLA1 |
baseline |
V047 |
IIIC |
14 |
MECOM/HHLA1 |
baseline |
B146 |
IIIC |
3 |
MECOM |
baseline |
B175 |
IV (PE) |
2 |
MECOM |
baseline |
L177 |
IV (spleen) |
2 |
MECOM |
baseline |
B111* |
IV (PE) |
0 |
HHLA1 |
baseline |
B159 |
IV (liver |
10 |
MECOM |
follow-up |
Nine patients were selected for FISH analysis due to the presence of at least two OvCa+/CD45– cells per ml blood.
*One further patient (B111) was scored as CTC-positive due to chromosomal gain in 8q24.
CNV copy number variation; PE pleural malignant effusion.
MECOM and/or HHLA1 gains are associated with metastatic spread
In addition to the observation that all patients with primary metastasis (stage FIGO IV) presented with MECOM and/or HHLA1 positive CTCs, a phenotypical characterization of the OvCa+/CD45– CTCs observed in a particular patient was performed. The baseline blood sample of that patient (H071) was the one with the highest number of CTCs (187 OvCa+/CD45– cells per ml blood; see Table 3). These OvCa+/CD45– cells were CK7/18-positive, with just 10% being EpCAM-positive, albeit at much lower staining intensity [8]. That difference of intensity was observed in metastases located in the spleen and liver as well, suggesting higher CK7/18 than EpCAM protein expression in these samples. In contrast, CKs and EpCAM were detected at similar levels in the primary tumor tissue. At the genome level, gains in the MECOM and HHLA1 loci were observed in the primary tumor and the metastases, as well as in just 25% and 50% of the CK7/18-positive CTCs, respectively. In addition, chromosomal gains were found in CK-negative cells which would not have been identified as tumor cells by immune-fluorescent staining alone.
DISCUSSION
In the present study we developed a workflow for the detection and characterization of CTCs in ovarian cancer blood samples. The low number of CTC-positive samples observed in protocol A and in comparable studies employing epithelial markers alone [9, 10] led us to modify the protocol accordingly. Being aware of the heterogeneity of the CTC population, we assumed that a multi-marker approach might be more successful in ovarian cancer as well. We thereupon chose multiple targets, namely EpCAM, CKs, EGFR, HER2, and MUC1 for the immune-fluorescent detection of CTCs in the remaining blood samples (protocol B), and the analysis of chromosomal gains in MECOM/HHLA1 loci as a complementary approach. Although our study may have some limitations, our approach led us to the key observation that an unfavorable prognosis of optimally debulked patients was associated with the presence of CTCs before surgery. This finding indicates that CTCs may serve as biomarkers for MRD in ovarian cancer, and that they could therefore have the potential to become a decisive factor in the clinical management of ovarian cancer patients.
In view of the low number of CTC-positive samples in protocol A (just 5/139 baseline samples and none of the 56 follow-up samples contained CK+/CD45– cells), we then used protocol B in the further course of the study, which comprised markers associated with epithelial characteristics (EpCAM, CK8/18) as well as with metastatic progression (MUC1, EGFR, CK5/7 and HER2 [11–13]) in order to catch various subsets of CTCs displaying different phenotypes. Furthermore, we combined antibodies from several sources to detect diverse epitope subsets [14]. In addition to the whole genome expression data from the OVCAD study cohort (data not shown), previously published studies employing the AdnaTest (Qiagen) indicated that MUC1, HER2, and EGFR could be suitable to complement epithelial markers. The AdnaTest is based on the immune-magnetic isolation of ovarian cancer CTCs using antibodies against MUC1 and EpCAM. On the molecular level, the majority of those CTCs were characterized by MUC1 and HER2 gene expression [15, 16].
In regard to the rareness and the heterogeneity of CTCs in ovarian cancer [17], we performed a density gradient centrifugation-based enrichment of up to 20 ml of blood as the very first step in both protocol A and B. Thereby we were able to analyze more than twice as much blood as other investigators using immune-magnetic bead-based techniques to enrich CTCs, such as the CellSearch assay (Janssen Diagnostic, USA) and the AdnaTest (Qiagen), which start from a 7.5 ml and 5.0 ml blood sample, respectively. The mean recovery rate of the above mentioned density gradient centrifugation was 76.6% for spiked-in ovarian cancer cells (data not shown), which is slightly lower than with prostate [18] or breast cancer cells [19]; nevertheless in our hands the same type of enrichment had already been proven to be effective for ovarian cancer and subsequent detection of CTC-related transcripts [20].
We observed noticeable more CTC-positive cases after switching from protocol A to B. By using multiple markers for the immune-fluorescent detection of CTCs, the numbers of positive cases increased from 5/139 (3.6%) to 27/102 (26.5%) at baseline, and from 0/56 (0%) to 6/78 (7.7%) at follow-up. In line with other studies, the presence of OvCa+/CD45– CTCs in the protocol B samples significantly correlated with disease stage and therapy response [21–24].
However, the positivity rates obtained with protocol A and B may not be directly compared, because the respective blood samples differ in terms of patient characteristics, like disease stage and tumor grade. Thus the divergent results obtained with protocol A and B may only be partially attributed to the methodological differences of the respective protocols.
Interestingly, we observed that the presence of OvCa+/CD45– CTCs detected in protocol B was associated with low KRT5 and KRT7 gene expression levels in the paired primary tumor tissue samples. Pan-cytokeratin antibodies are widely used for immune-histochemical staining of CK-positive tumor cells; however, there is sparse information available on cytokeratin phenotyping. Among the few studies investigating the role of CK5 protein in ovarian cancer, various rates of CK5-positive tumor tissue samples, ranging from 25% to 68%, are reported [25, 26]. Another study evaluating cytokeratins as biomarker to discriminate primary from metastatic adenocarcinoma found that CK7 protein expression is reduced in metastatic ovarian cancer [27]. Developing a gene expression profile that may predict the presence of CTCs–in line with Molloy’s study in breast cancer [28]–was out of the scope of the present study, but may eventually be subject of further investigations.
Studies investigating CTCs in ovarian cancer published to date vary markedly with regard to patient population, timing of blood draw, and length of follow-up. Furthermore, the methods for processing the blood samples and the decisive criteria for CTC-positivity vary greatly. For this reason any comparison of the results may only be carried out with caution. However, our results clearly support the notion of other authors that CTCs are present in the blood of ovarian cancer patients and that they may have clinical relevance (reviewed by [6]), and that in ovarian cancer a more comprehensive approach that does not rely on the detection of epithelial markers alone may be needed [20, 29–31].
The present results confirm the findings from our earlier study, which employed a combination of density gradient-based enrichment and detection of CTC–related gene markers using qPCR [20]. In both studies we demonstrated the prognostic impact of CTCs after chemotherapy; however, due to the limited sample number in the present study we were not able to assess whether that impact was independent from other known prognostic factors, and whether these CTCs may predict MRD in patients with clinical complete remission following treatment.
Our observation that the presence of baseline CTCs is associated with worse outcome in a sub-group of optimally debulked patients is in line with the findings of Pearl et al., who used a cell adhesion matrix-based, functional cell enrichment platform to isolate invasive CTCs [24]. Like our approach to enrich CTCs by density gradient centrifugation, that platform may be regarded as being independent from epithelial markers; however the results obtained from the study mentioned above differ from those of our study in terms of median numbers of CTCs in ovarian cancer patients (i.e. 42 per ml vs. 2.8 per ml), and in terms of CTC presence in healthy and benign donors, which was observed at a rate of 5% in the Pearl study. These differences indicate that in our study some samples may be false negative. The presence of “ambiguous” double-negative cells further supports that assumption. We observed these “ambiguous” cells in 16% of the baseline and in 12% of the follow-up samples. In particular the OvCa–/CD45– cells were discovered by chance, and it was out of the scope of our study to screen all samples for morphologically atypical and entirely unstained cells. A possible explanation for the decrease or even absence of a specific staining may be a reduced protein expression of the chosen markers or a proteolytic cleavage of their extracellular domains, both phenomena to occur during cancer progression [32–34]. Inconsistent results regarding CTC positivity rate and their prognostic relevance in earlier studies employing EpCAM-based systems may be at least partially due to the heterogeneity of the CTC population [35–37].
The presence of “ambiguous” cells demanded for an additional approach to ascertain whether these cells were cancer cells or not. Therefore, we analyzed the chromosomal aberrations in loci 3q26 and 8q24 using FISH probes for the survival and stem cell-like fusion genes MECOM and HHLA1. In concordance with earlier studies [38–40] we observed MECOM copy number gains in more than two thirds of the primary tumors of ovarian cancer patients. Likewise, it has been demonstrated that aberrations in the chromosomal region 8q24.21-8q24.22 comprising the HHLA1 locus occurred frequently in these cancers [41]. The presence of MECOM and/or HHLA1 gains in all CTC samples investigated confirmed the specificity of the multi-marker staining, and furthermore allowed us to ascertain that “ambiguous” cells corresponded to cancer cells, thus enabling us to extend the CTC count. In addition, we observed that even in patients with clearly assigned CTCs (OvCa+/CD45– cells), a side population of unstained OvCa–/CD45– cells harboring chromosomal gains was detected by FISH. Thus, in many ovarian cancer patients not only the actual number of CTCs but also their prevalence might be higher than assumed. The analysis of CTCs in patient H071 further revealed that these cells were heterogeneous not only regarding protein expression, but also at the genome level.
In conclusion, this study shows the prognostic impact of CTCs on the outcome of ovarian cancer patients included into the OVCAD study cohort. Our findings indicate that these CTCs could serve as surrogate markers for minimal residual disease beyond complete resection of the tumor. Future investigations using scanning microscopy or molecular probes may be useful in validating our preliminary findings in larger patient cohorts in order to strengthen the role of CTC diagnostics in the future management of ovarian cancer patients.
MATERIALS AND METHODS
Patients
The patients with histopathologically confirmed primary epithelial ovarian cancer were part of the prospective multi-center OVCAD study cohort. The overall goal of that study was to investigate new predictors for the early detection of MRD in epithelial ovarian cancer. Detailed inclusion and exclusion criteria, together with clinical data have already been presented elsewhere [42]. All patients received standard treatment consisting of debulking surgery and platinum-based adjuvant chemotherapy. Response to treatment was evaluated by experienced gynecological oncologists of the participating university centers according to the WHO criteria, i.e. by an increase in the nadir serum CA-125 level according to the GCIG criteria and by radiological (clinical) confirmation [43]. Patients were classified as non-responder if progression was diagnosed during treatment or recurrence occurred within six months after end of first-line chemotherapy. Written informed consent was obtained from each patient before study inclusion. The study protocol was approved by the local ethics committees of the participating OVCAD partners.
Blood samples and CTC enrichment
Twenty ml of peripheral blood was taken by venipuncture at primary diagnosis (prior to treatment; i.e. baseline samples), and six months after completion of the adjuvant platinum-based chemotherapy (i.e. follow-up samples). The blood was collected into Vacuette EDTA tubes (Greiner Bio-One). A two-layer density gradient centrifugation to obtain a CTC enriched cell fraction and a plasma layer was performed as described previously [20]. Initially, the density gradient enriched cells were further processed employing protocol A, which finally was replaced by protocol B in the course of the study (see Figure 1). CA-125 and HE-4 levels were assessed in the top plasma layer obtained after density gradient centrifugation, using the Milliplex MAP Human Cancer Biomarker Panel Kit (Millipore) and HE-4 EIA assay (Fujirebio Diagnostics AB).
CTC detection in protocol A
Following density gradient centrifugation as described above, the CTC containing cell fraction was further enriched for EpCAM-positive cells using the CellSearch Profile Kit as described by Alpers [7]. Then, each two cytospins were prepared (Hettich Rotofix 20 cytocentrifuge, 160x g, and 3 min), which were subsequently stained using fluorescently labelled antibodies to CK7/18 (clone A45-BB3, Micromet) and CK5/8 (clone C22, Progen). Leukocytes were counterstained using an Alexa Fluor 488 labelled antibody to hematopoetic lineage-specific CD45 (clone H130, Biolegend). Nuclei were visualized using DAPI (Carl Roth). CTCs were identified as CK+/CD45– cells.
Selection of CTC markers for protocol B
In light of the unexpected results obtained from samples which had been processed using protocol A in the initial phase of the study, we targeted EGFR, HER2, and MUC1 in addition to EpCAM and CK for the immune-fluorescent staining of CTCs in protocol B. These targets are known to be associated with cell differentiation, proliferation, tumor promotion and metastasis [11–13], and have already proven their suitability for CTC characterization [15, 16, 37]. Furthermore, microarray data from primary tumor tissue samples collected from the OVCAD cohort were available to verify the presence of these additional markers at the gene expression level [44].
CTC detection in protocol B
After the enrichment by density gradient centrifugation, each three cytospins were prepared by applying a total number of 2 × 10⁵ enriched cells onto glass slides as described above. These samples were stained using a cocktail of primary murine antibodies to CK7/18 (clone A45-BB3, Micromet), CK5/8 (clone C22, Progen), EpCAM (clone Ber-EP4, Dako; clone VU-ID9, Novocastra), MUC1 (clone E29, Dako), EGFR (clone sc-120, Santa Cruz), and HER2 (clone NCL-CB11, Novocastra) as described by Alpers [7]. The appropriate dilution of each antibody to ensure high specificity was established using cell lines (MDA-MB-468, SK-OV3, MCF-7) and healthy donor leukocytes. Specific binding of the primaries was detected using a biotinylated secondary antibody (rabbit anti-mouse, Dako) and Alexa Fluor 594 labelled streptavidin (Invitrogen). Leukocytes and nuclei were visualized as described above. The specificity of multi-marker staining was assessed in the density gradient-enriched cell fraction of ten healthy donors. Unequivocal identification of CTCs (named further OvCa+/CD45−) in patients’ samples was allowed due to a strong Alexa Fluor 594 signal (OvCa+), the absence of leukocyte-specific staining (CD45−), and to the presence of an intact nucleus and cell morphology.
BAC-based CGH analysis of tumor DNA
Comparative genomic hybridization (CGH) was performed on tumor DNA from 128 ovarian cancer patients, which was analyzed on two generations of BAC-arrays (Integragen) IgV6+ (5015 BACs), IgV7 (5878 BACs), with a median resolution of 0.6 Mb. BACs (bacterial artificial chromosomes) were spotted in quadruplicates. DNA labeling and hybridization were done as previously described [45] with slight modifications: 600 ng DNA were labeled with the BioPrime Total Genomic Labeling System (Invitrogen). Arrays were scanned using an Axon 4000B scanner (Molecular Devices), and images were analyzed using Genepix 6.0. Data were analyzed in a web-based platform for copy number array management and analysis (http://bioinfo-out.curie.fr/CAPweb/). Normalized and replicates-filtered data were exported as text file for further analyses. In order to analyze all the data from different Integrachip versions, we used the Nexus 6.0 Software (Biodiscovery). Analysis settings for data segmentation and calling were the following: significant threshold for Rank Segmentation algorithm: 0.005, Max Continuous Probe Spacing: 6000, Min number of probes per segment: 6, high level gain: 0.485, gain, 0.138, loss:−0.153, homozygous copy loss:−0.73. Nexus 6.0 Software was used to calculate frequency plots, factor enrichment (significantly over-represented factor values in a particular factor group identified using the two-tailed Fisher’s Exact test at a p-value of p < 0.05), significant chromosomal differences between two groups (two-tailed Fisher’s exact test with p-value < 0.005 and minimal frequency difference set at 10%) and Survival Predictive Power (log-rank test is used to identify genomic regions yielding a high degree of survival prediction; p-value was calculated by permuting the survival time for each sample and comparing the log-rank statistic for the permuted data to the original data; threshold used was p-value < 0.05).
FISH on CTCs and primary tumor/metastasis tissues
The protocol was established as part of the doctoral thesis of Iris Alpers [8]. FISH probes were prepared from DNA isolated from BAC clones RP11-250A4 (3q26, MDS1 and EVI1 complex locus protein EVI1 (MECOM)) and RP11-240B13 (8q24, HERV-H LTR-associated 1 (HHLA1)) using the Large DNA Construct Isolation Kit (Qiagen) and the BioPrime Total Genomic Labeling System (Invitrogen) according to the manufacturers’ protocols. De-paraffinized FFPE sections and cytospin samples were processed as described previously [46] using 1 μl COT1 Human DNA (Roche), 1 μL of CEP7 Spectrum Aqua (Abbott Molecular) as a reference probe, and 2 μL of Spectrum Orange - labeled probe (Abbott Molecular) for chromosomal region 3q26 or 8q24 suspended in 6 μL of hybridization buffer. For each tissue specimen, target and reference probe signals were counted in 100 cells showing a minimum of two signals for the reference probe. DNA gain and loss were defined as the ratio of the number of target probe signal over reference probe signals being ≥1.5 or ≤0.75, respectively. For FISH on CTCs, the immune-staining protocol was slightly modified (streptavidin labelled with Alexa Fluor 488), and counterstaining of leukocytes was omitted. Leukocytes from healthy donors were scored for gains of the probes to obtain an estimate of the false-positive hybridization rate.
Statistical analysis
The Pearson’s chi-square and Fisher’s exact test were used to assess the relationship between CTC presence and clinico-pathological characteristics of the patients. Clinical endpoints were calculated as follows: progression-free survival (PFS), between time of blood draw (baseline: prior to surgery, follow-up: six months after completion of adjuvant chemotherapy) and first recurrence; overall survival (OS), between time of blood draw (see above) and death due to any cause. Kaplan-Meier survival analyses and log-rank testing were used to compare survival outcomes [47]. Cox proportional hazards regression was used to determine univariate and multiple hazards ratios [48]. Covariates included were patient age as continuous variable, and FIGO stage (II/III vs. IV), residual tumor mass after surgery (R0 vs. R > 0), peritoneal carcinomatosis (absence vs. presence), and the CTC status (OvCa+/CD45– absence vs. presence) as dichotomous variables. The model was built using a forward stepwise method by entering all variables at a p value of less than 0.05 and removing them at a p value of greater than 0.10. Statistical analysis was performed by SPSS version 19.0 (SPSS Inc., Chicago, IL). The level of significance was set at p < 0.05.
Abbreviations
CTC: circulating tumor cell; GCIG: Gynecologic Cancer InterGroup; MRD: Minimal residual disease; CA-125: Cancer Antigen 125; HE-4: Human Epididymis Protein 4; FDA: US Food and Drug Administration; BAC: Bacterial artificial chromosome ; FISH: Fluorescence in situ hybridization; EpCAM: Epithelial cell adhesion molecule; CK: Cytokeratin; EGFR: Epidermal Growth Factor Receptor; HER-2: Human epidermal growth factor receptor 2; CD45: cluster of differentiation 45; MUC1: Mucin 1; HHLA1: HERV-H LTR-Associating 1; MECOM: MDS1 And EVI1 Complex Locus; CNV: Copy number variation; HR: Hazard ratio; CI: Confidence interval; PFS: Progression free survival; OS: Overall survival; EIA: Enzyme-linked Immunosorbent Assay; FFPE: Formalin-Fixed, Paraffin-Embedded
Author contributions
RZ, DCT, BB, AR, EIB, JS, IV and CT conceived the study. NBK, EO, BO, HUW designed and performed the research, analyzed and interpreted data. EO, BB, and CT wrote and edited the manuscript. HUW and BO designed and carried out the FISH probes. NBK was in charge of FISH experiments. AL, AR, EIB, SM, JS, and IV provided clinical data of the patients.
ACKNOWLEDGMENTS
We thank Iris Alpers for the excellent staining protocols for CTC detection and microscopic evaluation. We further thank Klaus Pantel and the staff at the Department of Tumor Biology, especially Nina Schmalstieg, Corrnelia Coith, and Sabine Riethdorf, Universitätsklinikum Hamburg-Eppendorf, Germany, for support and excellent assistance in CellSearch analysis.
CONFLICTS OF INTEREST
The authors declare no potential conflicts of interest.
FUNDING
The OVCAD study was funded by the European commission as a FP6 Specific Targeted Research and Innovation Project (contract no 018698).
Dr. Elena Ioana Braicu is a participant of the Charité Clinical Scientist Program funded by the Charité Universitätsmedizin Berlin and the Berlin Institute of Health.
REFERENCES
1. Ferlay J, Parkin DM, Steliarova-Foucher E. Estimates of cancer incidence and mortality in Europe in 2008. Eur J Cancer. 2010; 46:765–81. https://doi.org/10.1016/j.ejca.2009.12.014.
2. Vergote I, Van Gorp T, Cadron I, Leunen K, Neven P, Amant F. Improving outcome in the first-line management of advanced ovarian cancer. Eur J Cancer. 2007; 5:23–8. https://doi.org/10.1016/s1359-6349(07)70012-5.
3. Polterauer S, Vergote I, Concin N, Braicu I, Chekerov R, Mahner S, Woelber L, Cadron I, Van Gorp T, Zeillinger R, Castillo-Tong DC, Sehouli J. Prognostic value of residual tumor size in patients with epithelial ovarian cancer FIGO stages IIA-IV: analysis of the OVCAD data. Int J Gynecol Cancer. 2012; 22:380–5. https://doi.org/10.1097/IGC.0b013e31823de6ae.
4. Rustin GJ, van der Burg ME, Griffin CL, Guthrie D, Lamont A, Jayson GC, Kristensen G, Mediola C, Coens C, Qian W, Parmar MK, Swart AM. Early versus delayed treatment of relapsed ovarian cancer (MRC OV05/EORTC 55955): a randomised trial. Lancet. 2010; 376:1155–63. https://doi.org/10.1016/S0140-6736(10)61268-8.
5. Paterlini-Brechot P, Benali N. Circulating tumor cells (CTC) detection: clinical impact and future directions. Cancer Lett. 2007; 253:180–204.
6. Romero-Laorden N, Olmos D, Fehm T, Garcia-Donas J, Diaz-Padilla I. Circulating and disseminated tumor cells in ovarian cancer: a systematic review. Gynecol Oncol. 2014; 133:632–9. https://doi.org/10.1016/j.ygyno.2014.03.016.
7. Pradeep S, Kim SW, Wu SY, Nishimura M, Chaluvally-Raghavan P, Miyake T, Pecot CV, Kim SJ, Choi HJ, Bischoff FZ, Mayer JA, Huang L, Nick AM, et al. Hematogenous metastasis of ovarian cancer: rethinking mode of spread. Cancer Cell. 2014; 26:77–91. https://doi.org/10.1016/j.ccr.2014.05.002.
8. Alpers I. Detektion und Charakterisierung von zirkulierenden Tumorzellen im peripheren Blut von Patientinnen mit Ovarialkarzinom (Detection and Characterization of Circulating Tumor Cells in the Peripheral Blood of Ovarian Cancer Patients). University Hamburg.
9. Rao CG, Chianese D, Doyle GV, Miller MC, Russell T, Sanders RA Jr, Terstappen LW. Expression of epithelial cell adhesion molecule in carcinoma cells present in blood and primary and metastatic tumors. Int J Oncol. 2005; 27:49–57.
10. Sieuwerts AM, Kraan J, Bolt J, van der Spoel P, Elstrodt F, Schutte M, Martens JW, Gratama JW, Sleijfer S, Foekens JA. Anti-epithelial cell adhesion molecule antibodies and the detection of circulating normal-like breast tumor cells. J Natl Cancer Inst. 2009; 101:61–6. https://doi.org/10.1093/jnci/djn419.
11. Horm TM, Schroeder JA. MUC1 and metastatic cancer: expression, function and therapeutic targeting. Cell Adh Migr. 2013; 7:187–98. https://doi.org/10.4161/cam.23131.
12. Normanno N, De Luca A, Bianco C, Strizzi L, Mancino M, Maiello MR, Carotenuto A, De Feo G, Caponigro F, Salomon DS. Epidermal growth factor receptor (EGFR) signaling in cancer. Gene. 2006; 366:2–16. https://doi.org/S0378-1119(05)00634-7.
13. Yarden Y, Sliwkowski MX. Untangling the ErbB signalling network. Nat Rev Mol Cell Biol. 2001; 2:127–37. https://doi.org/10.1038/35052073.
14. Effenberger KE, Borgen E, Eulenburg CZ, Bartkowiak K, Grosser A, Synnestvedt M, Kaaresen R, Brandt B, Nesland JM, Pantel K, Naume B. Detection and clinical relevance of early disseminated breast cancer cells depend on their cytokeratin expression pattern. Breast Cancer Res Treat. 2011; 125:729–38. https://doi.org/10.1007/s10549-010-0911-2.
15. Aktas B, Kasimir-Bauer S, Heubner M, Kimmig R, Wimberger P. Molecular Profiling and Prognostic Relevance of Circulating Tumor Cells in the Blood of Ovarian Cancer Patients at Primary Diagnosis and After Platinum-Based Chemotherapy. Int J Gynecol Cancer. 2011; 21: 822–30.https://doi.org/10.1097/IGC.0b013e318216cb91.
16. Kolostova K, Matkowski R, Jedryka M, Soter K, Cegan M, Pinkas M, Jakabova A, Pavlasek J, Spicka J, Bobek V. The added value of circulating tumor cells examination in ovarian cancer staging. Am J Cancer Res. 2015; 5:3363–75.
17. Bidard FC, Peeters DJ, Fehm T, Nole F, Gisbert-Criado R, Mavroudis D, Grisanti S, Generali D, Garcia-Saenz JA, Stebbing J, Caldas C, Gazzaniga P, Manso L, et al. Clinical validity of circulating tumour cells in patients with metastatic breast cancer: a pooled analysis of individual patient data. Lancet Oncol. 2014; 15:406–14. https://doi.org/10.1016/S1470-2045(14)70069-5.
18. Brandt B, Griwatz C. Two-layer buoyant density centrifugation gradient for enrichment of prostate-derived cells and cell clusters from peripheral blood. Clin Chem. 1996; 42:1881–2.
19. Griwatz C, Brandt B, Assmann G, Zanker KS. An immunological enrichment method for epithelial cells from peripheral blood. J Immunol Methods. 1995; 183:251–65.
20. Obermayr E, Castillo-Tong DC, Pils D, Speiser P, Braicu I, Van Gorp T, Mahner S, Sehouli J, Vergote I, Zeillinger R. Molecular characterization of circulating tumor cells in patients with ovarian cancer improves their prognostic significance -- a study of the OVCAD consortium. Gynecol Oncol. 2013; 128:15–21. https://doi.org/10.1016/j.ygyno.2012.09.021.
21. Fan T, Zhao Q, Chen JJ, Chen WT, Pearl ML. Clinical significance of circulating tumor cells detected by an invasion assay in peripheral blood of patients with ovarian cancer. Gynecol Oncol. 2009; 112:185–91. https://doi.org/10.1016/j.ygyno.2008.09.021.
22. Wimberger P, Roth C, Pantel K, Kasimir-Bauer S, Kimmig R, Schwarzenbach H. Impact of platinum-based chemotherapy on circulating nucleic acid levels, protease activities in blood and disseminated tumor cells in bone marrow of ovarian cancer patients. Int J Cancer. 2011; 128:2572–80. https://doi.org/10.1002/ijc.25602.
23. Aktas B, Kasimir-Bauer S, Heubner M, Kimmig R, Wimberger P. Molecular profiling and prognostic relevance of circulating tumor cells in the blood of ovarian cancer patients at primary diagnosis and after platinum-based chemotherapy. Int J Gynecol Cancer. 2011; 21:822–30. https://doi.org/10.1097/IGC.0b013e318216cb91.
24. Pearl ML, Zhao Q, Yang J, Dong H, Tulley S, Zhang Q, Golightly M, Zucker S, Chen WT. Prognostic analysis of invasive circulating tumor cells (iCTCs) in epithelial ovarian cancer. Gynecol Oncol. 2014; 134:581–90. https://doi.org/10.1016/j.ygyno.2014.06.013.
25. Corr BR, Finlay-Schultz J, Rosen RB, Qamar L, Post MD, Behbakht K, Spillman MA, Sartorius CA. Cytokeratin 5-Positive Cells Represent a Therapy Resistant subpopulation in Epithelial Ovarian Cancer. Int J Gynecol Cancer. 2015; 25:1565–73. https://doi.org/10.1097/IGC.0000000000000553.
26. Taube ET, Denkert C, Sehouli J, Unger U, Kunze CA, Budczies J, Dietel M, Braicu E, Darb-Esfahani S. Cytokeratin 5/6 expression, prognosis and association with ER-alpha in high-grade serous ovarian carcinoma. Hum Pathol. 2017; 67: 30–36. https://doi.org/S0046-8177(17)30105-3.
27. Tot T. Cytokeratins 20 and 7 as biomarkers: usefulness in discriminating primary from metastatic adenocarcinoma. Eur J Cancer. 2002; 38:758–63. https://doi.org/S0959804902000084.
28. Molloy TJ, Roepman P, Naume B, van't Veer LJ. A prognostic gene expression profile that predicts circulating tumor cell presence in breast cancer patients. PLoS One. 2012; 7:e32426. https://doi.org/10.1371/journal.pone.0032426.
29. Liu JF, Kindelberger D, Doyle C, Lowe A, Barry WT, Matulonis UA. Predictive value of circulating tumor cells (CTCs) in newly-diagnosed and recurrent ovarian cancer patients. Gynecol Oncol. 2013; 131:352–6. https://doi.org/10.1016/j.ygyno.2013.08.006.
30. Chebouti I, Kasimir-Bauer S, Buderath P, Wimberger P, Hauch S, Kimmig R, Kuhlmann JD. EMT-like circulating tumor cells in ovarian cancer patients are enriched by platinum-based chemotherapy. Oncotarget. 2017; 8: 48820–48831. https://doi.org/10.18632/oncotarget.16179.
31. Van Berckelaer C, Brouwers AJ, Peeters DJ, Tjalma W, Trinh XB, van Dam PA. Current and future role of circulating tumor cells in patients with epithelial ovarian cancer. Eur J Surg Oncol. 2016; 42:1772–9. https://doi.org/S0748-7983(16)30160-3.
32. Maetzel D, Denzel S, Mack B, Canis M, Went P, Benk M, Kieu C, Papior P, Baeuerle PA, Munz M, Gires O. Nuclear signalling by tumour-associated antigen EpCAM. Nat Cell Biol. 2009; 11:162–71. https://doi.org/10.1038/ncb1824.
33. Ralhan R, He HC, So AK, Tripathi SC, Kumar M, Hasan MR, Kaur J, Kashat L, MacMillan C, Chauhan SS, Freeman JL, Walfish PG. Nuclear and cytoplasmic accumulation of Ep-ICD is frequently detected in human epithelial cancers. PLoS One. 2010; 5:e14130. https://doi.org/10.1371/journal.pone.0014130.
34. Ralhan R, Cao J, Lim T, Macmillan C, Freeman JL, Walfish PG. EpCAM nuclear localization identifies aggressive thyroid cancer and is a marker for poor prognosis. BMC Cancer. 2010; 10:331. https://doi.org/10.1186/1471-2407-10-331.
35. Poveda A, Kaye SB, McCormack R, Wang S, Parekh T, Ricci D, Lebedinsky CA, Tercero JC, Zintl P, Monk BJ. Circulating tumor cells predict progression free survival and overall survival in patients with relapsed/recurrent advanced ovarian cancer. Gynecol Oncol. 2011; 122:567–72. https://doi.org/10.1016/j.ygyno.2011.05.028.
36. Liu JF, Kindelberger D, Doyle C, Lowe A, Barry WT, Matulonis UA. Predictive value of circulating tumor cells (CTCs) in newly-diagnosed and recurrent ovarian cancer patients. Gynecol Oncol. 2013; 131: 352–6. https://doi.org/S0090-8258(13)01084-6.
37. Ghazani AA, Castro CM, Gorbatov R, Lee H, Weissleder R. Sensitive and direct detection of circulating tumor cells by multimarker micro-nuclear magnetic resonance. Neoplasia. 2012; 14:388–95.
38. Nanjundan M, Nakayama Y, Cheng KW, Lahad J, Liu J, Lu K, Kuo WL, Smith-McCune K, Fishman D, Gray JW, Mills GB. Amplification of MDS1/EVI1 and EVI1, located in the 3q26.2 amplicon, is associated with favorable patient prognosis in ovarian cancer. Cancer Res. 2007; 67:3074–84. https://doi.org/67/7/3074.
39. Kim SW, Kim JW, Kim YT, Kim JH, Kim S, Yoon BS, Nam EJ, Kim HY. Analysis of chromosomal changes in serous ovarian carcinoma using high-resolution array comparative genomic hybridization: Potential predictive markers of chemoresistant disease. Genes Chromosomes Cancer. 2007; 46:1–9. https://doi.org/10.1002/gcc.20384.
40. Osterberg L, Levan K, Partheen K, Delle U, Olsson B, Sundfeldt K, Horvath G. Potential predictive markers of chemotherapy resistance in stage III ovarian serous carcinomas. BMC Cancer. 2009; 9:368. https://doi.org/10.1186/1471-2407-9-368.
41. Dimova I, Orsetti B, Negre V, Rouge C, Ursule L, Lasorsa L, Dimitrov R, Doganov N, Toncheva D, Theillet C. Genomic markers for ovarian cancer at chromosomes 1, 8 and 17 revealed by array CGH analysis. Tumori. 2009; 95:357–66.
42. Chekerov R, Braicu I, Castillo-Tong DC, Richter R, Cadron I, Mahner S, Woelber L, Marth C, Van Gorp T, Speiser P, Zeillinger R, Vergote I, Sehouli J. Outcome and clinical management of 275 patients with advanced ovarian cancer International Federation of Obstetrics and Gynecology II to IV inside the European Ovarian Cancer Translational Research Consortium-OVCAD. Int J Gynecol Cancer. 2013; 23:268–75. https://doi.org/10.1097/IGC.0b013e31827de6b9.
43. Rustin GJ, Vergote I, Eisenhauer E, Pujade-Lauraine E, Quinn M, Thigpen T, du Bois A, Kristensen G, Jakobsen A, Sagae S, Greven K, Parmar M, Friedlander M, et al. Definitions for response and progression in ovarian cancer clinical trials incorporating RECIST 1.1 and CA 125 agreed by the Gynecological Cancer Intergroup (GCIG). Int J Gynecol Cancer. 2011; 21:419–23. https://doi.org/10.1097/IGC.0b013e3182070f17.
44. Pils D, Hager G, Tong D, Aust S, Heinze G, Kohl M, Schuster E, Wolf A, Sehouli J, Braicu I, Vergote I, Cadron I, Mahner S, et al. Validating the impact of a molecular subtype in ovarian cancer on outcomes: A study of the OVCAD Consortium. Cancer Sci. 2012; 103: 1334–41.https://doi.org/10.1111/j.1349-7006.2012.02306.x.
45. Orsetti B, Nugoli M, Cervera N, Lasorsa L, Chuchana P, Rouge C, Ursule L, Nguyen C, Bibeau F, Rodriguez C, Theillet C. Genetic profiling of chromosome 1 in breast cancer: mapping of regions of gains and losses and identification of candidate genes on 1q. Br J Cancer. 2006; 95:1439–47. https://doi.org/6603433.
46. Bednarz N, Eltze E, Semjonow A, Rink M, Andreas A, Mulder L, Hannemann J, Fisch M, Pantel K, Weier HU, Bielawski KP, Brandt B. BRCA1 loss preexisting in small subpopulations of prostate cancer is associated with advanced disease and metastatic spread to lymph nodes and peripheral blood. Clin Cancer Res. 2010; 16:3340–8. https://doi.org/10.1158/1078-0432.CCR-10-0150.
47. Kaplan EL, Meier P. Nonparametric estimation from incomplete observations. J Am Stat Assoc. 1958; 53:457–81.
48. Cox DR. Regression models and life tables (with discussion). J R Stat Soc. 1972; 34:187–220.