
INTRODUCTION
Colorectal cancer (CRC) is a major cause of mortality in developing countries, and is the third most commonly diagnosed cancer in men and the second in women [1]. Early stage CRC patients have higher 5-year survival rates than those diagnosed at later stages [2]. Improved early CRC detection methods could reduce patient mortality and improve therapeutic responses and prognoses. Although colonoscopy remains the gold standard for diagnosing precancerous lesions and CRC, this approach is invasive, expensive, and uncomfortable [3], precluding it as a cost effective population-based screening test. Tumor biomarkers, including carcinoembryonic antigen (CEA) and fecal occult blood testing (FOBT), are used clinically, but have relatively low sensitivities and specificities [4-6]. These limitations highlight the need for effective, non-invasive screening tools to facilitate early diagnosis of CRC.
Metabolomics, which investigates global changes in small molecular weight metabolites within a given biological specimen [7-9], is the omics cascade endpoint before phenotype [10]. Metabolomics can be used to assess direct correlations between metabolite and biological phenotype changes. Nuclear magnetic resonance (1H-NMR) spectroscopy-based metabolomics methods used in high-throughput studies require only minimal sample preparation to profile a wide range of metabolites [8, 11]. Profiling of metabolic variations in CRC patient tissues has revealed changes in lactate, amino acids, carboxylic acids, fatty acids, and the urea cycle as compared to normal tissues [9, 12]. CRC patient serum metabolite profiles showed abnormal, tumor-associated proline metabolism, glycolysis, fatty acid metabolism, arginine, and oleamide metabolism regulation [13]. Our recent fecal metabolomic study showed nutrient malabsorption, disrupted bacterial ecology, and increased glycolysis and glutaminolysis in CRC patients [14].
Urine is a biofluid commonly used by metabolomics researchers [15], because it is easy to collect in large volumes and may provide diagnostic information for many cancer types [16, 17], including CRC [18]. Biomarkers in urine may be derived from cell apoptosis, glomerular filtration of blood plasma, cell sloughing, epithelial cell secretion of exosomes, and other processes [19]. Diet-derived metabolic markers may also provide important diagnostic clues [20, 21]. Several studies demonstrated a correlation between CRC and perturbed urinary metabolomic profiles [18, 22-24], but none described cancer stage-specific changes. Our study investigated metabolomic profiles in CRC patients at different stages compared to healthy controls (HC), and attempted to identify patients with early stage disease (stage I/II). CRC-specific urinary profiles were confirmed through comparison with an esophageal cancer (EC) cohort.
RESULTS
CRC patient urine metabolic profiles
Representative 1D 1H-NMR spectra, which provide an overview of all metabolites present in CRC patient and HC urine samples, are shown in Figure 1. Major metabolites were assigned according to previous studies [7, 15] and the Human Metabolome Database (http://www.hmdb.ca/). The aliphatic region at 0.8–4.5 ppm in all spectra included strong signals from water-soluble metabolites, such as lactate, isobutyrate, alanine, glutamate, glutamine, acetone, acetoacetate, creatinine, creatine, cysteine, dimethyl sulfone, malonate, and choline. Isocitrate, hippurate, cysteine, and phenylalanine overlap at 3.96–3.99ppm and are therefore characterized as isocitrate/hippurate/cysteine/phenylalanine in this manuscript.
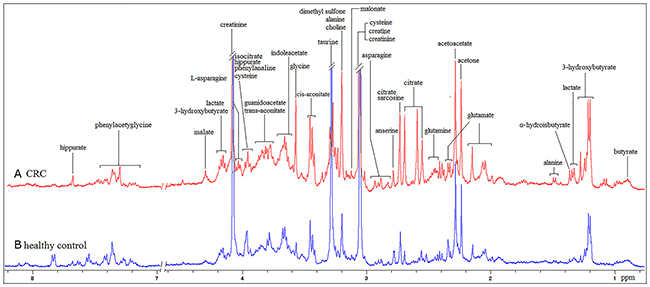
Figure 1: 400 MHz representative urine 1H NMR spectra from one CRC patient (A) and one HC (B), referenced to TSP (0. 0 ppm).
Pattern recognition (PR) analyses between disease groups and HCs
High inter-individual variabilities and complexities in urinary profiles made visual comparisons of these spectra impractical. Instead, we used multivariate analysis to determine consistent variations between data sets [7]. Unsupervised PR was initially carried out using preliminary principal component analysis (PCA) to generate an overview of variations between HCs and CRC patients. Clustering based on disease status was not observed on the scores plot of the first two principal components (Figure 2A). A clear separation between CRC patients and HCs was achieved by supervised orthogonal partial least-squares discriminant analysis (OPLS-DA) scores plot (Figure 2B). The internal validation was perfomed to assess the predictive ability of the corresponding OPLS-DA model (R2Y=0.819, Q2=0.599, CV-ANOVA p<0.01), suggesting that the model was a good fit. To futher evaluate the validity of this model, a random permutation test (200 times) was performed, indicating no overfitting (Figure 2C). To assess the predictive ability of the model using unknown samples, 80% of samples (“training set”, HC=32, CRC=45) were randomly selected to construct an OPLS-DA model, which was then used to predict the remaining 20% (“testing set”, HC=8, CRC=10). Testing set HCs were correctly localized to the training set HC region, and equivalent results were obtained using the CRC testing set (Figure 2D).
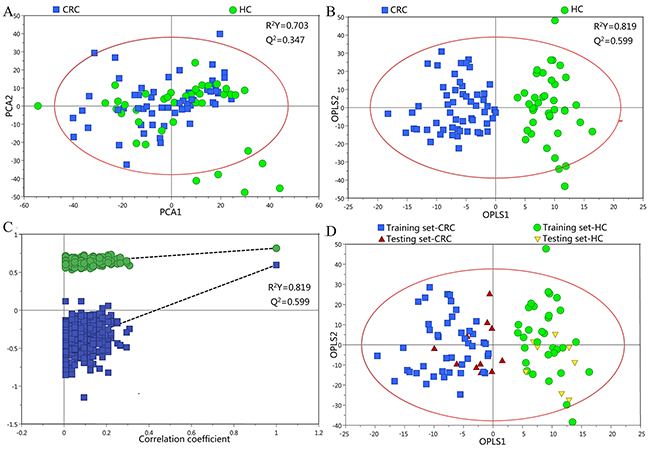
Figure 2: PR of urine metabolomic profiles analyzed using 1H-NMR Spectroscopy. (A) PCA scatter plot of HC (green dots) and CRC patient (blue squares) urine samples. (B) OPLS-DA scatter plot based on the same samples. (C) Statistical validation of the corresponding OPLS-DA model by permutation analysis (200 times). (D) Scores plots of the OPLS-DA prediction model.
Urine profiles from HCs and CRC patients at different stages could be clearly separated using the OPLS-DA scores plot (Figure 3A). Model parameters of the permutation analysis of the different groups were as follows: stage I/II vs HC: R2Y=0.910, Q2=0.534; stage III/IV vs HC: R2Y=0.912, Q2=0.561 (Figure 3B). Urine metabolite differences between early and advanced stage CRC were less pronounced (two components with R2Y=0.414, Q2=-0.454). Model specificity was confirmed via comparison with the EC cohort. The OPLS-DA scores plot revealed clear distinctions between early stage CRC, EC, and HC (Figure 4).
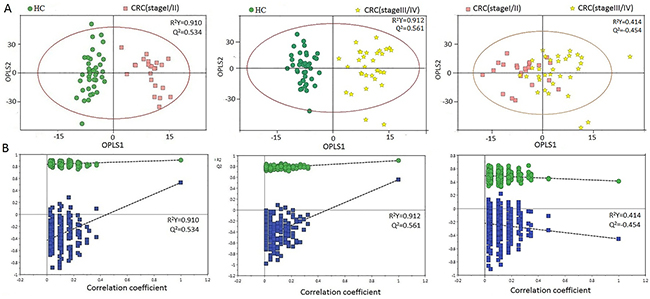
Figure 3: PR analysis of 1H-NMR urine spectra from HCs and different CRC stages. (A) OPLS-DA scatter plot based on HCs and different CRC stages. (B) Statistical validation of the corresponding OPLS-DA model by permutation analysis (200 times).
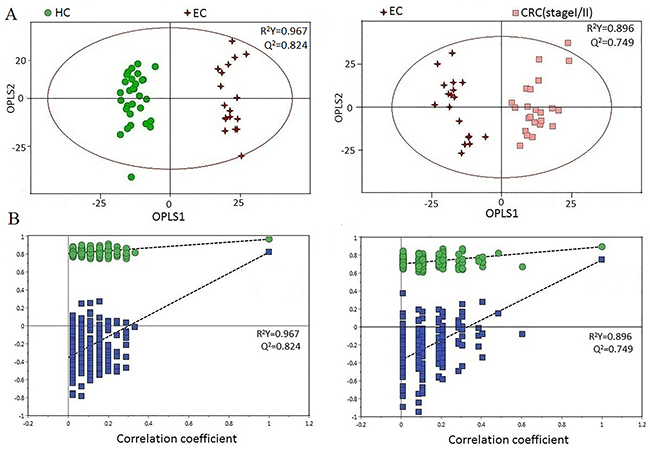
Figure 4: (A) OPLS-DA scatter plot based on EC, HC, and stage-I/II CRC samples. (B) Statistical validation of the corresponding OPLS-DA model by permutation analysis (200 times).
Urinary metabolites contributing to CRC early detection
We used the following conditions to classify urine metabolites as candidate biomarkers for CRC early detection: (1) metabolites with variable importance in the projection (VIP)>1, and (2) metabolites with differing levels (p<0.05 via Mann-Whitney U test) in stage I/II CRC patients vs. HCs. Sixteen of the most significant urine metabolites contributing to patient separation are displayed in Table 1. Among these metabolites, acetoacetate, glutamine, guanidoacetate, cis-aconitate, trans-aconitate, and homocycteine were increased, while creatinine, choline, dimethyl sulfone, asparagine, alanine, methylamine, and isocitrate/hippurate/cysteine/phenylalanine were decreased in the urine of stage I/II CRC patients compared to HCs (p<0.01). Optimal cut-off values, sensitivities, specificities, and AUROC values of these metabolites were shown in Figure 5. Acetoacetate, glutamine, asparagine, and cysteine had relatively high AUC values, sensitivities, and specificities in distinguishing early stage CRC patients from HCs. Alanine, glutamine, aspartic acid, and acetoacetate combined had better diagnostic capabilities than any single metabolite alone in discriminating between early stage CRC patients and HCs, with sensitivity, specificity, and AUC values of 87.5%, 91.3%, and 0.933, respectively (Figure 6).
Table 1: Marker metabolites found in OPLS-DA models of 1H NMR-based urine metabolic profiling between I/II stage of CRC and healthy controls
Top 16 most significant in order |
Chemical shift (ppm) |
I/II stage of CRC vs healthy controls |
Related metabolomic pathway |
||
|---|---|---|---|---|---|
VIPa |
p-valueb |
Variations vs HC |
|||
Choline |
3.19(s) |
2.25 |
0.000 |
↓ |
Choline metabolism, Lipid metabolism |
Phenylalanine |
3.19(m) |
2.25 |
0.000 |
↓ |
Amino acid metabolism, Phenylalanine metabolism |
Asparagine |
2.80(dd) |
1.90 |
0.000 |
↓ |
Urea metabolism, Amino acid metabolism |
Isocitrate |
3.98(d) |
1.84 |
0.005 |
↓ |
TCA cycle |
Cysteine |
3.97(dd) |
1.84 |
0.003 |
↓ |
Amino acid metabolism, Glutamate Metabolism, Glutathione Metabolism |
Hippurate |
3.96(d) |
1.84 |
0.005 |
↓ |
Gut microflora metabolism |
Dimethyl sulfone |
3.138(s) |
1.72 |
0.000 |
↓ |
Gut microflora metabolism, Endogenous methanethiol metabolism |
Creatinine |
3.03(s) |
1.70 |
0.007 |
↓ |
Urea metabolism, Creatinine metabolism |
Alanine |
1.46(d) |
1.67 |
0.017 |
↓ |
Amino acid metabolism, Gluconeogenesis |
Methylamine |
2.59(s) |
1.12 |
0.018 |
↓ |
Gut microflora metabolism, Disulfiram Pathway |
Homocysteine |
2.14(m) |
1.76 |
0.014 |
↑ |
Amino acid metabolism, Methionine metabolism |
Glutamine |
2.12(m) |
1.76 |
0.001 |
↑ |
Glutaminolysis, TCA cycle |
cis-Aconitate |
3.43(d) |
1.64 |
0.043 |
↑ |
TCA cycle, Glyoxylate, Dicarboxylate metabolism |
Acetoacetate |
2.27(s) |
1.59 |
0.009 |
↑ |
Fatty acid metabolism, TCA cycle |
trans-Aconitate |
3.74(s) |
1.54 |
0.019 |
↑ |
TCA cycle |
Guanidoacetate |
3.78(s) |
1.53 |
0.017 |
↑ |
Urea metabolism |
a: Variable importance in the projection (VIP) was obtained from OPLS-DA with a threshold of 1.0.
b: p value was calculated from Mann-Whitney U test.
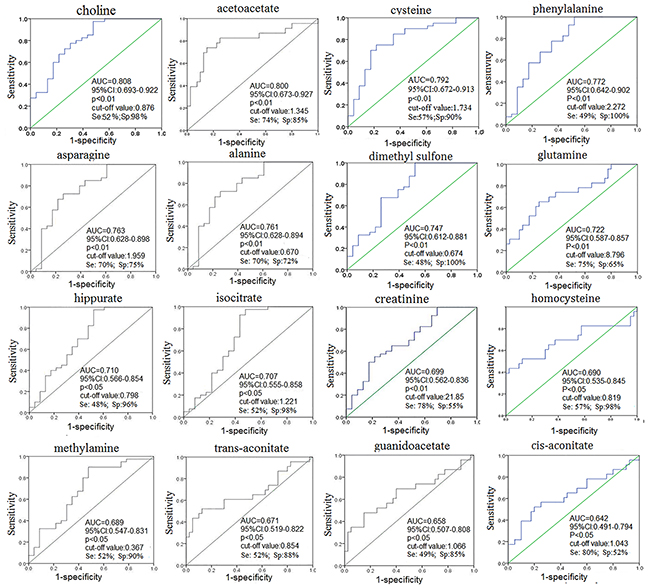
Figure 5: ROC curve of urine metabolites for distinguishing stage I/II CRC patients from HCs.
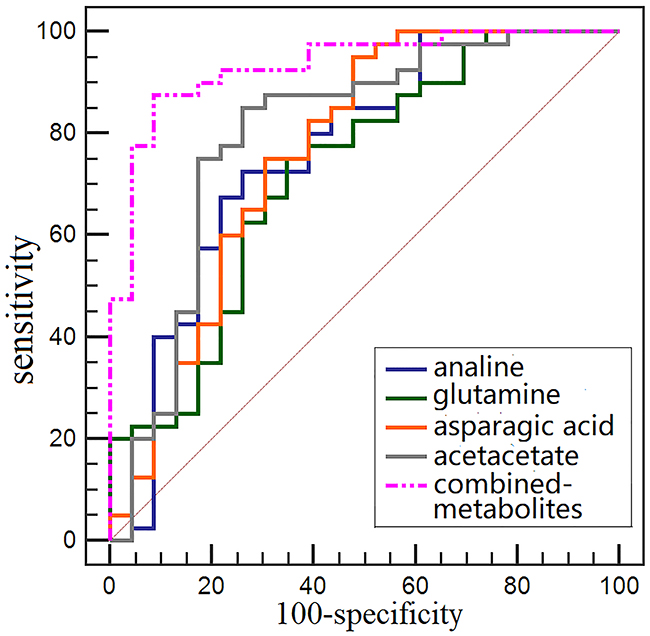
Figure 6: Comparision of single metabolite and combined metabolites ROC curves for distinguishing early stage CRC patients from HCs.
Colorectal cancer-specific metabolomic profiles
Important metabolites for distinguishing CRC from EC patients included the TCA cycle intermediates (fumarate and cis-aconitate), amino acid metabolism (homogentisic acid, indoleacetate), urea metabolism (creatinine, creatine and urea), nucleotide metabolism (thymidine and uracil), gut microflora-derived metabolites (hippurate), glutaminolysis metabolites (glutamine), and others (pyridoxic acid, cinnamic acid, oxypurinol, and trigonelline) (Table 2).
Table 2: Marker metabolites found in OPLS-DA models of 1H NMR-based urine metabolic profiling between stage I/II CRC patients and EC patients
Metabolites |
Chemical shift (ppm) |
I/II stage of CRC vs EC |
Related metabolomic pathway |
||
|---|---|---|---|---|---|
VIPa |
p-valueb |
Variations vs EC |
|||
Thymidine |
6.28(t) |
1.82 |
0.000 |
↑ |
Nucleotide metabolism |
Fumarate |
6.51(s) |
1.71 |
0.000 |
↑ |
TCA cycle, Arginine and Proline metabolism, Aspartate metabolism |
Hippurate |
7.54(m) |
1.47 |
0.036 |
↑ |
Gut microflora metabolism |
cis-Aconitate |
6.58(s) |
1.69 |
0.000 |
↑ |
TCA cycle, Glyoxylate, Dicarboxylate metabolism |
Pyridoxic acid |
7.53(s) |
1.62 |
0.003 |
↑ |
Vitamin B6 metabolism |
Cinnamic acid |
6.51(d) |
1.71 |
0.000 |
↑ |
unknown |
Homogentisic acid |
6.71(m) |
1.23 |
0.000 |
↑ |
Phenylalanine and tyrosine metabolism, Disulfiram pathway |
Indoleacetate |
7.24(m) |
1.23 |
0.002 |
↑ |
Amino acid metabolism, Tryptophan metabolism |
Trigonelline |
8.83(m) |
1.42 |
0.043 |
↑ |
Vitamin metabolism |
Creatinine |
3.03(s) |
1.67 |
0.000 |
↓ |
Urea metabolism, Creatinine metabolism |
Creatine |
3.02(s) |
1.67 |
0.000 |
↓ |
Urea metabolism, Creatine metabolism |
Uracil |
5.79(d) |
1.47 |
0.003 |
↓ |
Pyrimidine metabolism |
Urea |
5.78(br, s) |
1.41 |
0.003 |
↓ |
Urea metabolism |
a: Variable importance in the projection (VIP) was obtained from OPLS-DA with a threshold of 1.0.
b: p value was calculated from Mann-Whitney U test.
DISCUSSION
Apart from genomic and proteomic alterations, CRC development and progression are associated with cellular metabolic changes that may provide insight into disease pathogenesis [8, 9, 12, 14]. Our 1H-NMR-based metabolomic findings identified distinct disturbances to CRC patient urine metabolites, even at stage I/II, compared with HCs, including elevated acetoacetate, guanidoacetate, cis-aconitate, trans-aconitate, glutamine, and homocycteine, and reduced creatinine, phosphorylcholine, dimethyl sulfone, asparagine, alanine, isocitrate, hippurate, methylamine, cysteine, and phenylalanine (Table 1). Altered urine metabolite levels could indicate perturbed amino acid metabolism, glycolysis, TCA cycle, urea cycle, choline metabolism, and gut microflora metabolism. OPLS-DA differentiated metabolic profiles from stage I/II CRC, EC, and HC, indicating that upper and lower gastrointestinal cancers have different metabolomic profiles [25]. Our study assessed important metabolomic variations in CRC patient vs. EC patient and HC urine samples, providing information complementary to that derived from other biofluid-based metabolomics studies, and adding to our understanding of the metabolic mechanisms driving CRC.
While many metabolites that differ between cancer patients and HCs have diagnostic potential, only those with potential biological relevance are of practical use. Choline was the most significantly altered metabolite, with lower levels and higher VIP values in cancer patients. Lower urinary choline levels in CRC are most likely related to increased demand for choline in tumors. Choline contributes to tumor cell phospholipid synthesis, and is integrated into lecithin, a major cell membrane phospholipid component [26]. Consistent with a previous report, as choline demand increases in tumor tissues, blood choline levels drop, leading to decreased urinary choline in CRC patients [27]. Another plausible explanation for decreased urinary choline levels might be its utilization as an alternative methyl group donor for DNA methylation and synthesis in tumor cells [28]. Additionally, levels of the choline precursor, creatinine, were decreased in CRC patient urine samples [29]. Our findings suggest that choline could be a viable biomarker associated with tumor promotion.
Another key altered metabolite is isocitrate, an important intermediate in the TCA cycle (Figure 7). Isocitrate levels were reduced in CRC patient urine compared to that of HCs, suggesting TCA cycle deregulation and increased energy metabolism due to tumor cell activation [30, 31]. Isocitrate can be converted to citrate and α-ketoglutarate, and this process is balanced to allow generation of both ATP and cellular macromolecules to sustain cell growth. Since glucose is the main carbohydrate source for glycolysis and the TCA cycle, increased glycolysis, as previously reported in CRC patient tissue, serum, and fecal metabolomic studies, may also lead to reduced TCA intermediates in urine [12, 14, 32]. However, we observed slightly higher levels of cis-aconitate, a TCA cycle intermediate produced by the dehydration of citrate, in CRC patient urine. This could result from elevation of trans-aconitate, which is then converted into cis-aconitate (Figure 7). Acetoacetate, a catabolite of fatty acids metabolism during calorie restriction, was upregulated in CRC patient urine compared with that of HCs, consistent with increased energy consumption by the tumor. Acetoacetate upregulation leads to increased production of acetyl-CoA, an intermediary that promotes TCA cycle alternative energy utilization in cancers when glucose and TCA intermediates (such as isocitrate) are insufficient [33]. Increased glutamine levels were also observed in early stage CRC urine samples, suggesting augmented glutaminalysis. Glutamine is lysed to glutamate, which can be converted to α-ketoglutarate to increase transit through the citric acid cycle, providing sustainable energy required for rapid cell proliferation [34, 35]. Decreased asparagine with an equivalent increase in guanidoacetate levels observed in CRC urine samples might result from increased urea cycle activity to maintain urea detoxification. Compared to HCs, increased homocysteine and decreased alanine, cysteine, and phenylalanine were measured in CRC patient urine. This could be accounted for by disrupted amino acid metabolism due to epithelium inflammation and injury resulting from bowel disease in CRC patients [36]. The observed depletion of methylamine and hippurate in urine suggests a disruption in the intestinal epithelium and diffusion of gut microbes associated with colorectal tumourigenesis [37]. Among the potential urinary biomarkers, acetoacetate, glutamine, asparagine, and cysteine had relatively high AUC, sensitivity, and specificity values for distinguishing early stage CRC patients from HCs. However, the diagnostic performance of analine, glutamine, aspartic acid, and acetoacetate combined improved discrimination between early stage CRC patients and HCs compared to any single metabolite alone.
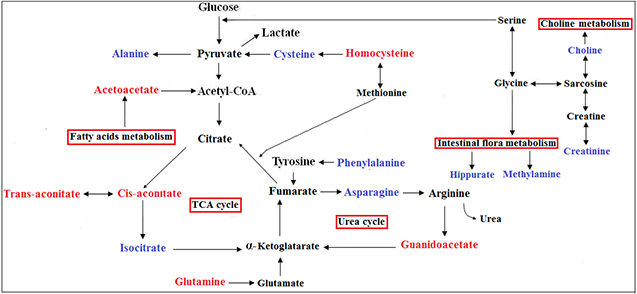
Figure 7: Metabolic pathways that include the most promising potential CRC metabolite biomarkers identified in this study. Red represents metabolites upregulated in CRC, blue represents those downregulated.
To determine whether the urinary metabolic alterations observed here were specific to CRC or reflective of common metabolic changes associated with malignancy, we compared the metabolomic profiles of patients with CRC and EC. We identified key discriminatory metabolites through VIP analysis, which revealed several distinguishing patterns. We also observed overlapping metabolites between CRC and EC, which could reflect metabolic changes associated with shared tumorigenesis pathways, including disturbed gut microflora metabolism and urea metabolism associated with tumor cell proliferation and growth.
Overall, our findings revealed that CRC patient urinary metabolic profiles can be distinguished from those of HCs, even in early stages of disease (stage I/II), supporting the utility of NMR-based urinary metabolomics fingerprinting in early diagnosis of CRC. Our results demonstrate the potential of this noninvasive urinary metabolomic strategy as a complementary diagnostic tool to screen for early CRC tumor-associated metabolic pathway perturbations. While our preliminary results are encouraging, the presence of a given metabolite in urine is the result of complex production, utilization, and glomerular filtration pathways. Therefore, further investigations must be undertaken to assess and validate each metabolite with biomarker potential identified in our study.
MATERIALS AND METHODS
Patient recruitment and sample collection
This study was approved by the Ethics Committee of Shantou University Medical College. Written informed consent was obtained from each subject prior to participation in the study. Preoperative, early-morning midstream urine samples were collected from patients with CRC (n=55) or EC (n=18), and from HCs (n=40), between January and July 2015 at the Second Affiliated Hospital of Shantou University Medical College. Patients did not receive any neoadjuvant chemotherapy or radiation therapy prior to sample collection. Patient samples were categorized according to histopathological features. For all cases, histologic findings were obtained and follow-up data were available to ensure accurate disease classification. No cancer patients had complicating diseases. Exclusion criteria were: breastfeeding, pregnancy, inflammatory conditions, gastrointestinal tract disorder, mental disorder, hypertension, diabetes mellitus, other metabolic diseases, and urinary tract involvement, such as uncontrolled bacterial, viral, or fungal infection,. Healthy controls were age- and gender-matched patients, and had no declared history of cancer or gastrointestinal symptoms. Patient demographic and clinical characteristics are summarized in Table 3.
Table 3: Summary of clinical and demographic features for study subjects and tumor characteristics
|
CRC (55) |
EC (18) |
HC (40) |
||
|---|---|---|---|---|---|
Stage-I/II |
Stage-III/IV |
p value |
|||
Age (median, range) |
61, 27-84 |
59, 38-81 |
|
61, 32-77 |
59, 28-78 |
Sex |
|
|
0.944 |
|
|
Male |
11 |
15 |
|
8 |
19 |
Female |
12 |
17 |
|
10 |
21 |
Cancer site |
|
|
|
|
|
Colon |
10 |
23 |
0.034 |
|
- |
Rectum |
13 |
9 |
|
|
- |
Cervical |
|
|
|
2 |
- |
Upper Thoracic |
|
|
|
3 |
- |
Middle Thoracic |
|
|
|
5 |
- |
Lower Thoracic |
|
|
|
8 |
- |
FOBT |
|
|
0.767 |
|
|
Positive |
9 |
14 |
|
N/A |
N/A |
Negative |
1 |
3 |
|
N/A |
N/A |
Not check |
13 |
15 |
|
|
|
CEA (ng/mL) |
|
|
0.029 |
|
|
Positive |
5 |
18 |
|
5 |
N/A |
Negative |
15 |
11 |
|
3 |
N/A |
Not check |
3 |
3 |
|
|
|
CA199(U/mL) |
|
|
0.563 |
|
|
Positive |
3 |
8 |
|
3 |
N/A |
Negative |
15 |
17 |
|
4 |
N/A |
Not check |
5 |
7 |
|
|
|
Tumor size (cm, Mean ± SD) |
|
|
|
|
|
Major diameter |
5.14±3.28 |
5.38±1.71 |
0.756 |
|
|
Width diameter |
3.90±2.08 |
4.21±1.52 |
0.573 |
|
|
Thick diameter |
1.92±1.14 |
2.38±1.21 |
0.119 |
|
|
Symptoms |
|
|
0.184 |
|
|
Change of stool character |
10 |
18 |
|
|
|
Hematochezia |
12 |
10 |
|
|
|
Abdominal pain |
8 |
9 |
|
|
|
Bowel obstruction |
3 |
2 |
|
|
|
Weight |
|
|
0.779 |
|
|
<50kg |
5 |
8 |
|
|
|
≥50kg |
18 |
24 |
|
|
|
Urine sample preparation
The preservative, sodium azide (50 μL), was added to each urine sample before storing at -80°C. Frozen urine samples were thawed at room temperature and mixed to suspend any settled precipitate. Then, 300 μl PB/D2O buffer (0.1 M, pH=7.4) was added to 600 μl of each sample, and the mixture was vortexed and then centrifuged at 8,000 rpm for 10 min. Finally, a stock solution of sodium (3-trimethylsilyl)-2,2,3,3-tetradeuteriopropionate (TSP)/D2O (50 μL) was added to each supernatant prior to analysis via 1H NMR spectroscopy.
1H NMR spectroscopy
Urine 1H NMR spectra were obtained on a Bruker AVII 400.13 MHz 1H-NMR spectrometer (Bruker Biospin, Germany) using a one-dimensional NOESY (nuclear overhauser enhancement spectroscopy) pulse sequence [RD-90°-t1-90°-tm-90°-ACQ] with the following acquisition parameters: recycle delay, RD=1.5 s; t1=3 μs; mixing time, tm=100 ms; 90° pulse width=7.3 μs; number of scans, NS=256; number of points, TD=32768; spectral width, SW=8012.82 Hz; acquisition time, AQ=2.04 s. Water suppression was achieved via irradiation of the water peak during RD and tm.
1H NMR spectral data processing
All 1H NMR spectra were multiplied by a 0.3 Hz exponential line broadening prior to Fourier Transformation, and then were corrected for phase and baseline distortion and calibrated to TSP at 0.0 ppm. 1H-NMR data complexity was reduced through segmentation of the spectral range from 0.5–9.0 ppm with the equal width of 0.004 ppm. The imperfect water signal from 5.5–4.5 ppm was discarded, and each bucket was internally normalized to the total integral of the spectrum prior to pattern recognition.
Pattern recognition (PR) analysis and cross validation
To establish a global overview of differences between CRC and EC patients and between CRC patients and HCs, a multivariate analysis was applied to 1H NMR spectra data as previously described [14]. Normalized 1H NMR spectral data sets were unit variance scaled, and then analyzed using the SIMCA-P+ program (version 14.1, Umetrics AB; Umeå, Sweden). A PCA model was applied to the mean-centered, normalized 1H NMR spectra to detect general trends and outliers, followed by OPLS-DA. Model quality was evaluated using R2Y and Q2 values, which reflect the explained fraction of variance and model predictability. VIP values of all peaks from OPLS-DA models were taken as a coefficient for peak selection. VIP was represented by a unitless number; the higher the value, the greater the discriminatory power of the metabolite. Those variables with VIP>1 were considered potential biomarker candidates for group discrimination.
Statistical analysis
Relative concentrations of those metabolites with VIP>1 were calculated by integrating the signals in the spectra. Differences between stage I/II CRC patients and HCs were assessed using the Mann-Whitney U test and, p<0.05 was considered statistically significant. Receiver operating characteristic (ROC) analysis was performed in SPSS 16.0 to further evaluate the diagnostic power of potential biomarkers. The area under the ROC curve (AUROC), specificity, sensitivity, and accuracy of the metabolites were calculated, where AUROC>0.8 indicated excellent diagnostic performance.
ACKNOWLEDGMENTS
We are extremely grateful to Dr Deborah K. Hill (Norwegian University of Science and Technology, Norway) for useful suggestions and careful language revisions of our manuscript.
CONFLICTS OF INTEREST
The authors declare that they have no conflicts of interest.
GRANT SUPPORT
The work was supported by the National Natural Science Foundation of China (81471729, 81101102), the Science and Technology Planning Project of Guangdong Province (2016A020216025), the Research Award Fund for Outstanding Young Teachers in Higher Education Institutions, Guangdong Province (YQ2015245), and the National Natural Science Foundation of Guangdong Province (S2011010004973).
REFERENCES
1. Torre LA, Bray F, Siegel RL, Ferlay J, Lortet-Tieulent J, Jemal A. Global cancer statistics, 2012. CA Cancer J Clin. 2015;65:87-108.
2. Terzić J, Grivennikov S, Karin E, Karin M. Inflammation and colon cancer. Gastroenterology. 2010;138:2101-14.e5.
3. Boras Z, Kondza G, Sisljagić V, Busić Z, Gmajnić R, Istvanić T. Prognostic factors of local recurrence and survival after curative rectal cancer surgery: a single institution experience. Coll Antropol. 2012;36:1355-61.
4. Ransohoff DF, Lang CA. Screening for colorectal cancer with the fecal occult blood test: a background paper. American College of Physicians. Ann Intern Med. 1997;126:811-22.
5. Wang YR, Yan JX, Wang LN. The diagnostic value of serum carcino-embryonic antigen, alpha fetoprotein and carbohydrate antigen 19-9 for colorectal cancer. J Cancer Res Ther. 2014;10:307-9.
6. Li Destri G, Rubino AS, Latino R, Giannone F, Lanteri R, Scilletta B, Di Cataldo A. Preoperative carcinoembryonic antigen and prognosis of colorectal cancer. An independent prognostic factor still reliable. Int Surg. 2015;100:617-25.
7. Carrola J, Rocha CM, Barros AS, Gil AM, Goodfellow BJ, Carreira IM, Bernardo J, Gomes A, Sousa V, Carvalho L, Duarte IF. Metabolic signatures of lung cancer in biofluids: NMR-based metabonomics of urine. J Proteome Res. 2011;10:221-30.
8. Bezabeh T, Somorjai R, Dolenko B, Bryskina N, Levin B, Bernstein CN, Jeyarajah E, Steinhart AH, Rubin DT, Smith IC. Detecting colorectal cancer by 1H magnetic resonance spectroscopy of fecal extracts. NMR Biomed. 2009;22:593-600.
9. Tian Y, Xu T, Huang J, Zhang L, Xu S, Xiong B, Wang Y, Tang H. Tissue metabonomic phenotyping for diagnosis and prognosis of human colorectal cancer. Sci Rep. 2016;6:20790.
10. Ikeda A, Nishiumi S, Shinohara M, Yoshie T, Hatano N, Okuno T, Bamba T, Fukusaki E, Takenawa T, Azuma T, Yoshida M. Serum metabolomics as a novel diagnostic approach for gastrointestinal cancer. Biomed Chromatogr. 2012;26:548-58.
11. Monleón D, Morales JM, Barrasa A, López JA, Vázquez C, Celda B. Metabolite profiling of fecal water extracts from human colorectal cancer. NMR Biomed. 2009;22:342-8.
12. Wang H, Wang L, Zhang H, Deng P, Chen J, Zhou B, Hu J, Zou J, Lu W, Xiang P, Wu T, Shao X, Li Y, et al. (1)H NMR-based metabolic profiling of human rectal cancer tissue. Mol Cancer. 2013;12:121.
13. Farshidfar F, Weljie AM, Kopciuk K, Buie WD, Maclean A, Dixon E, Sutherland FR, Molckovsky A, Vogel HJ, Bathe OF. Serum metabolomic profile as a means to distinguish stage of colorectal cancer. Genome Med. 2012;4:42.
14. Lin Y, Ma C, Liu C, Wang Z, Yang J, Liu X, Shen Z, Wu R. NMR-based fecal metabolomics fingerprinting as predictors of earlier diagnosis in patients with colorectal cancer. Oncotarget. 2016;7:29454-64. https://doi.org/10.18632/oncotarget.8762.
15. Bouatra S, Aziat F, Mandal R, Guo AC, Wilson MR, Knox C, Bjorndahl TC, Krishnamurthy R, Saleem F, Liu P, Dame ZT, Poelzer J, Huynh J, et al. The human urine metabolome. PLoS One. 2013;8:e73076.
16. Theodorescu D, Wittke S, Ross MM, Walden M, Conaway M, Just I, Mischak H, Frierson HF. Discovery and validation of new protein biomarkers for urothelial cancer: a prospective analysis. Lancet Oncol. 2006;7:230-40.
17. M’Koma AE, Blum DL, Norris JL, Koyama T, Billheimer D, Motley S, Ghiassi M, Ferdowsi N, Bhowmick I, Chang SS, Fowke JH, Caprioli RM, Bhowmick NA. Detection of pre-neoplastic and neoplastic prostate disease by MALDI profiling of urine. Biochem Biophys Res Commun. 2007;353:829-34.
18. Qiu Y, Cai G, Su M, Chen T, Liu Y, Xu Y, Ni Y, Zhao A, Cai S, Xu LX, Jia W. Urinary metabonomic study on colorectal cancer. J Proteome Res. 2010;9:1627-34.
19. Pisitkun T, Johnstone R, Knepper MA. Discovery of urinary biomarkers. Mol Cell Proteomics. 2006;5:1760-71.
20. Yuan JM, Gao YT, Yang CS, Yu MC. Urinary biomarkers of tea polyphenols and risk of colorectal cancer in the Shanghai Cohort Study. Int J Cancer. 2007;120:1344-50.
21. Ju J, Hong J, Zhou JN, Pan Z, Bose M, Liao J, Yang GY, Liu YY, Hou Z, Lin Y, Ma J, Shih WJ, Carothers AM, Yang CS. Inhibition of intestinal tumorigenesis in Apcmin/+ mice by (-)-epigallocatechin-3-gallate, the major catechin in green tea. Cancer Res. 2005;65:10623-31.
22. Cheng Y, Xie G, Chen T, Qiu Y, Zou X, Zheng M, Tan B, Feng B, Dong T, He P, Zhao L, Zhao A, Xu LX, et al. Distinct urinary metabolic profile of human colorectal cancer. J Proteome Res. 2012;11:1354-63.
23. Hsu WY, Chen WT, Lin WD, Tsai FJ, Tsai Y, Lin CT, Lo WY, Jeng LB, Lai CC. Analysis of urinary nucleosides as potential tumor markers in human colorectal cancer by high performance liquid chromatography/electrospray ionization tandem mass spectrometry. Clin Chim Acta. 2009;402:31-7.
24. Arasaradnam RP, McFarlane MJ, Ryan-Fisher C, Westenbrink E, Hodges P, Thomas MG, Chambers S, O'Connell N, Bailey C, Harmston C, Nwokolo CU, Bardhan KD, Covington JA. Detection of colorectal cancer (CRC) by urinary volatile organic compound analysis. PLoS One. 2014;9:e108750.
25. Davis VW, Schiller DE, Eurich D, Sawyer MB. Urinary metabolomic signature of esophageal cancer and Barrett’s esophagus. World J Surg Oncol. 2012;10:271.
26. Glunde K, Penet MF, Jiang L, Jacobs MA, Bhujwalla ZM. Choline metabolism-based molecular diagnosis of cancer: an update. Expert Rev Mol Diagn. 2015;15:735-47.
27. Nitter M, Norgård B, de Vogel S, Eussen SJ, Meyer K, Ulvik A, Ueland PM, Nygård O, Vollset SE, Bjørge T, Tjønneland A, Hansen L, Boutron-Ruault M, et al. Plasma methionine, choline, betaine, and dimethylglycine in relation to colorectal cancer risk in the European Prospective Investigation into Cancer and Nutrition (EPIC). Ann Oncol. 2014;25:1609-15.
28. Zeisel SH. Dietary choline deficiency causes DNA strand breaks and alters epigenetic marks on DNA and histones. Mutat Res. 2012;733:34-8.
29. Wyss M, Kaddurah-Daouk R. Creatine and creatinine metabolism. Physiol Rev. 2000;80:1107-213.
30. Halabe Bucay A. The biological significance of cancer: mitochondria as a cause of cancer and the inhibition of glycolysis with citrate as a cancer treatment. Med Hypotheses. 2007;69:826-8.
31. Denkert C, Budczies J, Weichert W, Wohlgemuth G, Scholz M, Kind T, Niesporek S, Noske A, Buckendahl A, Dietel M, Fiehn O. Metabolite profiling of human colon carcinoma--deregulation of TCA cycle and amino acid turnover. Mol Cancer. 2008;7:72.
32. Qiu Y, Cai G, Su M, Chen T, Zheng X, Xu Y, Ni Y, Zhao A, Xu LX, Cai S, Jia W. Serum metabolite profiling of human colorectal cancer using GC-TOFMS and UPLC-QTOFMS. J Proteome Res. 2009;8:4844-50.
33. Dawiskiba T, Deja S, Mulak A, Ząbek A, Jawień E, Pawełka D, Banasik M, Mastalerz-Migas A, Balcerzak W, Kaliszewski K, Skóra J, Barć P, Korta K, et al. Serum and urine metabolomic fingerprinting in diagnostics of inflammatory bowel diseases. World J Gastroenterol. 2014;20:163-74.
34. Curthoys NP, Watford M. Regulation of glutaminase activity and glutamine metabolism. Annu Rev Nutr. 1995;15:133-59.
35. Wise DR, Thompson CB. Glutamine addiction: a new therapeutic target in cancer. Trends Biochem Sci. 2010;35:427-33.
36. Trinchieri G. Cancer and inflammation: an old intuition with rapidly evolving new concepts. Annu Rev Immunol. 201;30:677-706.
37. Williams HR, Cox IJ, Walker DG, North BV, Patel VM, Marshall SE, Jewell DP, Ghosh S, Thomas HJ, Teare JP, Jakobovits S, Zeki S, Welsh KI, et al. Characterization of inflammatory bowel disease with urinary metabolic profiling. Am J Gastroenterol. 2009;104:1435-44.