
INTRODUCTION
Carotid artery atherosclerosis is associated with a high risk of cardiovascular disease (CVD) and stroke [1-4]. The carotid intima-media thickness (CIMT) is determined using ultrasonography and is thus a noninvasive marker of early atherosclerotic disease [5-7] that has been proven in epidemiological and clinical studies to be a useful predictor of cardiovascular events [8-11]. Furthermore, traditional cardiovascular risk factors have been shown to be determinants of CIMT in the general population [7].
CVD has become the leading cause of death, accounting for almost one-third of all deaths globally in 2013 [12]. Recently, the burden of CVD has become the most important public health issue in China; death due to CVD accounted for more than 40% of total deaths, 44.6% of deaths in rural areas, and 42.5% of deaths in urban areas [13]. Furthermore, as reported in our previous study, there was a dramatically increased incidence of first-ever stroke among a low-income Chinese population in rural China from 1992 to 2012, with an annual percentage change of 6.5% [14]. Concurrently, the prevalence of conventional risk factors has also significantly increased in this population over the past several decades [15, 16].
The relationship between conventional risk factors and CIMT is controversial. Traditional and common vascular risk factors, such as hypertension, diabetes mellitus (DM), dyslipidemia, and smoking, have been reported to be associated with increased CIMT [4, 17-24]. Moreover, systolic blood pressure (SBP), glucose levels, and cholesterol levels have also been reported to be associated to CIMT [25-30]. Several studies reported thicker carotid walls in diabetic patients than in individuals with normal fasting glucose levels [31-34]. In diabetic populations, CIMT was associated with fasting glucose concentrations [34-36]. However, the quantitative relationship between fasting glucose concentration and CIMT in a non-diabetic population, which accounts for more than 80% of the population in China, is unclear, especially in China. We thus aimed to assess the relationship between FPG levels and CIMT among the general non-diabetic population in China.
RESULTS
Participant characteristics
A total of 3509 participants were analyzed in this study, including 1461 (41.6%) men and 2048 (58.4%) women. The mean age was 59.82 years overall (60.14 years in men, 58.88 years in women). The average level of education was 5.52 years (6. 40 years in men, 4.88 years in women), with a range of 0 to 16 years. The illiteracy group comprised 17.2% of participants, the 1–6 years of education group comprised 44.5%, the 7–9 years of education group comprised 30.8%, and the >9 years of education group comprised 7.6%. The overall prevalence rates for the evaluated risk factors were as follows: hypertension, 67.1%; central obesity, 34.3%; current smoking, 25.3%; and alcohol consumption, 16.0%. Moreover, there were significant associations between the different mean CIMT and sex, age, education level, hypertension, current smoking, and alcohol consumption. Elevated mean CIMT were associated with the increased levels of systolic blood pressure (SBP), diastolic blood pressure (DBP), and FPG (all P < 0.05; Table 1).
Table 1: Description of demographic characteristics for all participants by mean CIMT groups in this study
Risk factors |
Overall |
< 0.5075 |
0.5075~ |
0.5525~ |
≥0.6075 |
P |
|---|---|---|---|---|---|---|
Total: |
3509 |
831 (23.7) |
893 (25.4) |
895 (25.5) |
890 (25.4) |
<0.001 |
Men |
1461 (41.6) |
274 (18.8) |
322 (22.0) |
380 (26.0) |
485 (33.2) |
|
Women |
2048 (58.4) |
557 (27.2) |
571 (27.9) |
515 (25.1) |
405 (19.8) |
|
Age, means (SD), years |
59.82 (9.77) |
55.65 (8.59) |
58.13 (8.96) |
61.10 (9.50) |
64.13 (9.85) |
0.005 |
Age group, n (%) |
<0.001 |
|||||
45~54 years |
1166 (33.2) |
427 (51.4) |
361 (40.4) |
230 (25.7) |
148 (12.7) |
|
55~64 years |
1391 (19.6) |
289 (34.8) |
351 (39.3) |
400 (44.7) |
351 (25.2) |
|
65~74 years |
655 (18.7) |
90 (10.8) |
134 (15.0) |
173 (19.3) |
258 (39.4) |
|
≥75 years |
297 (8.5) |
25 (3.0) |
47 (5.3) |
92 (10.3) |
133 (14.9) |
|
Education, means (SD), years |
5.52 (3.54) |
6.20 (3.32) |
5.84 (3.47) |
5.18 (3.58) |
4.90 (3.63) |
0.011 |
Education, n (%) |
<0.001 |
|||||
0 years |
602 (17.2) |
97 (11.7) |
132 (14.8) |
179 (20.0) |
194 (21.8) |
|
1~6 years |
1561 (44.5) |
333 (40.1) |
380 (42.6) |
414 (46.3) |
434 (48.8) |
|
7~9 years |
1081 (30.8) |
335 (40.3) |
306 (34.3) |
235 (26.3) |
205 (23.0) |
|
> 9 years |
265 (7.6) |
66 (7.9) |
75 (8.4) |
67 (7.5) |
57 (6.4) |
|
Hypertension, n (%) |
2355 (67.1) |
433 (52.1) |
556 (62.3) |
654 (73.1) |
715 (80.0) |
<0.001 |
Central obesity, n (%) |
1204 (34.3) |
271 (32.6) |
320 (35.8) |
345 (38.5) |
268 (30.1) |
0.467 |
Current smoking, n (%) |
887 (25.3) |
171 (20.6) |
202 (22.6) |
227 (25.4) |
287 (32.2) |
<0.001 |
Alcohol consumption, n (%) |
560 (16.0) |
104 (12.5) |
139 (15.6) |
141 (15.8) |
176 (19.8) |
<0.001 |
SBP, means (SD), mmHg |
145.93 (22.08) |
138.68 (20.16) |
142.46 (20.05) |
149.35 (22.40) |
152.76 (22.73) |
<0.001 |
DBP, means (SD), mmHg |
86.75 (11.41) |
85.21 (11.10) |
86.12 (10.93) |
87.75 (11.63) |
87.82 (11.89) |
0.032 |
TC, means (SD), mmol/L |
4.85 (1.07) |
4.79 (1.07) |
4.85 (1.09) |
4.84 (1.05) |
4.93 (1.08) |
0.917 |
TG, means (SD), mmol/L |
1.73 (1.22) |
1.76 (1.18) |
1.72 (1.08) |
1.79 (1.26) |
1.66 (1.35) |
0.173 |
HDL-C, means (SD), mmol/L |
1.46 (0.46) |
1.49 (0.46) |
1.46 (0.46) |
1.46 (0.48) |
1.44 (0.44) |
0.202 |
LDL-C, means (SD), mmol/L |
2.68 (1.23) |
2.54 (1.19) |
2.63 (1.21) |
2.64 (1.24) |
2.89 (1.24) |
0.998 |
FPG, means (SD), mmol/L |
5.70 (1.06) |
5.58 (0.97) |
5.65 (0.99) |
5.69 (0.94) |
5.87 (1.28) |
<0.001 |
Risk factors associated with mean CIMT and increased CIMT in the univariate analysis
Male sex, older age, hypertension, current smoking, alcohol consumption, and higher levels of FPG, TC, and LDL-C were associated with elevated mean CIMT in the univariate analysis (all P < 0.001). However, higher education levels and higher levels of TG and HDL-C were associated with a lower mean CIMT (all P < 0.05; Table 2).
Table 2: Associated factors of mean CIMT for all participants in this study by univariate analysis
Risk factors |
Means (SD)/ β (SE)* |
OR 95% CI/95% CI for β |
P |
|---|---|---|---|
Gender: |
— |
< 0.001 |
|
Men |
58.28 (9.31) |
||
Women |
55.46 (8.27) |
||
Smoking, n (%) |
— |
< 0.001 |
|
Yes |
58.20 (9.56) |
||
No |
56.10 (8.50) |
||
Alcohol consumption, n (%) |
— |
< 0.001 |
|
Yes |
58.30 (9.70) |
||
No |
56.31 (8.62) |
||
Hypertension, n (%) |
— |
< 0.001 |
|
Yes |
57.89 (9.00) |
||
No |
54.06 (7.88) |
||
Central obesity, n (%) |
— |
0.199 |
|
Yes |
56.37 (8.35) |
||
No |
56.77 (9.07) |
||
Levels of fasting glucose, n (%) |
< 0.001 |
||
< 5.1 mmol/L |
55.83 (8.63) |
1.00 |
|
5.1 mmol/L ~ |
55.97 (8.31) |
1.01 (0.80, 1.26) |
0.960 |
5.5 mmol/L ~ |
56.88 (8.96) |
1.19 (0.95, 1.49) |
0.125 |
≥ 6.0 mmol/L |
57.79 (9.27) |
1.49 (1.20, 1.85) |
<0.001 |
Age |
2.62 (0.15) |
2.33, 2.90 |
< 0.001 |
Education |
-3.25 (0.42) |
-4.07, -2.44 |
< 0.001 |
FBG |
7.46 (1.41) |
4.69, 10.22 |
< 0.001 |
TC |
3.88 (1.34) |
1.14, 6.62 |
< 0.001 |
TG |
-2.91 (1.23) |
-5.32, -0.50 |
0.018 |
HDL-C |
-6.49 (3.26) |
-12.88, -0.11 |
0.046 |
LDL-C |
7.46 (1.22) |
5.07, 9.85 |
< 0.001 |
*Categorized variables were presented as means (SD); continuous variables were presented as β (SE).
Similar findings were found for increased CIMT. Male sex, older age, hypertension, central obesity, current smoking, alcohol consumption, and higher levels of FPG, TC, and LDL-C were associated with a greater frequency of increased CIMT in the univariate analysis (all P < 0.05). However, higher education levels and higher levels of TG were associated with a lower frequency of increased CIMT (Table 3).
Table 3: Associated factors of increased CIMT for all participants in this study by univariate analysis
Risk factors |
References |
OR (95% CI) |
P |
|---|---|---|---|
Men |
Women |
2.02 (1.73, 2.35) |
< 0.001 |
Age |
— |
1.06 (1.05, 1.07) |
< 0.001 |
Education |
— |
0.94 (0.92, 0.96) |
< 0.001 |
Current smoking |
Never smoking |
1.60 (1.36, 1.89) |
< 0.001 |
Alcohol drinking |
Never drinking |
1.44 (1.13, 1.75) |
< 0.001 |
Hypertension |
No |
2.38 (1.18, 2.85) |
< 0.001 |
Central obesity |
No |
0.78 (0.66, 0.91) |
0.002 |
FBG level: |
< 5.1mmol/L |
||
5.1 mmol/L ~ |
1.01 (0.80, 1.26) |
0.960 |
|
5.5 mmol/L ~ |
1.19 (0.95, 1.49) |
0.125 |
|
≥ 6.0 mmol/L |
1.49 (1.20, 1.85) |
< 0.001 |
|
TC |
— |
1.09 (1.02, 1.17) |
0.012 |
TG |
— |
0.93 (0.87, 0.99) |
0.034 |
HDL-C |
— |
0.99 (0.75, 1.05) |
0.174 |
LDL-C |
— |
1.20 (1.13, 1.27) |
< 0.001 |
Association between FPG levels and mean CIMT in different multiple linear regression models
FPG levels were significantly associated with mean CIMT (Figure 1); each 1-mmol/L increase in FPG resulted in a 7.46-μm increase in mean CIMT before adjusting for other factors (P < 0.001). There was a 4.58-μm increase in mean CIMT with each 1-mmol/L increase in FPG in model 1 when adjusted by age, sex, and education level (P = 0.001), and there was a 2.98-μm increase in mean CIMT with each 1-mmol/L increase in FPG in model 2, which was adjusted by age, sex, education levels, current smoking status, alcohol consumption, and hypertension (P = 0.028); a 2.75-μm increase in mean CIMT was observed with each 1-mmol/L increase in FPG in model 3 when adjusted by age, sex, education levels, current smoking status, alcohol consumption, hypertension, and levels of TC, TG, HDL-C, and LDL-C (P = 0.044; Table 4).
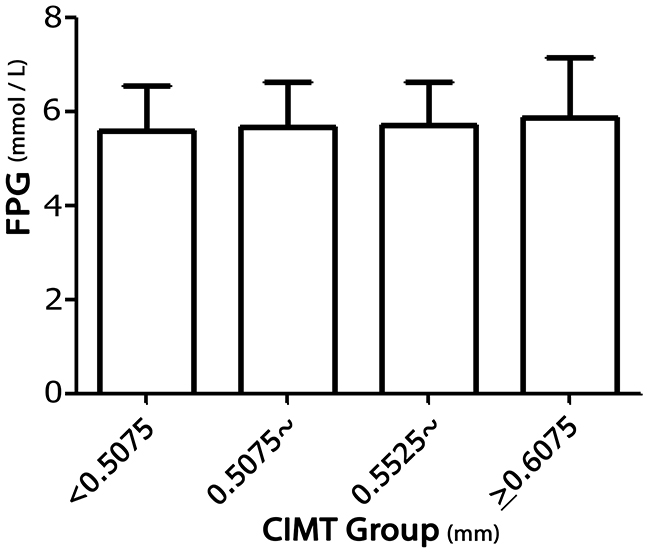
Figure 1: Association between FPG levels and mean CIMT in rural China.
Table 4: Association of the level of FPG with the mean CIMT for all participants in this study
Risk factors |
β |
SE |
95% CI for β |
P |
|---|---|---|---|---|
Unadjusted |
7.46 |
1.41 |
4.69, 10.22 |
< 0.001 |
Adjusted: |
||||
Model 1 |
4.58 |
1.35 |
1.93, 7.22 |
0.001 |
Model 2 |
2.98 |
1.35 |
0.33, 5.62 |
0.028 |
Model 3 |
2.75 |
1.37 |
0.07, 5.43 |
0.044 |
*model 1 was adjusted by age, gender, and education; model 2 was adjusted by age, gender, education, current smoking, alcohol consumption, and hypertension; model 3 was adjusted by age, gender, education, current smoking, alcohol consumption, hypertension, TC, TG, HDL-C, and LDL-C.
Association between FPG levels and the frequency of increased CIMT in different multiple linear regression models
Table 5 shows that the frequency of increased CIMT was 49% higher in those with FPG levels ≥6.0 mmol/L than in those with FPG levels <5.1 mmol/L in the univariate analysis. However, the association between FPG and increased CIMT leveled off after adjusting by age, sex, education level, current smoking status, alcohol consumption, hypertension, central obesity, and levels of TC, TG, and LDL-C.
Table 5: Association of the level of FPG with increased CIMT for all participants in this study
Risk factors |
< 5.1 |
5.1~ |
5.5~ |
≥6.0 |
|||
|---|---|---|---|---|---|---|---|
OR |
Value |
P |
Value |
P |
Value |
P |
|
Cases, n (%) |
179 (22.6) |
212 (22.7) |
— |
230 (25.8) |
— |
269 (30.3) |
— |
Unadjusted OR (95%CI) |
1.00 |
1.01 (0.80, 1.26) |
0.960 |
1.19 (0.95, 1.49) |
0.125 |
1.49 (1.20, 1.85) |
<0.001 |
Adjusted OR (95%CI): |
|||||||
Model 1 |
1.00 |
0.98 (0.77, 1.24) |
0.847 |
1.09 (0.86, 1.38) |
0.467 |
1.24 (0.99, 1.56) |
0.067 |
Model 2 |
1.00 |
0.94 (0.74, 1.19) |
0.609 |
1.03 (0.81, 1.30) |
0.834 |
1.11 (0.88, 1.40) |
0.392 |
Model 3 |
1.00 |
0.98 (0.76, 1.25) |
0.845 |
1.07 (0.83, 1.37) |
0.605 |
1.15 (0.90, 1.47) |
0.257 |
*model 1 was adjusted by age, gender, and education; model 2 was adjusted by age, gender, education, current smoking, alcohol consumption, hypertension, and central obesity; model 3 was adjusted by age, gender, education, current smoking, alcohol consumption, hypertension, central obesity, TC, TG, and LDL-C.
DISCUSSION
In the present study, we assessed the impact of FPG on the mean CIMT and the increased CIMT among middle-aged and elderly non-diabetic adults in a low-income Chinese population. We found that a higher FPG level was associated with an elevated mean CIMT in the multivariate analysis; each 1-mmol/L increase in FPG resulted in a 2.75-μm increase in mean CIMT after adjusting for age, sex, education level, current smoking status, alcohol consumption, hypertension, and the levels of TC, TG, HDL-C, and LDL-C. However, there was not a significant relationship between the level of FPG and the frequency of increased CIMT.
The association between FPG and CIMT has remained controversial, although it has been well established that an elevated FPG level was associated with an increased risk of CVD [37-39].
Previous studies have demonstrated that there was no significant association between FPG and CIMT after adjustment by several covariates, including age, sex, and previous disease history [40-44]. Hyperglycemia was significantly related to CIMT in univariate analyses, but not in the multivariate analysis after adjustment for covariates [45-47]. An association between FPG and CIMT was not found in other studies after adjusting for conventional risk factors [41, 46, 48, 49]. However, the CIMT was significantly greater in those with type 2 diabetes after adjusting for body mass index (BMI), cholesterol, and hypertension [34]. Fasting glucose was not an independent risk factor for CVD when it was added to a prediction model that included sex and CVD risk factors [39]. Furthermore, other studies have indicated that higher HbA1c levels were significantly and independently related to increased CIMT, but impaired fasting glucose (IFG) was not [47, 50]. Nevertheless, a positive association between FPG and CIMT was shown in previous studies [51, 52]. A recent community-based study conducted in Japan reported that IFG was significantly associated with increased CIMT [52]. In the ARIC study, CIMT was significantly greater in patients with type 2 diabetes after adjusting for BMI, cholesterol, and hypertension [53]. Moreover, another study demonstrated that in those with fasting glucose levels <7.0 mmol/L, there was no significant association between fasting glucose and CIMT [47, 50].
Consistent with that study, in this study, we found a significant relationship between FPG and mean CIMT after adjusting for age, sex, educational level, hypertension, current smoking, and levels of TC, TG, HDL-C, and LDL-C. The findings in this study suggest that FPG level is an independent determinant of mean CIMT. The mechanisms between glucose and atherosclerosis may be explained by increased oxidative stress or nonenzymatic glycosylation of proteins and lipids [54].
The disparity between results of the current study and of previous studies with respect to the association between blood glucose level and CIMT may be explained by different populations (i.e., the inclusion of those with normal glucose levels, those with diabetes mellitus, or the entire population), different designs (i.e., hospital-based, community-based, or population-based), and/or different parameters related to blood glucose (FPG, impaired glucose tolerance test, and HbA1c). In the present study, diabetes mellitus was defined with respect to an FPG level >7.0 mmol/L, but not to HbA1c. Moreover, the duration of diabetes mellitus was not available in this study, and we have noted this as a limitation.
Given that the association of the level of FPG with the increased CIMT, there was no statistical significant in this study. The lower mean CIMT in this population may partly explain the negative association between FPG and increased CIMT in this study.
CIMT has been associated with a number of traditional risk factors, including age, sex, hypertension, smoking, lipid profile, and BMI [46]. In agreement with the findings of previous studies, we found a highly significant association between increased mean CIMT and male sex, older age, hypertension, and increased levels of LDL-C among non-diabetic subjects in the present study. Low socio-economic status, defined as low education, low income, or employment in a manual occupation, has been shown to be associated with increased CIMT [55-57]. Consistent with these findings, a negative association between mean CIMT and education level was observed in this population. However, the association between education and CIMT was of marginal significance.
There were several limitations in this study. First, the study population was from a local town in Tianjin, China, so the findings may not be generalizable to the overall Chinese population. Second, the cross-sectional study design may have led to a selection bias and limited the power of causal inference. However, our inclusion of only stroke- and CVD-free participants may have reduced this bias. Third, only fasting glucose levels were measured; oral glucose tolerance tests were not conducted, and HbA1c levels were not measured. This may have resulted in an underestimation of the number of participants with diabetes.
MATERIALS AND METHODS
Study population
This was a population-based cross-sectional study conducted from April 2014 to January 2015. The study design has been described previously [58]. In brief, the total population included 14,251 persons from among 18 administrative villages. All residents aged 45 years and over without known diagnoses of CVD and diabetes were recruited to this study.
Among 5380 eligible residents, a total of 4012 individuals participated in the survey. The response rate was 75%. Finally, after excluding 223 residents with a previous history of CVD or stroke and 280 subjects with previous histories of diabetes, 3509 subjects were assessed in this study (Figure 1).
All investigative protocols were approved by the ethics committee of Tianjin Medical University General Hospital; the methods were carried out in accordance with the approved guidelines, and informed consent was obtained from all participants.
Data collection
We performed an interview and physical examinations according to the prespecified time table. A questionnaire was used to collect all information in this study. Trained epidemiological researchers administered the survey through face-to-face interviews.
Demographic information including sex, date of birth, and education level were obtained from previous records. All participants were categorized into four age groups: 45–54 years, 55–64 years, 65–74 years, and ≥75 years. Education level was categorized into three groups according to educational years: illiteracy (without education), 1–6 years, and >6 years.
Risk factors and FPG levels
Previous individual medical histories, which included hypertension, diabetes mellitus, stroke, transient ischemic attack, and coronary heart disease, were obtained according to patient self-reporting or from previous records.
Lifestyle characteristics included cigarette smoking and alcohol consumption. Cigarette smoking was defined as smoking more than 1 cigarette per day for at least 1 year, and participants were categorized as never smokers, ever smokers (ceased smoking for at least 6 months), and current smokers. Alcohol consumption was defined as drinking more than 500 grams of alcohol per week for at least 1 year, and participants were categorized into the never alcohol consumption, ever alcohol consumption (temperance for at least 6 months), and current alcohol consumption groups.
Hypertension was defined as a blood pressure level of 140/90 mmHg or higher, or use of antihypertensive medication, given that the subjects were aware of being hypertensive. Self-reported diabetes cases and the date of diagnoses were validated using previous medical records.
Among all subjects without diabetes, FPG measurements were performed during the interview. All participants were categorized into four groups according to the interquartile ranges of FPG, defined as FPG <5.1 mmol/L, 5.1–5.4 mmol/L, 5.5–5.9 mmol/L, and ≥6.0 mmol/L.
Anthropometric and laboratory measurements
Height, weight, waist circumference, and blood pressure were measured based on standardized protocols. BMI was calculated as weight in kilograms divided by height squared (in square meters). Central obesity was defined as a waist circumference ≥102 cm in men and ≥88 cm in women [59].
Blood specimens were collected after fasting during the periods of study and were separated into 3 tubes: one was kept in the tube with separator gel and EDTA anticoagulant for measurement of glucose, and the other two were kept in the tube with EDTA anticoagulant for measurement of lipids. After blood collection, blood samples were put in a cool bag and then sent to the local central laboratory by a specially-assigned person within 2 hours. The plasma levels of fasting glucose, TC, TG, HDL-C, and LDL-C were measured by means of hexokinase used automatic biomedical analyzer (TBA-2000FR, TOSHIBA, Japan) at the Ji County People’s Hospital.
Measurement of CIMT
All participants underwent ultrasonographic measurements between April 2014 and July 2014, and all records were analyzed between August 2014 and January 2015. All scans were recorded on Vascular Research Tools 6 (MIA, LLC) for subsequent off-line analysis.
One trained technician blinded to individuals’ previous disease histories performed all ultrasound examinations using B-mode ultrasonography (Terason 3000; Burlington, MA, US) with a 5–12-MHz linear array transducer. The CIMT of the far wall of the distal common carotid artery (CCA) was measured as the distance from the leading side of the first echogenic line (lumen-intima interface) to the leading side of the second line (media-adventitia interface). Extracranial carotid artery trees, which included the CCA, the bifurcation, and the internal and external carotid arteries on both sides, were screened for plaque. Examinations included bilateral observation of the longitudinal and transverse views of the CCA. The trained technician performed the carotid ultrasonography with the participants lying in the supine position with the neck extended in mild lateral rotation.
CIMT at the near and far walls of the common carotid artery were measured on the left and right sides, and 3 values were obtained: the maximum CIMT, minimum CIMT, and average CIMT. Images were obtained and digitally stored according to a standard protocol. The CIMT of the far wall was determined over a length of 10 mm beginning 0–5 mm from the dilatation of the distal CCA. The inter-observer and intra-observer correlation coefficients ranged from 0.88 to 0.94 and from 0.80 to 0.95 for both sides of the CIMT measurement, respectively.
Increased CIMT was defined as the fourth quartile for the mean CIMT, with a mean CIMT of ≥0.6075 cm.
Statistical analyses
Baseline characteristics of the study population were calculated according to FPG categories. Continuous variables are presented as means with standard deviations and were compared between groups using analyses of variance. Categorical variables are presented as numbers with frequencies, and were compared using chi-squared tests. Linear regression models were used to assess the relationship between FPG level and the mean CIMT. The dependent variable was mean CIMT, and the independent variables were the categorical variables (sex, current smoking, alcohol consumption, and hypertension) and continuous measures (age, education level, and levels of TC, TG, HDL-C, and LDL-C). The linear regression models were established as follows: model 1, adjusted for age, sex, and education; model 2, adjusted for age, sex, education, current smoking, alcohol consumption, hypertension; and model 3, adjusted by age, sex, education, current smoking, alcohol consumption, hypertension, the levels of TC, TG, HDL-C, and LDL-C. The regression coefficient β was interpreted as the increase in CIMT per unit increase of the continuous variable, or the mean CIMT larger in a given category compared to the category of reference. The relationship between the level of FPG and increased CIMT was evaluated by a logistic regression analysis and presented as unadjusted odds ratios (ORs) (95% confidence interval [CI]) for univariate analyses and as adjusted ORs (95% CI) for multivariate analyses. The dependent variables were increased CIMT (yes or no), and the independent variables included categorical variables (sex, current smoking, alcohol consumption, hypertension, and central obesity) as well as continuous measures (age, education level, and levels of TC, TG, and LDL-C). P values < 0.05 in two-tailed tests were considered statistically significant. SPSS for Windows (version 15.0; SPSS Inc., Chicago, IL, USA) was used for analyses.
CONCLUSIONS
This study assessed the association between mean CIMT and FPG among non-diabetic subjects with a high incidence of stroke in China. We found that a higher level of FPG was associated with an elevated mean CIMT after adjusting for age, sex, education level, current smoking status, alcohol consumption, hypertension, and the levels of TC, TG, HDL-C, and LDL-C. However, the relationship between FPG and the frequency of increased CIMT was not significant after adjusting for covariates. These findings indicate that FPG is an independent determinant of mean CIMT in a non-diabetic population. Management and control of FPG levels is crucial for preventing atherosclerosis in populations with high stroke risks in China.
NOTICE OF GRANT SUPPORT
This study was funded by Tianjin Medical University General Hospital.
Abbreviations
CIMT: carotid intima-media thickness
FPG: fasting plasma glucose
CVD: cardiovascular disease
SBP: systolic blood pressure
FPG: fasting blood glucose
TC: total cholesterol
TG: triglycerides
LDL-C: low-density lipoprotein cholesterol
DBP: diastolic blood pressure
HDL-C: high-density lipoprotein cholesterol
BMI: body mass index.
Authors’ contributions
JW and XN obtained funding for this study, and were involved in conception and design, data collection, data interpretation, and critical review for this article. JW, XN were involved in data analysis for this article. YG was involved in manuscript drafting. YG, CY, MS, JN, YW, HG, LB, JT, XN, and JW were involved in data collection, case diagnosis and confirmation for this article. All authors reviewed the manuscript.
ACKNOWLEDGMENTS
We thank all participants of the Tianjin Brain Study, and local medical care professionals for their valuable contributions; and thank Mr. yueqian Ning for advice on revision of the manuscript.
CONFLICTS OF INTEREST
The authors declare no competing financial interest.
FUNDING
None.
REFERENCES
1. Cao JJ, Arnold AM, Manolio TA, Polak JF, Psaty BM, Hirsch CH, Kuller LH, Cushman M. Association of carotid artery intima-media thickness, plaques, and C-reactive protein with future cardiovascular disease and all-cause mortality: the Cardiovascular Health Study. Circulation. 2007; 116:32–8.
2. Lorenz MW, von Kegler S, Steinmetz H, Markus HS, Sitzer M. Carotid intima-media thickening indicates a higher vascular risk across a wide age range: prospective data from the Carotid Atherosclerosis Progression Study (CAPS). Stroke. 2006; 37:87–92.
3. Kuo F, Gardener H, Dong C, Cabral D, Della-Morte D, Blanton SH, Elkind MS, Sacco RL, Rundek T. Traditional Cardiovascular Risk Factors Explain the Minority of the Variability in Carotid Plaque. Stroke. 2012; 43:1755–60.
4. Rundek T, Arif H, Boden-Albala B, Elkind MS, Paik MC, Sacco RL. Carotid plaque, a subclinical precursor of vascular events: the Northern Manhattan study. Neurology. 2008; 70:1200–7.
5. Bots ML, Sutton-Tyrrell K. Lessons from the past and promises for the future for carotid intima-media thickness. J Am Coll Cardiol. 2012; 60:1599–604.
6. van den Oord SC, Sijbrands EJ, ten Kate GL, van Klaveren D, van Domburg RT, van der Steen AF, Schinkel AF. Carotid intima-media thickness for cardiovascular risk assessment: Systematic review and meta-analysis. Atherosclerosis. 2013; 228:1–11.
7. Touboul PJ, Grobbee DE, den Ruijter H. Assessment of subclinical atherosclerosis by carotid intima media thickness: Technical issues. Eur J Prev Cardiol. 2012; 19:18–24.
8. Lorenz MW, Markus HS, Bots ML, Rosvall M, Sitzer M. Prediction of clinical cardiovascular events with carotid intima-media thickness: a systematic review and meta-analysis. Circulation. 2007; 115:459–67.
9. Jeng JS, Sun Y, Lee JT, Lin RT, Chen CH, Po HL, Lin HJ, Liu CH, Sun MH, Sun MC, Chern CM, Lien LM, Chiu HC, et al. The efficacy and safety of cilostazol in ischemic stroke patients with peripheral arterial disease (SPAD): protocol of a randomized, double-blind, placebo-controlled multicenter trial. Int J Stroke. 2015; 10:123–7.
10. Yokoyama H, Katakami N, Yamasaki Y. Recent advances of intervention to inhibit progression of carotid intima-media thickness in patients with type 2 diabetes mellitus. Stroke. 2006; 37; 2420–7.
11. Simon A, Megnien JL, Chironi G. The value of carotid intima-media thickness for predicting cardiovascular risk. Arterioscler Thromb Vasc Biol. 2010; 30:182–5.
12. GBD 2013 Mortality and Causes of Death Collaborators. Global, regional, and national age-sex specific all-cause and cause-specific mortality for 240 causes of death, 1990-2013: a systematic analysis for the Global Burden of Disease Study 2013. Lancet. 2015; 385:117–71.
13. National Center for Cardiovascular Diseases, China. Report on Cardiovascular Diseases in China. Encyclopedia of China Publishing House, 2016.
14. Wang J, An Z, Li B, Yang L, Tu J, Gu H, Zhan C, Liu B, Su TC, Ning X. Increasing stroke incidence and prevalence of risk factors in a low-income Chinese Population. Neurology. 2015; 84:374–81.
15. Wang J, Ning X, Yang L, Lu H, Tu J, Jin W, Zhang W, Su TC. Trends of hypertension prevalence, awareness, treatment and control in rural areas of northern China during 1991-2011. J Hum Hypertens. 2014; 28:25–31.
16. Ning X, Zhan C, Yang Y, Yang L, Tu J, Gu H, Su TC, Wang J. Secular Trends in Prevalence of Overweight and Obesity among Adults in Rural Tianjin, China from 1991 to 2011: A Population-Based Study. PLOS One. 2015; 9:e116019.
17. Chambless LE, Heiss G, Folsom AR, Rosamond W, Szklo M, Sharrett AR, Clegg LX. Association of coronary heart disease incidence with carotid arterial wall thickness and major risk factors: the Atherosclerosis Risk in Communities (ARIC) Study, 1987-1993. Am J Epidemiol. 1997; 146:483–94.
18. Bots ML, Hoes AW, Koudstaal PJ, Hofman A, Grobbee DE. Common carotid intima-media thickness and risk of stroke and myocardial infarction: the Rotterdam Study. Circulation. 1997; 96:1432–7.
19. Mannami T, Konishi M, Baba S, Nishi N, Terao A. Prevalence of asymptomatic carotid atherosclerotic lesions detected by high-resolution ultrasonography and its relation to cardiovascular risk factors in the general population of a Japanese city: the Suita study. Stroke. 1997; 28:518–25.
20. O’Leary DH, Polak JF, Kronmal RA, Kittner SJ, Bond MG, Wolfson SK Jr, Bommer W, Price TR, Gardin JM, Savage PJ. Distribution and correlates of sonographically detected carotid artery disease in the Cardiovascular Health Study. The CHS Collaborative Research Group. Stroke. 1992; 23:1752–60.
21. Kuller L, Borhani N, Furberg C, Gardin J, Manolio T, O’Leary D, Psaty B, Robbins J. Prevalence of subclinical atherosclerosis and cardiovascular disease and association with risk factors in the Cardiovascular Health Study. Am J Epidemiol. 1994; 139:1164–79.
22. Davis PH, Dawson JD, Riley WA, Lauer RM. Carotid intimal-medial thickness is related to cardiovascular risk factors measured from childhood through middle age the Muscatine study. Circulation. 2001; 104:2815–9.
23. Urbina EM, Srinivasan SR, Tang R, Bond MG, Kieltyka L, Berenson GS; Bogalusa Heart Study. Impact of multiple coronary risk factors on the intima-media thickness of different segments of carotid artery in healthy young adults. Am J Cardiol. 2002; 90:953–8.
24. Koskinen J, Kähönen M, Viikari JS, Taittonen L, Laitinen T, Rönnemaa T, Lehtimäki T, Hutri-Kähönen N, Pietikäinen M, Jokinen E, Helenius H, Mattsson N, Raitakari OT, Juonala M. Conventional cardiovascular risk factors and metabolic syndrome in predicting carotid intima-media thickness progression in young adults. Circulation. 2009; 120:229–36.
25. O’Leary DH, Polak JF, Kronmal RA, Savage PJ, Borhani NO, Kittner SJ, Tracy R, Gardin JM, Price TR, Furberg CD. Thickening of the carotid wall. A marker for atherosclerosis in the elderly? Cardiovascular Health Study Collaborative Research Group. Stroke. 1996; 27:224–31.
26. Polak JF, Pencina MJ, Meisner A, Pencina KM, Brown LS, Wolf PA, D’Agostino RB Sr. Associations of carotid artery intima-media thickness (IMT) with risk factors and prevalent cardiovascular disease: comparison of mean common carotid artery IMT with maximum internal carotid artery IMT. J Ultrasound Med. 2010; 29:1759–68.
27. Duggirala R, González Villalpando C, O’Leary DH, Stern MP, Blangero J. Genetic basis of variation in carotid artery wall thickness. Stroke. 1996; 27:833–7.
28. Tan TY, Lu CH, Lin TK, Liou CW, Chuang YC, Schminke U. Factors associated with gender difference in the intima-media thickness of the common carotid artery. Clin Radiol. 2009; 64:1097–103.
29. O’Leary DH, Polak JF, Kronmal RA, Manolio TA, Burke GL, Wolfson SK Jr. Carotid-artery intima and media thickness as a risk factor for myocardial infarction and stroke in older adults. Cardiovascular Health Study Collaborative Research Group. N Engl J Med. 1999; 340:14–22.
30. Rundek T, Blanton SH, Bartels S, Dong C, Raval A, Demmer RT, Cabral D, Elkind MS, Sacco RL, Desvarieux M. Traditional risk factors are not major contributors to the variance in carotid intima-media thickness. Stroke. 2013; 44:2101–8.
31. Lehmann ED, Riley WA, Clarkson P, Gosling RG. Non-invasive assessment of cardiovascular disease in diabetes mellitus. Lancet. 1997; 350:14–9.
32. Kawamori R, Yamasaki Y, Matsushima H, Nishizawa H, Nao K, Hougaku H, Maeda H, Handa N, Matsumoto M, Kamada T. Prevalence of carotid atherosclerosis in diabetic Patients. Diabetes Care. 1992; 15:1290–4.
33. Taniwaki H, Kawagishi T, Emoto M, Shoji T, Kanda H, Maekawa K, Nishizawa Y, Morii H. Correlation between the intima-media thickness of the carotid artery and aortic pulse-wave velocity in patients with type II diabetes. Diabetes Care. 1999; 22:1851–7.
34. Folsom AR, Eckfeldt JH, Weitzman S, Ma J, Chambless LE, Barnes RW, Cram KB, Hutchinson RG. Relation of carotid artery wall thickness to diabetes mellitus, fasting glucose and insulin, body size, and physical activity. Atherosclerosis risk in communities (ARIC) Study Investigators. Stroke. 1994; 25:66–73.
35. Salomaa V, Riley W, Kark JD, Nardo C, Folsom AR. Non-insulindependent diabetes mellitus and fasting glucose and insulin concentrations are associated with arterial stiffness indexes. The ARIC study. Circulation. 1995; 91:1432–43.
36. Mazza A, Motti C, Nulli A, Marra G, Gnasso A, Pastore A, Federici G, Cortese C. Lack of association between carotid intima-media thickness and methylenetetrahydrofolate reductase gene polymorphism or serum homocysteine in noninsulin-dependent diabetes mellitus. Metabolism. 2000; 49:718–23.
37. Ford ES, Zhao G, Li C. Pre-diabetes and the risk for cardiovascular disease. A systematic review of the evidence. J Am Coll Cardiol. 2010; 55:1310–7.
38. Stern MP, Fatehi P, Williams K, Haffner SM. Predicting future cardiovascular disease. Do we need the oral glucose tolerance test? Diabetes Care. 2002; 25:1851–6.
39. Meigs JB, Nathan DM, D’Agostino RB Sr, Wilson PW; Framingham Offspring Study. Fasting and postchallenge glycemia and cardiovascular disease risk. The Framingham Offspring Study. Diabetes Care. 2005; 25:1845–50.
40. Faeh D, William J, Yerly P, Paccaud F, Bovet P. Diabetes and prediabetes are associated with cardiovascular risk factors and carotid/femoral intima-media thickness independently of markers of insulin resistance and adiposity. Cardiovasc Diabetol. 2007; 6:32.
41. Hanefeld M, Temelkova-Kurktschiev T, Schaper F, Henkel E, Siegert G, Koehler C. Impaired fasting glucose is not a risk factor for atherosclerosis. Diabet Med. 1999; 16:212–8.
42. Hanefeld M, Koehler C, Schaper F, Fuecker K, Henkel E, Temelkova-Kurktschiev T. Postprandial plasma glucose is an independent risk factor for increased carotid intima-media thickness in non-diabetic individuals. Atherosclerosis. 1999; 144:229–35.
43. Goya K, Kitamura T, Inaba M, Otsuki M, Yamamoto H, Kurebayashi S, Sumitani S, Saito H, Kouhara H, Kasayama S, Kawase I. Risk factors for asymptomatic atherosclerosis in Japanese type 2 diabetic patients without diabetic microvascular complications. Metabolism. 2003; 52:1302–6.
44. Temelkova-Kurktschiev TS, Koehler C, Henkel E, Leonhardt W, Fuecker K, Hanefeld M. Postchallenge Plasma Glukose and Glycemic Spikes Are More Strongly Associated With Atherosclerosis Than Fasting Glucose or HbA1c Level. Diabetes Care. 2000; 23:1830–4.
45. Temelkova-Kurktschiev T, Koehler C, Schaper F, Henkel E, Hahnefeld A, Fuecker K, Siegert G, Hanefeld M. Relationship between fasting plasma glucose, atherosclerosis risk factors and carotid intima media thickness in non-diabetic individuals. Diabetologia. 1998; 41:706–12.
46. Kowall B, Ebert N, Then C, Thiery J, Koenig W, Meisinger C, Rathmann W, Seissler J. Associations between blood glucose and carotid intima-media thickness disappear after adjustment for shared risk factors: the KORA F4 study. PLoS One. 2012; 7:e52590.
47. Huang Y, Bi Y, Wang W, Xu M, Xu Y, Li M, Wang T, Chen Y, Li X, Ning G. Glycated hemoglobin A1c, fasting plasma glucose, and two-hour postchallenge plasma glucose levels in relation to carotid intima-media thickness in Chinese with normal glucose tolerance. J Clin Endocrinol Metab. 2011; 96:E1461–5.
48. Brohall G, Schmidt C, Behre CJ, Hulthe J, Wikstrand J, Fagerberg B. Association between impaired glucose tolerance and carotid atherosclerosis: A study in 64-year-old women and a meta-analysis. Nutr Metab Cardiovasc Dis. 2009; 19:327–33.
49. Bonora E, Kiechl S, Oberhollenzer F, Egger G, Bonadonna RC, Muggeo M, Willeit J. Impaired glucose tolerance, type II diabetes mellitus and carotid atherosclerosis: prospective results from the Bruneck Study. Diabetologia. 2000; 43:156–64.
50. Sarwar N, Aspelund T, Eiriksdottir G, Gobin R, Seshasai SR, Forouhi NG, Sigurdsson G, Danesh J, Gudnason V. Markers of dysglycaemia and risk of coronary heart disease in people without diabetes: Reykjavik prospective study and systematic review. PLoS Med. 2010; 25:e1000278.
51. Fitch KV, Stavrou E, Looby SE, Hemphill L, Jaff MR, Grinspoon SK. Association of cardiovascular risk factors with two surrogate markers of subclinical atherosclerosis: Endothelial function and carotid intima media thickness. Atherosclerosis. 2011; 217:437–40.
52. Mukai N, Ninomiya T, Hata J, Hirakawa Y, Ikeda F, Fukuhara M, Hotta T, Koga M, Nakamura U, Kang D, Kitazono T, Kiyohara Y. Association of hemoglobin A1c and glycated albumin with carotid atherosclerosis in community-dwelling Japanese subjects: the Hisayama Study. Cardiovasc Diabetol. 2015; 14:84.
53. Chambless LE, Folsom AR, Davis V, Sharrett R, Heiss G, Sorlie P, Szklo M, Howard G, Evans GW. Risk factors for progression of common carotid atherosclerosis: the Atherosclerosis Risk in Communities Study, 1987-1998. Am J Epidemiol. 2002; 155:38–47.
54. Aronson D. Hyperglycemia and the pathobiology of diabetic complications. Adv Cardiol. 2008; 45:1–16.
55. Ranjit N, Diez-Roux AV, Chambless L, Jacobs DR Jr, Nieto FJ, Szklo M. Socioeconomic differences in progression of carotid intima-media thickness in the Atherosclerosis Risk in Communities study. Arterioscler Thromb Vasc Biol. 2006; 26:411–6.
56. Murray ET, Diez Roux AV, Carnethon M, Lutsey PL, Ni H, O’Meara ES. Trajectories of neighborhood poverty and associations with subclinical atherosclerosis and associated risk factors: the multi-ethnic study of atherosclerosis. Am J Epidemiol. 2010; 171:1099–108.
57. Carson AP, Rose KM, Catellier DJ, Kaufman JS, Wyatt SB, Diez-Roux AV, Heiss G. Cumulative socioeconomic status across the life course and subclinical atherosclerosis. Ann Epidemiol. 2007; 17:296–303.
58. Zhan C, Shi M, Yang Y, Pang H, Fei S, Bai L, Liu B, Tu J, Huo Y, Ning X, Zhang Y, Wang J. Prevalence and Risk Factors of Carotid Plaque Among Middle-aged and Elderly Adults in Rural Tianjin, China. Sci Rep. 2016; 31:23870.
59. Ministries of Health and Science and Technology and the National Bureau of Statistics of the Peoples Republic of China. The nutrition and health status of the Chinese people. People’s Medical Publishing House; 2005.