
INTRODUCTION
Hepatocellular carcinoma (HCC) has the sixth highest cancer morbidity and the second highest mortality rate worldwide. The ratio of deaths to new cases for liver cancer is 0.95 each year, while colorectal cancer, which has a better prognosis, is 0.51 [1]. Currently, the diagnosis of HCC relies on biopsy, imaging reports (ultrasound B, CT or MRI) and alpha feto-protein (AFP), according to the American Association for the Study of Liver Diseases (AASLD) Practice Guidelines. However, the sensitivity and specificity of AFP is barely satisfactory [2], necessitating the discovery of circulating biomarkers with a higher diagnostic value. After screening a host of novel biomarkers, including DNAs, RNAs, proteins and low-molecular-weight metabolites [2, 3], we selected two methodology: the detection of serum microRNAs and metabolomics based on gas chromatography/mass spectrometry (GC/MS), validated their diagnostic value and established appropriate models.
MicroRNAs are small, endogenous, non-coding RNAs that can regulate the expression of genes at the post-transcriptional level [4]. MicroRNAs can be released into peripheral blood when liver cell damage occurs [5]. During the past ten years, decades of studies have shown that diverse microRNAs possess great potential for the diagnosis of HCC. Therefore, it is essential to summarize the diagnostic efficiencies of these microRNAs via a systematic review. It is a pity that there are deficiencies in the published systematic reviews and meta-analyses. Some of these studies reviewed only one microRNA [6–9], while others conducted a meta-analysis including the whole diagnostic tests, but lacked the information on each microRNA [10–13]. We tried to overcome these disadvantages by selecting seven microRNAs with high Youden indexes and area under the curve (AUC) values of the receiver operating curve (ROC) to develop a diagnostic panel.
Metabolomics is defined as the quantitative measurement of all small molecule metabolites in an organism at a specified time under specific environmental conditions [14]. Rapid development in metabolomics has made it a promising technology in disease diagnosis and biomarker generation [15]. Compared with other metabolomic techniques, such as nuclear magnetic resonance (NMR) and liquid chromatography/mass spectrometry (LC/MS), GC/MS has a more robust result and is widely used in metabolite identification based on its high sensitivity, peak resolution, and reproducibility [16]. Several studies have reported the diagnostic value of metabolomics in HCC [17]. We further validated the diagnostic accuracy of GC/MS analysis and compared the most frequently used statistical methods.
RESULTS
Study selection and literature characteristics
The initial search from the databases and other sources returned a total of 590 articles, of which, 226 were from PubMed, 271 were from Embase, and 93 were from the Chinese Biomedical Literature Database (CBM). After removing 131 duplicates, 372 irrelevant studies and five articles that failed to provide enough diagnostic information, 82 published studies were enrolled into this systematic review (Supplementary Table 1). A total of 6035 HCC patients and 8181 healthy control (HCs) were included. The characteristics of the 82 studies are displayed in Supplementary Table 2.
Diagnostic value of microRNAs in the literature
92 microRNAs were mentioned in the included articles, of which, 65 were studied in a single article. We conducted the meta-analyses to represent the diagnostic accuracy of the other 27 microRNAs. The details of their corresponding diagnostic value are shown in Table 1.
Table 1: Characteristics of the microRNAs mentioned in the literature
MicroRNA |
Expression |
HCC sample size |
Control sample size |
Sensitivity (%) |
Specificity (%) |
AUC |
Number of included articles |
|---|---|---|---|---|---|---|---|
miR-223 |
Upregulated & Downregulated |
253 |
235 |
93.3 |
84.2 |
0.950 |
4 |
miR-146a |
Upregulated |
112 |
167 |
96.4 |
67.1 |
0.940 |
1 |
miR-30c |
Downregulated |
55 |
110 |
81.8 |
71.8 |
0.932 |
1 |
miR-152 |
Downregulated |
112 |
145 |
88.6 |
87.8 |
0.930 |
2 |
miR-186 |
Upregulated |
55 |
110 |
78.2 |
63.6 |
0.927 |
1 |
miR-595 |
Upregulated |
87 |
31 |
81.7 |
93.2 |
0.920 |
1 |
miR-130b |
Upregulated |
57 |
59 |
87.7 |
81.4 |
0.913 |
1 |
miR-130a |
Upregulated |
112 |
42 |
96.4 |
78.4 |
0.910 |
1 |
miR-338 |
Upregulated & Downregulated |
156 |
257 |
87.1 |
86.8 |
0.910 |
3 |
miR-34a |
Upregulated |
112 |
167 |
98.6 |
73.3 |
0.910 |
1 |
miR-182 |
Upregulated |
203 |
315 |
83.1 |
86.5 |
0.910 |
3 |
miR-30e |
Downregulated |
39 |
31 |
92.3 |
71.0 |
0.910 |
1 |
miR-96 |
Upregulated |
60 |
180 |
83.3 |
80.8 |
0.902 |
1 |
miR-224 |
Upregulated |
347 |
545 |
87.6 |
82.5 |
0.900 |
4 |
miR-7 |
Downregulated |
30 |
60 |
76.7 |
85.0 |
0.898 |
1 |
miR-145 |
Upregulated & Downregulated |
332 |
483 |
96.3 |
75.8 |
0.890 |
2 |
miR-331-3p |
Upregulated |
103 |
95 |
79.6 |
89.5 |
0.890 |
1 |
miR-21 |
Upregulated & Downregulated |
943 |
1176 |
84.5 |
80.6 |
0.890 |
13 |
miR-125b |
Downregulated |
443 |
602 |
84.3 |
80.8 |
0.890 |
4 |
miR-214-5p |
Downregulated |
224 |
334 |
81.8 |
83.3 |
0.890 |
1 |
miR-16-2 |
Upregulated & Downregulated |
233 |
158 |
84.6 |
79.9 |
0.890 |
3 |
miR-3126-5p |
Downregulated |
115 |
40 |
87.0 |
78.4 |
0.881 |
1 |
miR-301 |
Upregulated |
42 |
38 |
88.1 |
70.3 |
0.880 |
1 |
miR-19a |
Downregulated |
112 |
167 |
81.5 |
82.1 |
0.870 |
1 |
miR-150 |
Downregulated |
120 |
230 |
80.8 |
80.0 |
0.870 |
1 |
miR-143 |
Upregulated & Downregulated |
401 |
428 |
76.4 |
81.3 |
0.860 |
4 |
miR-29b |
Downregulated |
87 |
96 |
75.9 |
89.5 |
0.855 |
1 |
miR-4651 |
Upregulated |
279 |
662 |
78.1 |
92.1 |
0.850 |
1 |
miR-106b |
Upregulated & Downregulated |
206 |
595 |
76.7 |
80.0 |
0.850 |
5 |
miR-574-3p |
Upregulated |
90 |
90 |
78.9 |
77.8 |
0.850 |
1 |
miR-26b |
Downregulated |
50 |
50 |
86.0 |
90.0 |
0.843 |
1 |
miR-1269 |
Upregulated |
224 |
334 |
90.7 |
69.7 |
0.840 |
1 |
miR-939 |
Upregulated |
87 |
31 |
85.8 |
73.7 |
0.840 |
1 |
miR-122 (miR-122a) |
Upregulated & Downregulated |
683 |
682 |
77.1 |
77.4 |
0.840 |
8 |
miR-10b |
Upregulated |
27 |
81 |
77.8 |
76.5 |
0.840 |
1 |
miR-101 |
Upregulated & Downregulated |
156 |
333 |
76.7 |
75.7 |
0.820 |
3 |
miR-519d |
Upregulated |
87 |
31 |
72.4 |
78.4 |
0.820 |
1 |
miR-215 |
Upregulated |
95 |
127 |
80.0 |
91.0 |
0.816 |
1 |
miR-27b-3p |
Upregulated |
91 |
91 |
63.0 |
89.0 |
0.812 |
1 |
miR-27a |
Downregulated |
90 |
60 |
86.7 |
65.0 |
0.811 |
1 |
miR-138b |
Downregulated |
224 |
334 |
88.3 |
69.1 |
0.810 |
1 |
miR-18a |
Upregulated |
101 |
90 |
81.8 |
73.1 |
0.810 |
1 |
miR-192 |
Upregulated & Downregulated |
492 |
722 |
77.6 |
74.6 |
0.810 |
5 |
miR-203 |
Upregulated & Downregulated |
107 |
158 |
72.5 |
76.5 |
0.810 |
2 |
miR-221 |
Upregulated & Downregulated |
192 |
328 |
77.6 |
70.8 |
0.810 |
4 |
miR-4281 |
Upregulated |
45 |
45 |
84.4 |
73.3 |
0.805 |
1 |
miR-15b |
Upregulated |
133 |
176 |
85.2 |
58.3 |
0.800 |
3 |
miR-4429 |
Upregulated |
69 |
87 |
75.0 |
70.0 |
0.798 |
1 |
miR-764 |
Upregulated |
37 |
60 |
74.5 |
77.0 |
0.791 |
1 |
miR-29a |
Upregulated & Downregulated |
138 |
209 |
77.3 |
82.3 |
0.790 |
2 |
miR-183 |
Upregulated |
95 |
111 |
68.5 |
75.3 |
0.790 |
2 |
miR-185-5p |
Upregulated |
67 |
82 |
91.0 |
39.0 |
0.788 |
1 |
miR-6086 |
Upregulated |
45 |
45 |
71.1 |
71.1 |
0.782 |
1 |
miR-195 |
Downregulated |
112 |
167 |
83.4 |
65.9 |
0.780 |
1 |
miR-494 |
Upregulated |
224 |
334 |
76.8 |
65.9 |
0.780 |
1 |
miR-296 |
Downregulated |
112 |
167 |
76.8 |
64.6 |
0.780 |
1 |
miR-451a |
Downregulated |
66 |
40 |
95.0 |
81.8 |
0.770 |
1 |
miR-20a-5p |
Upregulated |
67 |
82 |
86.6 |
57.3 |
0.770 |
1 |
miR-92a-3p |
Upregulated |
182 |
122 |
69.0 |
73.6 |
0.770 |
2 |
miR-205 |
Downregulated |
98 |
175 |
89.9 |
66.9 |
0.760 |
2 |
miR-483-5p |
Upregulated |
161 |
190 |
74.8 |
79.1 |
0.760 |
2 |
miR-199 (miR-199a) |
Downregulated |
266 |
455 |
67.6 |
80.8 |
0.760 |
4 |
miR-181a |
Downregulated |
27 |
81 |
74.2 |
67.7 |
0.760 |
1 |
miR-26a |
Upregulated & Downregulated |
277 |
367 |
68.6 |
72.8 |
0.760 |
3 |
miR-141 |
Upregulated & Downregulated |
157 |
259 |
60.3 |
78.8 |
0.760 |
2 |
miR-335 |
Downregulated |
50 |
40 |
78.0 |
70.0 |
0.750 |
1 |
miR-505 |
Upregulated |
108 |
149 |
90.7 |
56.4 |
0.736 |
1 |
miR-218 |
Downregulated |
156 |
162 |
66.7 |
69.1 |
0.734 |
1 |
miR-133a |
Upregulated |
108 |
149 |
64.8 |
81.9 |
0.733 |
1 |
miR-375 |
Downregulated |
302 |
490 |
90.4 |
68.7 |
0.730 |
2 |
miR-107 |
Upregulated |
115 |
40 |
75.4 |
62.5 |
0.730 |
1 |
miR-202 |
Downregulated |
70 |
30 |
91.6 |
65.0 |
0.723 |
1 |
miR-132-3p |
Upregulated |
67 |
82 |
91.0 |
36.6 |
0.722 |
1 |
miR-25-3p |
Upregulated |
67 |
82 |
55.3 |
79.3 |
0.718 |
1 |
miR-148b |
Downregulated |
76 |
117 |
48.0 |
80.3 |
0.710 |
1 |
miR-29c |
Upregulated |
108 |
149 |
77.8 |
63.1 |
0.704 |
1 |
miR-129 |
Downregulated |
23 |
55 |
81.8 |
69.7 |
0.700 |
1 |
miR-30a-5p |
Upregulated |
67 |
82 |
64.2 |
68.3 |
0.681 |
1 |
miR-155 |
Downregulated |
23 |
55 |
86.2 |
62.3 |
0.680 |
1 |
miR-148a |
Downregulated |
76 |
117 |
55.5 |
85.6 |
0.680 |
1 |
miR-320a |
Upregulated |
67 |
82 |
38.8 |
87.8 |
0.678 |
1 |
miR-200a |
Downregulated |
22 |
37 |
56.9 |
92.6 |
0.670 |
1 |
miR-206 |
Upregulated |
135 |
222 |
85.2 |
52.3 |
0.665 |
1 |
miR-500a |
Upregulated |
112 |
141 |
47.2 |
81.9 |
0.660 |
1 |
miR-324-3p |
Upregulated |
67 |
82 |
74.6 |
50.0 |
0.656 |
1 |
miR-24-3p |
Upregulated |
72 |
31 |
57.9 |
79.5 |
0.636 |
1 |
miR-let-7b |
Upregulated |
120 |
30 |
82.5 |
46.7 |
0.633 |
1 |
miR-433-5p |
Upregulated |
135 |
222 |
83.0 |
39.2 |
0.607 |
1 |
miR-126 |
Upregulated & Downregulated |
82 |
103 |
83.7 |
51.8 |
0.600 |
2 |
miR-142-3p |
Upregulated |
59 |
48 |
32.0 |
91.0 |
0.553 |
1 |
miR-222 |
Upregulated |
60 |
40 |
55.0 |
50.0 |
0.541 |
1 |
miR-1228-5p |
Upregulated |
135 |
222 |
66.7 |
43.7 |
0.534 |
1 |
The upregulated or downregulated expression trend in the HCC patients versus the control group. The data on the sensitivity, specificity and AUC were obtained via the meta-analysis when the number of included articles was more than one.
Abbreviations: HCC, hepatocellular carcinoma; AUC, area under the curve.
Publication bias
A Deeks’ funnel plot was used to evaluate publication bias (Figure 1), and the P values of Deeks’ tests was 0.08, which indicated no significant publication bias was observed in this analysis.
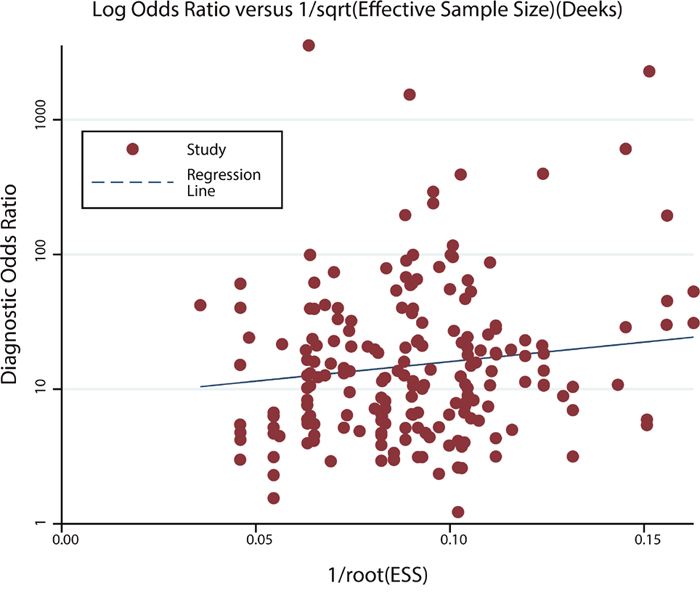
Figure 1: Deeks’ funnel plot for the assessment of publication bias.
Study population
The clinical and pathological characteristics of the study participants are presented in Table 2. The age and gender ratio were significantly different between HCC patients and HCs, thus, a covariance analyses were conducted. The results suggested that age and gender ratio was unrelated to the expression of the microRNAs, scores of the components and concentration of AFP.
Table 2: Clinical characteristics of the study population
Variable |
Patients (n=66) |
Control subjects (n=82) |
|---|---|---|
Age (year) |
57.9 ± 9.9 |
34.7 ± 7.3 |
Gender |
||
Male |
53 |
49 |
Female |
13 |
33 |
ALT (U/L) |
34.0 ± 29.6 |
20.5 ± 13.2 |
<45 |
56 |
78 |
≥45 |
10 |
4 |
Tumor size (cm) |
5.21 ± 3.81 |
|
<5 |
39 |
|
≥5 |
27 |
|
TNM stage |
||
I |
25 |
|
II |
16 |
|
III |
19 |
|
IV |
6 |
|
Histological grade |
||
II |
22 |
|
III |
10 |
|
II~III |
15 |
|
Unknown |
19 |
|
Etiology |
||
HBV |
52 |
|
HCV |
2 |
|
Fatty |
4 |
|
Unknown |
8 |
|
Liver cirrhosis |
||
Yes |
52 |
|
No |
14 |
Abbreviation: ALT, alanine aminotransferase; TNM, tumor-node-metastasis; HBV, hepatitis B virus; HCV, hepatitis C virus.
Expression of microRNAs
MiR-21, miR-106b, miR-125b, miR-130b, miR-182, miR-224 and miR-338 were selected through the systematic review. The results of the quantitative reverse-transcription polymerase chain reaction (qRT-PCR) indicated that the serum levels of miR-21, miR-106b and miR-125b in the HCC patients were significantly higher than those in HCs, while those of miR-182 and miR-224 were significantly lower. As for miR-130b and miR-338, no significant difference was observed between HCC patients and HCs (Supplementary Table 3 and Figure 2). The expression of all of the seven microRNAs had no significant differences among four TNM stages (Kruskal-Wallis test, P > 0.05).
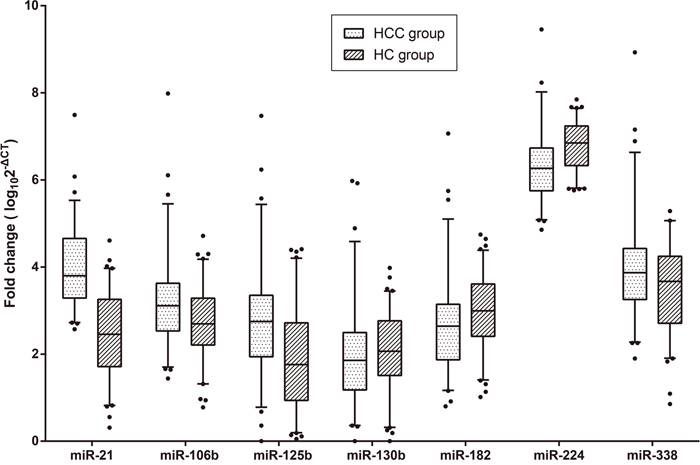
Figure 2: Box plots for the expression of the seven microRNAs. The P values of miR-21, miR-106b, miR-125b, miR-130b, miR-182, miR-224 and miR-338 were < 0.001, 0.008, < 0.001, 0.224, 0.028, <0.001 and 0.070, respectively. The lines within the boxes represent the median values, and the edges of the boxes demonstrate the interquartile ranges. The lines outside the boxes demonstrate the 95% ranges. The points outside the boxes represent the values beyond the 95% ranges.
Abbreviations: HCC, hepatocellular carcinoma; HC, healthy control.
Diagnostic models established using microRNAs
Table 3 presents the cut-off value, sensitivity, specificity, Youden index and AUC of each microRNA and their combinations. The combination of miR-21, miR-106b and miR-224 had the highest AUC value at 0.950, with a sensitivity of 80.3% and a specificity of 92.7%. The cut-off value of the model was -8.99, according to the formula miR-21 × 2.271 + miR-106b × 1.647 + miR-224 × (-3.306).
Table 3: Diagnostic value of five single microRNAs and their combinations
MicroRNA(s) |
Sensitivity (%) |
Specificity (%) |
AUC (95% CI) |
Cut-off value |
Youden index |
|---|---|---|---|---|---|
miR-21 |
98.5 |
59.8 |
0.872 (0.818, 0.925) |
2.700 |
0.582 |
miR-106b |
56.1 |
69.5 |
0.628 (0.538, 0.718) |
3.008 |
0.256 |
miR-125b |
77.3 |
58.5 |
0.693 (0.608, 0.779) |
1.910 |
0.358 |
miR-182 |
56.1 |
65.2 |
0.605 (0.513, 0.697) |
2.870 |
0.212 |
miR-224 |
43.9 |
90.9 |
0.715 (0.631, 0.799) |
6.995 |
0.348 |
miR-21+miR-106b |
98.5 |
61.0 |
0.872 (0.818, 0.926) |
4.985 |
0.595 |
miR-21+miR-125b |
90.9 |
64.6 |
0.873 (0.819, 0.926) |
5.384 |
0.555 |
miR-21+miR-182 |
72.7 |
90.2 |
0.905 (0.860, 0.950) |
4.917 |
0.630 |
miR-21+miR-224 |
75.8 |
95.1 |
0.924 (0.883, 0.964) |
-4.642 |
0.709 |
miR-106b+miR-125b |
72.7 |
59.8 |
0.684 (0.598, 0.770) |
1.370 |
0.325 |
miR-106b+miR-182 |
72.7 |
70.7 |
0.751 (0.674, 0.829) |
0.809 |
0.435 |
miR-106b+miR-224 |
68.2 |
91.5 |
0.872 (0.817, 0.927) |
-11.789 |
0.596 |
miR-125b+miR-182 |
86.4 |
65.9 |
0.777 (0.701, 0.853) |
-0.546 |
0.522 |
miR-125b+miR-224 |
71.2 |
85.4 |
0.846 (0.785, 0.908) |
-9.422 |
0.566 |
miR-182+miR-224 |
80.3 |
58.5 |
0.741 (0.660, 0.821) |
-9.163 |
0.388 |
miR-21+miR-106b+miR-125b |
95.5 |
59.8 |
0.873 (0.819, 0.926) |
4.859 |
0.552 |
miR-21+miR-106b+miR-182 |
95.5 |
74.4 |
0.914 (0.872, 0.956) |
4.858 |
0.698 |
miR-21+miR-106b+miR-224 |
80.3 |
92.7 |
0.950 (0.920, 0.980) |
-8.986 |
0.730 |
miR-21+miR-125b+miR-182 |
90.9 |
75.6 |
0.913 (0.870, 0.955) |
3.811 |
0.665 |
miR-21+miR-125b+miR-224 |
81.8 |
92.7 |
0.938 (0.902, 0.974) |
-8.325 |
0.745 |
miR-21+miR-182+miR-224 |
75.8 |
95.1 |
0.924 (0.883, 0.964) |
-5.105 |
0.709 |
miR-106b+miR-125b+miR-182 |
90.9 |
58.5 |
0.789 (0.716, 0.862) |
0.168 |
0.494 |
miR-106b+miR-125b+miR-224 |
89.4 |
78.0 |
0.897 (0.848, 0.946) |
-14.671 |
0.674 |
miR-106b+miR-182+miR-224 |
74.2 |
85.4 |
0.873 (0.818, 0.928) |
-13.746 |
0.596 |
miR-125b+miR-182+miR-224 |
74.2 |
81.7 |
0.854 (0.794, 0.915) |
-12.424 |
0.559 |
miR-21+miR-106b+miR-125b+miR-182 |
95.5 |
74.4 |
0.915 (0.873, 0.957) |
4.703 |
0.698 |
miR-21+miR-106b+miR-125b+miR-224 |
80.3 |
96.3 |
0.953 (0.923, 0.982) |
-10.320 |
0.766 |
miR-21+miR-106b+miR-182+miR-224 |
80.3 |
92.7 |
0.950 (0.920, 0.980) |
-8.553 |
0.730 |
miR-21+miR-125b+miR-182+miR-224 |
81.8 |
92.7 |
0.936 (0.900, 0.973) |
-10.653 |
0.745 |
miR-106b+miR-125b+miR-182+miR-224 |
81.8 |
80.5 |
0.896 (0.846, 0.946) |
-16.120 |
0.623 |
miR-21+miR-106b+miR-125b+miR-182+miR-224 |
78.8 |
96.3 |
0.952 (0.923, 0.981) |
-10.813 |
0.751 |
The bold font indicates that the P value of each microRNA in the combination was less than 0.05 in the logistic regression.
Abbreviation: AUC, area under the curve; CI, confidence interval.
Discrepant metabolites and total ion chromatogram
A total of 1118 features were extracted in this experiment. Seventeen significantly different metabolites are presented in Supplementary Table 4. The retention time (RT) in the total ion chromatograms was stable with no drift in all of the peaks, which indicated that the results were reliable.
Diagnostic models established using metabolomics
First, we performed the multivariate statistical analyses in all 1118 metabolites. In the principal component analysis (PCA) model, we extracted ten principal components, seven of whose eigenvalue were more than 1.0. We calculated the diagnostic parameters when fitting into one to ten principal components (Table 4). As shown, the AUC was higher as the number of the principal components fitted into the model were increased. We extracted one component in partial least squares-discriminate analysis (PLS-DA) and orthogonal partial least squares-discriminant analysis (OPLS-DA) model, respectively, and the AUC reached 0.89 and 1.0.
When the seventeen significantly different metabolites were used to diagnose HCC, the AUC reached 1.0. Further multivariate statistical analyses also displayed promising results. In the PCA model, we extracted five principal components, three of whose eigenvalue was more than 1.0. The AUC reached 1.0 when more than four principal components were included. Only one component was extracted in both of PLS-DA and OPLS-DA model, and the AUC both reached 0.996.
More diagnostic information regarding the multivariate statistical analyses is shown in Table 4 and Figure 3.
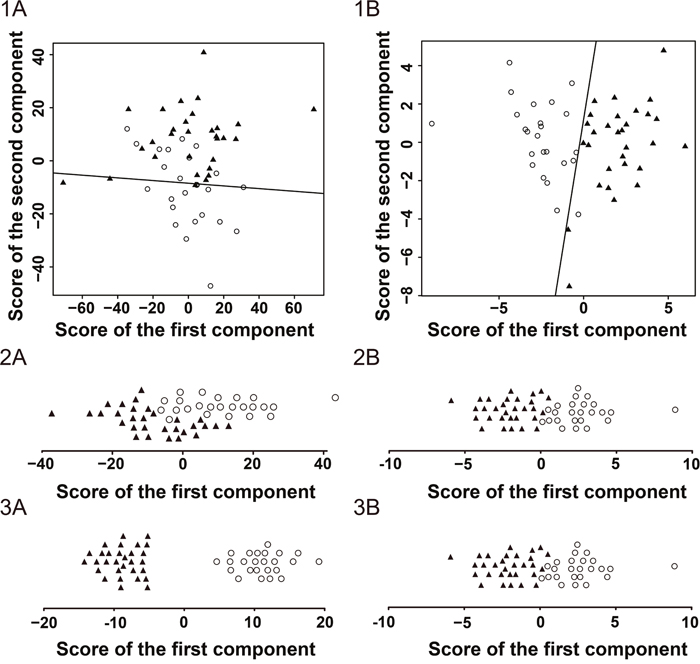
Figure 3: Score plots of the GC/MS analysis in the hepatocellular carcinoma patients and healthy controls. ○ represents the hepatocellular carcinoma group. ▲ represents the healthy control group. The scatter plots of the principal component analysis (PCA) with two principal components for all metabolites (1A) and significantly different metabolites (1B). The line within the plot represents the optimal cut-off line. The strip charts of the partial least squares-discriminate analysis (PLS-DA) with the only component for all metabolites (2A) and significantly different metabolites (2B). The strip charts of the orthogonal partial least squares-discriminant analysis (OPLS-DA) with the only component for all metabolites (3A) and significantly different metabolites (3B).
Table 4: Diagnostic value of the gas chromatography/mass spectrometry analysis with multivariate statistical analysis methods
Source of components |
Statistical method |
Number of components |
Sensitivity (%) |
Specificity (%) |
AUC (95% CI) |
Youden index |
Cumulative variance |
|---|---|---|---|---|---|---|---|
All metabolites |
PCA |
10 |
100.0 |
100.0 |
1.000 (1.000, 1.000) |
1.000 |
0.783 |
9 |
100.0 |
100.0 |
1.000 (1.000, 1.000) |
1.000 |
0.777 |
||
8 |
75.0 |
96.7 |
0.924 (0.857, 0.990) |
0.717 |
0.767 |
||
7 |
75.0 |
96.7 |
0.921 (0.852, 0.990) |
0.717 |
0.745 |
||
6 |
58.3 |
100.0 |
0.876 (0.788, 0.965) |
0.583 |
0.725 |
||
5 |
62.5 |
100.0 |
0.883 (0.797, 0.970) |
0.625 |
0.694 |
||
4 |
95.8 |
60.0 |
0.857 (0.761, 0.953) |
0.558 |
0.635 |
||
3 |
95.8 |
60.0 |
0.854 (0.757, 0.951) |
0.558 |
0.589 |
||
2 |
95.8 |
60.0 |
0.854 (0.757, 0.951) |
0.558 |
0.543 |
||
1 |
70.8 |
50.0 |
0.564 (0.409, 0.719) |
0.208 |
0.329 |
||
PLS-DA |
1 |
83.3 |
76.7 |
0.894 (0.815, 0.974) |
0.600 |
0.341 |
|
OPLS-DA |
1 |
100.0 |
100.0 |
1.000 (1.000, 1.000) |
1.000 |
0.704 |
|
Significantly different metabolites |
PCA |
5 |
100.0 |
100.0 |
1.000 (1.000, 1.000) |
1.000 |
0.744 |
4 |
100.0 |
100.0 |
1.000 (1.000, 1.000) |
1.000 |
0.734 |
||
3 |
95.8 |
96.7 |
0.994 (0.983, 1.000) |
0.925 |
0.713 |
||
2 |
95.8 |
100.0 |
0.994 (0.982, 1.000) |
0.958 |
0.673 |
||
1 |
100.0 |
93.3 |
0.989 (0.970, 1.000) |
0.933 |
0.413 |
||
PLS-DA |
1 |
100.0 |
93.3 |
0.996 (0.986, 1.000) |
0.933 |
0.628 |
|
OPLS-DA |
1 |
100.0 |
93.3 |
0.996 (0.986, 1.000) |
0.933 |
0.628 |
Abbreviations: AUC, area under the curve; CI, confidence interval; PCA, principal component analysis; PLS-DA, partial least squares-discriminate analysis; OPLS-DA, orthogonal partial least squares-discriminant analysis.
Diagnostic value of traditional tumor biomarkers
The AFP concentration was significantly different between HCC patients and HCs (Mann-Whitney U-test, P < 0.001). The median concentrations in the patients and HCs were 42.2 (range, 1.2 - > 60500) and 3.6 (range, 0.9 – 10.3) μg/L, respectively. The AUC of AFP was 0.755 (95% CI, 0.666 - 0.843; sensitivity = 59.1%, specificity = 100.0%) when the cut-off value was 12.3 μg/L. When the cut-off value was 20 μg/L, which is the upper bound of 95% of healthy individuals, the sensitivity was 54.5%, and the specificity was still 100.0%.
The ROC curves of AFP, metabolomics and the combination of microRNAs are displayed in Figure 4.
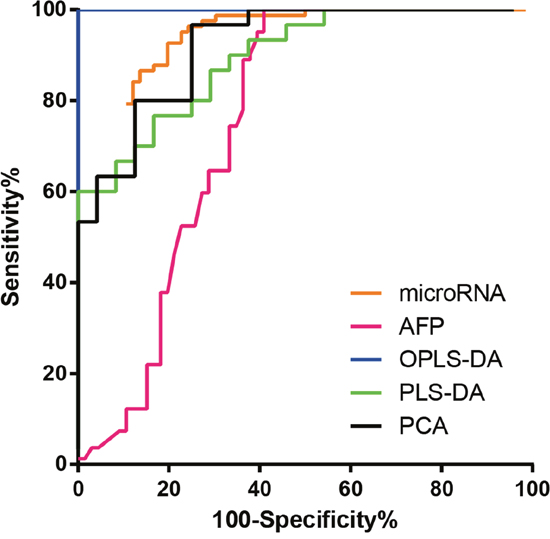
Figure 4: Receiver operating characteristic (ROC) curve. ROC curve of the combination of miR-21, miR-106b and miR-224, GC/MS analysis with three statistical methods for all metabolites and AFP for discriminating hepatocellular carcinoma patients from control subjects. The curve of PCA model was performed when including two principal components.
Abbreviations: PCA, principal component analysis; PLS-DA, partial least squares-discriminate analysis; OPLS-DA, orthogonal partial least squares-discriminant analysis; AFP, alpha feto-protein.
DISCUSSION
Early diagnosis and treatment of HCC can improve patient survival is a well-established consensus. Thus, looking for new biomarkers is in the ascendant. Novel diagnostic biomarkers almost belong to gene mutations, single nucleotide polymorphisms (SNP), epigenetics, mRNAs, non-coding RNAs and proteins including GPC3, GP73, DKK1 [18, 19]. Screening via proteomics or metabolomics is also a feasible way to discover new biomarkers. After investigating the diagnostic efficiencies and limitations of biomarkers, we selected serum microRNAs and GC/MS to validate their diagnostic value and establish appropriate models.
Among the thousands of microRNAs that have been discovered, many have been testified for their diagnostic value in HCC [10]. A general research routine is through screening microRNA microarray in a small sample size, then validating the results via qRT-PCR in a larger sample size. We reviewed the diagnostic value of each microRNA. Meta-analyses made the statistical power increase through the expansion of the included articles and sample sizes.
Based on the result of systematic review, we selected seven microRNAs with high AUC values or Youden indexes that were included in various articles. MiR-21, miR-106b, miR-125b, miR-182 and miR-224 had significantly different expression in HCC patients versus HCs. AUC higher than 0.7, miR-21 and miR-224 had potential to become independent diagnostic biomarkers of HCC. The combination of microRNAs further raised the diagnostic value and the combination of miR-21, miR-106 and miR-224 allowed the AUC to exceed 0.950. With miR-21, miR-106b, miR-125b, miR-182 and miR-224 combined, the AUC was 0.952. However, there was no significant difference between the above two combinations.
As circulating diagnostic biomarkers, microRNAs have advantages and disadvantages. Different from mRNAs, microRNAs are stable at room temperature and remains so after repeated freeze-thawing [20]. In addition, compared with liver puncture, blood examination is non-invasive. Nevertheless, the choice of internal/external reference RNA, the dosage of reagents and the operating process lacks standardization, therefore the cut-off value cannot be unified, and even the variation trend of the expression for some microRNAs are distinct. On the other hand, the etiology, such as hepatitis B virus or hepatitis C virus, may affect the expression of microRNAs.
As expected, the diagnostic efficiency of metabolomics is satisfactory, whether all detected metabolites or significantly different metabolites were included. As shown in Table 4 , when a PCA, PLS-DA or OPLS-DA model includes the same number of components, the OPLS-DA model had the highest AUC, and the PCA model ranks last. This conclusion can be explained from a mathematics perspective. PCA is non-supervisory, while PLS-DA and OPLS-DA are supervisory analysis methods. Based on PLS, OPLS further separates the orthogonal variables by an orthogonal signal correction and expands the differences between the two data matrices [21, 22]. Although the diagnostic value of the PCA model was not superior to that of the PLD-DA and OPLS-DA model when including the same number of components, the PCA can extract more principal components to increase the AUC.
The advantage of serum GC/MS analysis are high diagnostic value and non-invasive examination process. The statistical models, which are established by PCA, PLA-DA and OPLS-DA, are stable when the variables are numerous and the observations are little. Nevertheless, same as detecting the expression of microRNAs, the pretreatment process is not standardized, including the choice of the derivatization reagents and internal standard, the time of each step and the operating order.
In terms of the price, new biomarker detections are more expensive than traditional AFP, which costs only 5.2 dollars in China. Each sample detection for three microRNAs and the metabolic spectra costs approximately 20 and 72.5 dollars, respectively. Moreover, an abdominal enhancement CT and enhancement MRI are priced around 100 and 135 dollars, respectively. A liver puncture costs 44 dollars, excluding test-related room and nursing care charges.
In conclusion, the diagnostic value of the new models are higher than that of the traditional biomarker, AFP, without doubt. We suggest GC/MS analysis and a combination of microRNAs applied to the diagnosis of HCC, especially after the position diagnosis is made via imaging examination.
MATERIALS AND METHODS
Study design
First, an electronic search of PubMed, Embase and the CBM databases was performed to identify relevant articles published up to July 6, 2017. The search strategy was (miRNA OR microRNA OR miR) AND (“liver neoplasms”[Mesh] OR “hepatocellular carcinoma” OR “liver cancer”) AND (blood OR serum OR plasma OR circulating) AND (diagnosis OR diagnostic OR diagnose). In addition, we examined the reference lists in identified articles to included additional relevant studies. No language restrictions were imposed.
Secondly, we chose microRNAs with high AUC values and is included in numerous studies to establish a diagnostic model. The serum specimens from 66 HCC patients and 82 HCs were collected to detect the expression of microRNAs through qRT-PCR.
Next, we randomly selected 24 patients and 30 HCs from the cohort mentioned above and profiled their metabolomic signatures via GC/MS analysis.
Finally, we detected the serum concentration of the traditional tumor biomarker, AFP. The diagnostic efficiency was calculated and compared to the new models. The flow-process diagram for the study is shown in Figure 5.
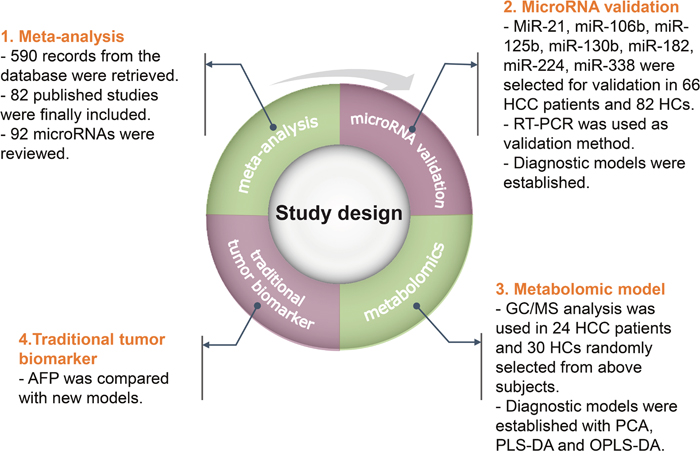
Figure 5: Study design.
Abbreviations: HCC, hepatocellular carcinoma; HC, healthy control; RT-PCR, reverse-transcription polymerase chain reaction; GC/MS, gas chromatography/mass spectrometry; PCA, principal component analysis; PLS-DA, partial least squares-discriminate analysis; OPLS-DA, orthogonal partial least squares-discriminant analysis; AFP, alpha feto-protein.
Inclusion and exclusion criteria of the literature
The inclusion criteria for the systematic review were as follows: (1) studies regarding microRNAs comparing HCC patients with HCs; (2) studies that employed blood specimens, including serum and plasma; and (3) qRT- PCR techniques. The exclusion criteria included: (1) failure to provide sufficient diagnostic information; (2) duplicate data from identical authorities; and (3) cell or animal studies, reviews and letters.
Data extraction
Two reviewers were independently responsible for study selection and data extraction. Data were retrieved from all included studies: (1) basic characteristics of the studies, including the first author, year of publication, country, ethnicity, sample size, mean age, gender, type of specimens, target microRNAs, and reference control; and (2) diagnostic parameters of the microRNAs, including expression variation, sensitivity, specificity, and AUC.
Patients and specimens
In this study, we included patients and HCs from Zhongshan Hospital, Fudan University between May 2015 and July 2015. The HCC patients were all definitively diagnosed in accordance with the AASLD Practice Guidelines. The patients were excluded if they had history of other malignant tumors or had received surgical operation, interventional therapy, radiotherapy or chemotherapy. Healthy individuals were identified by clinical manifestations, histories of illness and normal liver function. The serum samples were centrifuged for 10 min at 820 g and 4°C to remove cell debris, and the supernatants were immediately stored at −80°C until analysis. The concentration of serum AFP was measured via an electro-chemiluminescence immunoassay.
The protocol was approved by the Ethics Committee of Zhongshan Hospital of Fudan University, Shanghai. All participants provided a written informed consent.
RNA extraction and reverse transcription
2 μl of 25 fmol cel-miR-39 (Tiangen, Beijing, China) was added to 200 μl of serum samples as external reference. Total RNA was isolated simultaneously using the miRcute microRNA Isolation Kit (Tiangen, Beijing, China) abiding by the manufacturer’s protocol [23]. The optical density of the extracted total RNA was determined at 260 and 280 nm on a NanoDrop spectrophotometer (NanoDrop, Wilmington, DE, USA) to assess for concentrations and purities.
The extracted microRNA was polyadenylated with poly (A) polymerase in a 20-μl volume, and 6 μl of the poly (A) reaction solution was reversely transcribed to cDNA in another 20 μl with miRcute microRNA The First-strand cDNA Synthesis Kit (Tiangen, Beijing, China) according to the manufacturer’s protocol. All procedures were carried out in triplicates to remove outliers.
Quantitative real-time PCR
The qPCR reaction was conducted with the miRcute microRNA qPCR Detection Kit (Tiangen, Beijing, China) on ABI PRISM 7500 Sequence Detection System (Applied Biosystems, Foster City, CA, USA). Each 20-μl qPCR reaction solution contained cDNA, 2× miRcute microRNA premix (with SYBR and ROX), the manufacturer-provided universal reverse primer, and a microRNA-specific forward primer (Tiangen, Beijing, China). The real-time PCR cycling conditions: 94°C for 2 min, 45 cycles at 94°C for 20 s, annealing at 60°C for 34 s, and extension at 72°C for 30 s. At the end of the real-time PCR reaction, a melting curve analysis was accomplished to ensure specific amplification of the expected PCR product.
The relative expression of the microRNAs was calculated from the equation log10 (2−ΔCt) with cel-miR-39. The ΔCT was calculated by subtracting the CT values of the cel-miR-39 from those of the microRNAs of interest [23].
Specimen processing for metabolomics
200 μl of the serum samples were transferred into glass centrifuge tubes for GC/MS analysis. 200 μl of 2-chloro-phenylalanine (0.3 g/L) served as internal standard. 600 μl of methanol was added into each sample. The mixture was vortexed for 30 s, followed by incubation at -20°C for 10 min. The samples were then centrifuged for at 12000 × g and 4°C for 15 min. 800 μl of the supernatant was collected individually from each sample into an ampoule bottle and evaporated to dryness under a stream of nitrogen gas at 50°C for approximately 30 min. 200 μl of a methoxyamine pyridine solution (15 g/L) was subsequently added into the ampoule bottle. The mixture was vortexed for 2 min and incubated at 37°C for 1 hour. Then, 200 μl of bis-(trimethylsilyl)-trifluoroacetamide (BSTFA) plus 1% trimethylchlorosilane (TMCS) was added, and the mixture was again vortexed for 2 min and incubated at 100°C for 30min. The methanol, 2-chloro-phenylalanine, methoxyamine and pyridine were obtained from Aladdin (Shanghai, China). BSTFA with 1% TMCS was purchased from Sigma-Aldrich (St. Louis, MO, USA). Each reaction sample was performed in duplicates.
GC/MS analysis
The GC/MS analysis was performed on an Agilent 6980 GC system equipped with a fused-silica capillary column (internal diameter: 30 m × 0.25 mm) and a 0.25-μm HP-5MS stationary phase (Agilent, Shanghai, China). We used the same operational methods as our previous studies [24].
Statistical analyses
The statistical analyses were carried out using R software 3.3.3 (R Foundation for Statistical Computing, Vienna, Austria), Stata 12.0 (StataCorp LP, College Station, TX, USA) and SIMCA-P 13.0 (Umetrics AB, Umea, Vasterbotten, Sweden). P values < 0.05 were considered statistically significant.
Meta-analyses were used to assess the accuracy of individual microRNAs for HCC diagnosis, based on its sensitivity, specificity and AUC of the summary receiver operator characteristic (SROC). Deeks’ funnel plot was selected to evaluated publication bias.
A power analysis was used to calculate the number of cases and HCs in the microRNA validation phase. A Mann-Whitney U-test was used to compare the expression of microRNAs and concentration of AFP in HCC patients and HCs. A Kruskal-Wallis test was used to calculate the relationship between the expression of microRNAs and TNM stage. The diagnostic efficiencies of the microRNAs were determined by assessing the sensitivity, specificity and the AUC. A stepwise logistic regression was used to include microRNAs into the diagnostic model.
The metabolomic data were normalized with “XCMS” package in R software and then stored in a two-dimensional matrix, including the RT, mass-to-charge ratio (MZ) and peak intensity. The metabolites were identified based on the National Institute of Standards and Technology (NIST) mass spectra library through RT and MZ [24]. Significantly different metabolites were screened via the variable importance in the projection (VIP) value of the OPLS-DA model (> 1) and the P value of t-test (≤ 0.001). Multivariate statistical analyses, including the PCA, PLS-DA and OPLS-DA, were carried out via SIMCA-P in all metabolites and significantly different metabolites, respectively. A logistic regression was used to investigate the better diagnostic models by combinations of the components when more than one component was extracted.
Abbreviations
AASLD: American Association for the Study of Liver Diseases; AFP: alpha feto-protein; AUC: area under the curve; BSTFA: bis-(trimethylsilyl)-trifluoroacetamide; CBM: Chinese Biomedical Literature Database; CT: cycle threshold or computed tomography; DKK1: dickkopf-related protein 1; GC/MS: gas chromatography/mass spectrometry; GP73: Golgi glycoprotein 73; GPC3: glypican 3; HC: healthy control; HCC: hepatocellular carcinoma; LC/MS: liquid chromatography/mass spectrometry; MRI: magnetic resonance imaging; MZ: mass-to-charge ratio; NIST: National Institute of Standards and Technology; NMR: nuclear magnetic resonance; OPLS-DA: orthogonal partial least squares-discriminant analysis; PCA: principal component analysis; PLS-DA: partial least squares-discriminate analysis; qRT-PCR: quantitative reverse-transcription polymerase chain reaction; ROC: receiver operating curve; RT: retention time; SNP: single nucleotide polymorphisms; SROC: summary receiver operator characteristic; TMCS: trimethylchlorosilane; VIP: variable importance in the projection.
Author contributions
HNL, TTL and XZS conceived and designed the experiments. YJT drafted the manuscript. HNL, YJC and EB extracted the data of systematic review and meta-analysis. HNL, HW and YJC performed the experiments of microRNA and metabolomics. LHN and HW performed the statistical analyses. LD and XZS revised the article. All authors finished reading and approving the final manuscript of this study.
ACKNOWLEDGMENTS
The authors would like to thank the members of Prof. Xi-Zhong Shen’s laboratory for helpful discussions and critical reading of the manuscript.
CONFLICTS OF INTEREST
The authors have stated that they have no conflicts of interest.
FUNDING
This study was supported by the National Nature Science Foundation of China (No. 81000968; No. 81101540; No. 81101637; No. 81172273; No. 81272388; No. 81301820; No. 81472673), Doctoral Fund of Ministry of Education of China (20120071110058), and The National Clinical Key Special Subject of China.
REFERENCES
1. Torre LA, Bray F, Siegel RL, Ferlay J, Lortet-Tieulent J, Jemal A. Global cancer statistics, 2012. CA Cancer J Clin. 2015; 65:87-108. https://doi.org/10.3322/caac.21262.
2. Tateishi R, Yoshida H, Matsuyama Y, Mine N, Kondo Y, Omata M. Diagnostic accuracy of tumor markers for hepatocellular carcinoma: a systematic review. Hepatol Int. 2008; 2:17-30. https://doi.org/10.1007/s12072-007-9038-x.
3. Hartke J, Johnson M, Ghabril M. The diagnosis and treatment of hepatocellular carcinoma. Semin Diagn Pathol. 2017; 34:153-9. https://doi.org/10.1053/j.semdp.2016.12.011.
4. Bartel DP. MicroRNAs: genomics, biogenesis, mechanism, and function. Cell. 2004; 116:281-97.
5. Wang K, Zhang S, Marzolf B, Troisch P, Brightman A, Hu Z, Hood LE, Galas DJ. Circulating microRNAs, potential biomarkers for drug-induced liver injury. Proc Natl Acad Sci U S A. 2009; 106:4402-7. https://doi.org/10.1073/pnas.0813371106.
6. Okajima W, Komatsu S, Ichikawa D, Miyamae M, Kawaguchi T, Hirajima S, Ohashi T, Imamura T, Kiuchi J, Arita T, Konishi H, Shiozaki A, Moriumura R, et al. Circulating microRNA profiles in plasma: identification of miR-224 as a novel diagnostic biomarker in hepatocellular carcinoma independent of hepatic function. Oncotarget. 2016; 7:53820-36. https://doi.org/10.18632/oncotarget.10781.
7. Liao Q, Han P, Huang Y, Wu Z, Chen Q, Li S, Ye J, Wu X. Potential role of circulating microRNA-21 for hepatocellular carcinoma diagnosis: a meta-analysis. PLoS One. 2015; 10:e130677. https://doi.org/10.1371/journal.pone.0130677.
8. Jiang L, Li X, Cheng Q, Zhang BH. Plasma microRNA might as a potential biomarker for hepatocellular carcinoma and chronic liver disease screening. Tumour Biol. 2015; 36:7167-74. https://doi.org/10.1007/s13277-015-3446-7.
9. Wang Y, Gao X, Wei F, Zhang X, Yu J, Zhao H, Sun Q, Yan F, Yan C, Li H, Ren X. Diagnostic and prognostic value of circulating miR-21 for cancer: a systematic review and meta-analysis. Gene. 2014; 533:389-97. https://doi.org/10.1016/j.gene.2013.09.038.
10. Huang JT, Liu SM, Ma H, Yang Y, Zhang X, Sun H, Zhang X, Xu J, Wang J. Systematic review and meta-analysis: circulating miRNAs for diagnosis of hepatocellular carcinoma. J Cell Physiol. 2016; 231:328-35. https://doi.org/10.1002/jcp.25135.
11. Li G, Shen Q, Li C, Li D, Chen J, He M. Identification of circulating MicroRNAs as novel potential biomarkers for hepatocellular carcinoma detection: a systematic review and meta-analysis. Clin Transl Oncol. 2015; 17:684-93. https://doi.org/10.1007/s12094-015-1294-y.
12. Yang Y, Zhu R. Diagnostic value of circulating microRNAs for hepatocellular carcinoma. Mol Biol Rep. 2014; 41:6919-29. https://doi.org/10.1007/s11033-014-3578-7.
13. Hu QY, Jiang H, Su J, Jia YQ. MicroRNAs as biomarkers for hepatocellular carcinoma: a diagnostic meta-analysis. Clin Lab. 2013; 59:1113-20.
14. Dettmer K, Aronov PA, Hammock BD. Mass spectrometry-based metabolomics. Mass Spectrom Rev. 2007; 26:51-78. https://doi.org/10.1002/mas.20108.
15. Fitian AI, Nelson DR, Liu C, Xu Y, Ararat M, Cabrera R. Integrated metabolomic profiling of hepatocellular carcinoma in hepatitis C cirrhosis through GC/MS and UPLC/MS-MS. Liver Int. 2014; 34:1428-44. https://doi.org/10.1111/liv.12541.
16. Jonsson P, Johansson AI, Gullberg J, Trygg J, A J, Grung B, Marklund S, Sjostrom M, Antti H, Moritz T. High-throughput data analysis for detecting and identifying differences between samples in GC/MS-based metabolomic analyses. Anal Chem. 2005; 77:5635-42. https://doi.org/10.1021/ac050601e.
17. Fitian AI, Cabrera R. Disease monitoring of hepatocellular carcinoma through metabolomics. World J Hepatol. 2017; 9:1-17. https://doi.org/10.4254/wjh.v9.i1.1.
18. Shen QJ, Ge TX, Tan WX. Advance in research of diagnostic biological markers of hepatocellular carcinoma. Natl Med J China. 2013; 93:789-93. https://doi.org/10.3760/cma.j.issn.0376-2491.2013.10.019.
19. Elemeery MN, Badr AN, Mohamed MA, Ghareeb DA. Validation of a serum microRNA panel as biomarkers for early diagnosis of hepatocellular carcinoma post-hepatitis C infection in Egyptian patients. World J Gastroenterol. 2017; 23:3864-75. https://doi.org/10.3748/wjg.v23.i21.3864.
20. Mitchell PS, Parkin RK, Kroh EM, Fritz BR, Wyman SK, Pogosova-Agadjanyan EL, Peterson A, Noteboom J, O'Briant KC, Allen A, Lin DW, Urban N, Drescher CW, et al. Circulating microRNAs as stable blood-based markers for cancer detection. Proc Natl Acad Sci U S A. 2008; 105:10513-8. https://doi.org/10.1073/pnas.0804549105.
21. Nguyen DV, Rocke DM. Tumor classification by partial least squares using microarray gene expression data. Bioinformatics. 2002; 18:39-50.
22. Trygg J, Wold S. Orthogonal projections to latent structures (O-PLS). J Chemometr. 2002; 16:119-28.
23. Chen YJ, Zhu JM, Wu H, Fan J, Zhou J, Hu J, Yu Q, Liu TT, Yang L, Wu CL, Guo XL, Huang XW, Shen XZ. Circulating microRNAs as a fingerprint for liver cirrhosis. PLoS One. 2013; 8:e66577. https://doi.org/10.1371/journal.pone.0066577.
24. Wu H, Xue R, Dong L, Liu T, Deng C, Zeng H, Shen X. Metabolomic profiling of human urine in hepatocellular carcinoma patients using gas chromatography/mass spectrometry. Anal Chim Acta. 2009; 648:98-104. https://doi.org/10.1016/j.aca.2009.06.033.