
INTRODUCTION
Tamoxifen is an antiestrogenic drug widely used in the treatment of estrogen receptor (ER)-and/or progesterone receptor (PR)-positive breast cancers [1]. Five year treatment with adjuvant tamoxifen leads to around a 30%-50% reduction in the recurrence rate throughout the first 10 years and a 30% reduction in mortality rates throughout the first 15 years in early ER-positive breast cancer [2, 3]. A recent large study reported that 10 year tamoxifen treatment reduced the recurrence rate and mortality by 15%-30% more than stopping tamoxifen after 5 years [4]. The benefit of continuing tamoxifen treatment longer than 10 years following surgery is not clear; thus, adjuvant tamoxifen treatment is recommended for up to 10 years [5]. Clinical outcomes of treatment with tamoxifen show inter-individual variation, which can be caused by various factors including concomitant medication and genetic polymorphisms of enzymes involved in the metabolic pathway of tamoxifen [2, 6–8].
Tamoxifen and its metabolites are ER antagonists that competitively inhibit estrogen binding to ERs [9]. In addition, some of them are also known to inhibit aromatase [10]. Tamoxifen undergoes a complex metabolic process involving the cytochrome P450 (CYP) system in the liver [11]. N-desmethyltamoxifen (NDM) generated from demethylation of tamoxifen by CYP3A4/5 is a major primary metabolite of tamoxifen (Figure 1) [11]. A relatively smaller proportion of tamoxifen is converted by CYP2D6 to 4-hydroxytamoxifen (4-OH tamoxifen), which is an active metabolite with strong affinity for ERs and 30- to 100-fold higher potency in suppressing estrogen-dependent cell proliferation [2, 11]. Other minor primary metabolites of tamoxifen, including alpha-hydroxytamoxifen, have also been identified [11]. 4-hydroxy-N-desmethyltamoxifen (endoxifen) is biotransformed from NDM and 4-OH tamoxifen by CYP2D6 and CYP3A [11]. Endoxifen has potent antiestrogenic activity (100-fold more potent than tamoxifen) and shows higher plasma concentrations than 4-OH tamoxifen [2, 11–13]. In addition to endoxifen, NDM is also metabolized to secondary metabolites, including N-didesmethyltamoxifen and alpha-hydroxy-NDM, by various CYP enzymes [11]. Tamoxifen and its metabolites are further inactivated by UDP-glucuronosyltransferases (UGTs) and sulfotransferases (SULTs) [14, 15]. In addition to these enzymes, various CYP and flavin-containing monooxygenase (FMO) enzymes are also involved in tamoxifen metabolism [11, 16].
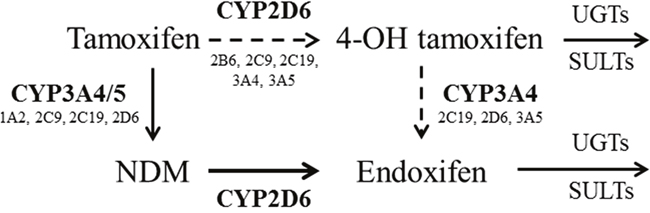
Figure 1: The metabolic pathway of tamoxifen. Tamoxifen is demethylated to N desmethyltamoxifen (NDM) mainly by CYP3A4/5. A relatively smaller proportion of tamoxifen is converted by CYP2D6 to 4-hydroxytamoxifen (4-OH tamoxifen). NDM is metabolized to endoxifen by CYP2D6, and 4-OH tamoxifen is metabolized to endoxifen by CYP3A4 [11]. In addition to these enzymes, various CYP enzymes (e.g., CYP1A2, CYP2C9, etc.) are involved in the metabolism of tamoxifen. Tamoxifen and its metabolites are further inactivated by UDP-glucuronosyltransferases (UGTs) and sulfotransferases (SULTs) [14, 15].
Variant alleles of CYP2D6 genes have been reported to be associated with clinical outcomes, including recurrence rates, mortality rates, and disease-free survival, in breast cancer patients treated with tamoxifen; these include functional alleles related to better clinical outcomes and non-functional or reduced function alleles associated with worse outcomes [17]. In contrast, some studies have reported the absence of clear evidence for associations between genetic polymorphisms of drug-metabolizing enzymes and clinical outcomes [18, 19]. These inconsistencies among pharmacogenetic studies were suggested to be due to various metabolic pathways and various potent metabolites of tamoxifen [20]. In vivo studies on the impact of genotype on tamoxifen pharmacokinetics revealed that CYP2D6 genotypes are associated with different concentrations of tamoxifen metabolites, mainly endoxifen, in a patient-dependent manner [2, 21–26]. In addition to CYP2D6, the influence of various genes, including CYP3A4, CYP2C9, CYP2C19, SULT1A1, SULT1A2, and UGTs, on tamoxifen metabolism has been occasionally reported [27–34]. However, genetic polymorphisms appear to only explain part of the inter-individual variation of tamoxifen metabolism, and most previous studies focused on a few polymorphisms in a small proportion of genes in tamoxifen metabolism [2, 8, 30]. Moreover, there are still insufficient data on genetic diversity with respect to geographic background and ethnicity. In addition to genetic factors, clinical factors including concomitant medicine and compliance also contribute to the variation in tamoxifen metabolism. These factors can cause fluctuation in the tamoxifen metabolic state in each patient during long-term treatment. However, the intra-individual variation in the tamoxifen metabolic state in breast cancer patients has barely been evaluated.
The aims of this study were to determine concentrations of tamoxifen and its metabolites in plasma specimens, including serial specimens collected at 3-month intervals, from Korean breast cancer patients and to investigate the impacts of genetic polymorphisms in multiple genes on tamoxifen pharmacokinetics. The results of this study will improve our understanding of the effects of genetic polymorphisms on tamoxifen metabolism and inter- and intra-individual variations in the concentrations of tamoxifen metabolites.
RESULTS
Patient characteristics
Table 1 summarizes the demographics and clinical characteristics of 281 breast cancer patients treated with tamoxifen. The mean age of the patients was 45.4 years (range, 27.3-73.7 years). At the time of blood draw, mean body mass index (BMI) was 22.9 kg/m2 (16.8-36.4 kg/m2), and the mean duration of tamoxifen treatment before blood collection was 125 days (56-340 days). Most patients had normal liver function; the mean values of AST and ALT were 22 IU/L (5-86 IU/L) and 18 IU/L (5-118 IU/L), respectively. Most patients (74.0%) were in a pre/peri-menopausal state. Three patients reported taking CYP2D6 inhibitors including escitalopram, hydroxyzine, and ranitidine [35]. Except one who was taking hydroxyzine before the third blood collection time, the other two patients discontinued CYP2D6 inhibitors at least 2 weeks prior to the second blood collection time.
Table 1: Clinical characteristics of 281 patients with breast cancer
Characteristics |
Mean (range) or n (%) |
|---|---|
Age (years) |
45.4 (27.3-73.7) |
Body mass index (kg/m2) |
22.9 (16.8-36.4) |
Menopausal status, n (%) |
|
Pre/peri-menopause |
208 (74.0) |
Post-menopause |
73 (26.0) |
Tamoxifen duration at initial blood collection time (days) |
125 (56-340) |
Dose of tamoxifen (mg/day) |
20 |
Neoadjuvant chemotherapy |
|
No |
274 (97.5) |
Yes |
7 (2.5) |
Adjuvant chemotherapy |
|
No |
148 (52.7) |
Yes |
133 (47.3) |
Stage |
|
0 |
61 (21.7) |
1 |
118 (42.0) |
2 |
74 (26.3) |
3 |
28 (10.0) |
Nuclear grade |
|
1 |
78 (27.8) |
2 |
132 (47.0) |
3 |
68 (24.2) |
Unknown |
3 (1.1) |
Number of measurement, n (%) |
|
Once |
102 (36.3) |
Twice |
89 (31.7) |
Thrice |
90 (32.0) |
Concomitant medicine, n (%)a |
|
Goserelin |
43 (7.8) |
Levothyroxin |
11 (2.0) |
Calcium carbonate/cholecalciferol |
7 (1.3) |
Valsaltan |
6 (1.1) |
Amlodipine |
5 (0.9) |
CYP inhibitorb |
3 (0.5) |
Othersc |
25 (4.5) |
Not used |
473 (86.0) |
aDenominator is the total number of blood collection time (550).
bEscitalopram, hydroxyzine, and ranitidine.
cAceclofenac, atorvastatin, alendronate, calcium polycarbophil, cefdinir, cefditoren, gabapentin, gliclazide, herceptin, hydrochlorothiazide, insulin, itopride, lamotrigine, losartan/hydrochlothiazide, magnesium oxide, metformin, pethidine, ramipril, risedronate, rosuvastatin, sitagliptin, tizanidine, tobramycin, tramadol, triazolam, valaciclovir, venlafaxine, voglibose, zaltoprofen, zoledronic acid, and zolpidem.
Plasma concentrations of tamoxifen and its metabolites
A total of 550 measurements of tamoxifen and its metabolites were obtained for 281 patients taking 20 mg daily tamoxifen (Table 2). Among the three tamoxifen metabolites, NDM (230 ng/mL) had the highest mean concentration compared with endoxifen (25.0 ng/mL) and 4-OH tamoxifen (8.53 ng/mL). The concentrations of tamoxifen metabolites and their ratios were widely distributed (Figure 2A). The ratio of endoxifen and 4-OH tamoxifen showed the highest variation, with a coefficient of variation (CV) of 274%. For the active metabolites endoxifen and 4-OH tamoxifen, the fifth percentile of concentration showed an approximate 3-fold difference from the 95th percentile (12.5 vs. 42.7 ng/mL for endoxifen, 2.60 vs. 13.4 ng/mL for 4-OH tamoxifen). In comparisons of concentrations and clinical variables, BMI showed statistical significance with endoxifen and tamoxifen, but the degree of correlation was very weak (r2 = 0.018, P = 0.002 for endoxifen; r2 = 0.011, P = 0.014 for tamoxifen). Concentrations of tamoxifen and its metabolites measured at 3-month intervals were inconsistent; plasma endoxifen concentration changed 0.23- to 4.87-fold (Figure 2B), and 21 cases (7.8%, 21/269) had a greater than 2-fold change; among these cases, the endoxifen concentration was decreased at 3 months in seven cases. One patient who was taking a CYP2D6 inhibitor, hydroxyzine, showed a decrease in endoxifen concentration from 26.8 ng/mL before to 18.5 ng/mL after hydroxyzine administration. Another patient was non-compliant and showed a fluctuation in endoxifen concentration from 29.6 ng/mL at first blood collection, 13.9 ng/mL at the second, to 21.5 ng/mL at the third.
Table 2: The distributions of concentrations of tamoxifen and its metabolites in 550 plasma specimens of 281 patients
Variables |
Concentrations (95% CI) in ng/mL |
|||||||
|---|---|---|---|---|---|---|---|---|
Endoxifen |
NDM |
Tam |
4-OH Tam |
Endoxifen /NDM |
Endoxifen /4-OH Tam |
NDM /Tam |
4-OH Tam /Tam |
|
Mean |
25.0 |
230 |
128 |
8.53 |
0.13 |
4.27 |
1.83 |
0.08 |
SD |
9.47 |
108 |
54.5 |
3.21 |
0.09 |
11.7 |
0.54 |
0.04 |
CV |
38% |
47% |
43% |
38% |
69% |
274% |
30% |
50% |
5th percentile |
12.5 |
80.5 |
50.3 |
2.60 |
0.05 |
1.82 |
1.18 |
0.02 |
25th percentile |
18.5 |
157 |
89.4 |
6.70 |
0.08 |
2.37 |
1.51 |
0.05 |
50th percentile |
23.4 |
223 |
123 |
8.75 |
0.11 |
2.82 |
1.79 |
0.08 |
75th percentile |
30.2 |
282 |
158 |
10.4 |
0.15 |
3.45 |
2.08 |
0.10 |
95th percentile |
42.7 |
413 |
231 |
13.4 |
0.29 |
7.18 |
2.53 |
0.14 |
CI, confidence interval; CV, coefficient of variation; NDM, N-desmethyltamoxifen; 4-OH Tam, 4-hydroxytamoxifen; SD, standard deviation; Tam, tamoxifen.
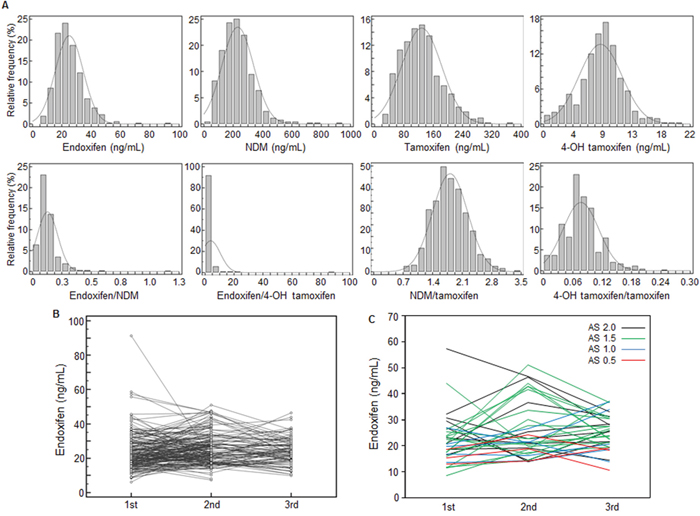
Figure 2: Distribution of and changes in the concentrations of tamoxifen and its metabolites. (A) Histogram of tamoxifen metabolite concentrations (ng/mL) and ratios in 550 plasma specimens. Tamoxifen metabolites and ratios showed wide variation (CV, 30-274%). (B) Plasma concentrations of endoxifen at 3-month intervals in 179 patients; 0.23- to 4.87-fold changes were observed in endoxifen concentrations over the 3-month interval. (C) Plasma concentrations of endoxifen according to CYP2D6 AS in 33 patients. Endoxifen concentrations at 3-month intervals showed wide variations regardless of the CYP2D6 AS. AS, activity score; NDM, N-desmethyltamoxifen; 4-OH tamoxifen, 4-hydroxytamoxifen.
Genotype frequencies
Genotype frequencies are summarized in Table 3 and Table 4. For the CYP2D6 gene, the CYP2D6*10 allele was identified in 42.5% of all alleles, and CYP2D6 *10/*10 homozygotes accounted for 17.5% of all patients. In the analysis according to the activity score (AS) predicted by CYP2D6 genotype, compared to the homozygote of the functional allele (2 AS, 23.8%), 46.3% of patients showed lower activity of 1.5 AS, followed by those with 1 AS (25.0%). For the CYP2B6 gene, the CYP2B6*6 allele associated with decreased enzyme activity was most frequently identified (12.9%). The allele frequencies of CYP2C9*3, CYP2C19*2, and CYP2C19*3 were 4.2%, 29.3%, and 5.7% respectively. The frequency of the CYP3A5*3 allele (74.3%) was higher than that of the wild-type allele. Regarding the SULT1A1 and UGT2B7 genes, the *2 variant allele was most frequent (7.6% and 23.2%, respectively). For the CYP1A2, FMO1, FMO3, NR1I2, SULT1E1, and UGT2B15 genes, genotype frequencies of each variant are presented in Table 4. The CYP1A2 -2467delT variant was most frequent (47.5%). SULT1E1 -9-469A>G and SULT1E1 -10+311G>C showed complete linkage disequilibrium.
Table 3: Genotype frequencies of CYP2B6, CYP2C9, CYP2C19, CYP2D6, CYP3A4, CYP3A5, SULT1A1, SULT2A1, and UGT2B7 genes
Gene |
Genotype |
Predicted phenotype |
n |
% |
|---|---|---|---|---|
CYP2B6 |
*1/*1 |
NF/NF |
34 |
54.8 |
*1/*2B |
NF/NF |
2 |
3.2 |
|
*1/*4 |
NF/IOF |
7 |
11.3 |
|
*1/*5 |
NF/NF |
1 |
1.6 |
|
*1/*6 |
NF/DOF |
12 |
19.4 |
|
*1/*7 |
NF/NF |
2 |
3.2 |
|
*1/*22 |
NF/IOF |
1 |
1.6 |
|
*2B/*6 |
NF/DOF |
2 |
3.2 |
|
*6/*6 |
DOF/DOF |
1 |
1.6 |
|
CYP2C9 |
*1/*1 |
NF/NF |
64 |
88.9 |
*1/*3 |
NF/DOF |
6 |
8.3 |
|
*1/*7 |
NF/NF |
2 |
2.8 |
|
CYP2C19 |
*1/*1 |
NF/NF |
25 |
35.7 |
*1/*2 |
NF/LOF |
29 |
41.4 |
|
*1/*3 |
NF/LOF |
3 |
4.3 |
|
*1/*17 |
NF/IOF |
4 |
5.7 |
|
*2/*2 |
LOF/LOF |
4 |
5.7 |
|
*2/*3 |
LOF/LOF |
3 |
4.3 |
|
*2/*17 |
LOF/IOF |
1 |
1.4 |
|
*3/*3 |
LOF/LOF |
1 |
1.4 |
|
CYP2D6 |
*1/*1 |
NF/NF (2)a |
12 |
15.0 |
*1/*2 |
NF/NF (2) |
7 |
8.8 |
|
*1/*5 |
NF/LOF (1) |
4 |
5.0 |
|
*1/*10 |
NF/DOF (1.5) |
22 |
27.5 |
|
*1/*41 |
NF/DOF (1.5) |
3 |
3.8 |
|
*2/*10 |
NF/DOF (1.5) |
8 |
10.0 |
|
*5/*10 |
LOF/DOF (0.5) |
3 |
3.8 |
|
*6/*10 |
LOF/DOF (0.5) |
1 |
1.3 |
|
*10/*10 |
DOF/DOF (1) |
14 |
17.5 |
|
*10/*10xN |
DOF/DOF, xN (1.5) |
1 |
1.3 |
|
*10/*39 |
DOF/NF (1.5) |
3 |
3.8 |
|
*10/*41 |
DOF/DOF (1) |
2 |
2.5 |
|
CYP3A4 |
*1/*1 |
Wt/Wt |
78 |
97.5 |
*1/*5 |
Wt/Vtb |
1 |
1.3 |
|
*1/*18 |
Wt/Vt |
1 |
1.3 |
|
CYP3A5 |
*1/*1 |
NF/NF |
5 |
3.4 |
*1/*3 |
NF/DOF |
27 |
18.2 |
|
*3/*3 |
DOF/DOF |
41 |
27.7 |
|
*3/*5 |
DOF/DOF |
1 |
0.7 |
|
SULT1A1 |
*1/*1 |
Wt/Wt |
67 |
84.8 |
*1/*2 |
Wt/Vt |
12 |
15.2 |
|
SULT2A1 |
*1/*1 |
Wt/Wt |
80 |
100.0 |
UGT2B7 |
*1/*1 |
Wt/Wt |
28 |
40.6 |
*1/*2 |
Wt/Vt |
27 |
39.1 |
|
*1/*3 |
Wt/Vt |
8 |
11.6 |
|
*2/*3 |
Vt/Vt |
5 |
7.2 |
|
*3/*3 |
Vt/Vt |
1 |
1.4 |
DOF, decrease of function; IOF, increase of function; LOF, loss of function; NF, normal function; Vt, variant; Wt, wild type.
aActivity scores of CYP2D6 gene in parentheses.
bFor genes whose phenotype is not well predicted by the genotype, the presence or absence of the variant allele is presented.
Table 4: Genotype frequencies of CYP1A2, FMO1, FMO3, NR1I2, SULT1E1, andUGT2B15 genes
Polymorphism |
Genotype, n (%) |
||
|---|---|---|---|
Wild homozygote |
Heterozygote |
Variant homozygote |
|
CYP1A2 -3860G>A |
46 (57.5) |
30 (37.5) |
4 (5.0) |
CYP1A2 -2467delT |
21 (26.3) |
42 (52.5) |
17 (21.3) |
CYP1A2 -739T>G |
70 (87.5) |
10 (12.5) |
0 (0.0) |
CYP1A2 -163A>C |
32 (41.6) |
40 (51.9) |
5 (6.5) |
CYP1A2 5347C>T |
52 (65.0) |
26 (32.5) |
2 (2.5) |
FMO1 747C>T |
78 (97.5) |
2 (2.5) |
0 (0.0) |
FMO1 1188A>G |
78 (97.5) |
2 (2.5) |
0 (0.0) |
FMO1 *111C>T |
43 (54.4) |
31 (39.2) |
5 (6.3) |
FMO1 *207C>T |
41 (51.3) |
34 (42.5) |
5 (6.3) |
FMO3 441C>T |
48 (60.0) |
30 (37.5) |
2 (2.5) |
FMO3 472G>A |
55 (68.8) |
22 (27.5) |
3 (3.8) |
FMO3 627+10C>G |
78 (97.5) |
2 (2.5) |
0 (0.0) |
FMO3 769G>A |
58 (75.3) |
15 (19.5) |
4 (5.2) |
FMO3 923A>G |
56 (70.9) |
19 (24.1) |
4 (5.1) |
NR1I2 -1135C>T |
41 (52.6) |
31 (39.7) |
6 (7.7) |
SULT1E1 -64G>A |
40 (50.0) |
32 (40.0) |
8 (10.0) |
SULT1E1 -9-899G>A |
48 (60.0) |
27 (33.8) |
5 (6.3) |
SULT1E1 -9-682A>G |
67 (84.8) |
12 (15.2) |
0 (0.0) |
SULT1E1 -9-469A>G |
34 (42.5) |
35 (43.8) |
11 (13.8) |
SULT1E1 -10+311G>C |
34 (42.5) |
35 (43.8) |
11 (13.8) |
UGT2B15 253G>T |
18 (22.5) |
46 (57.5) |
16 (20.0) |
UGT2B15 1568A>C |
63 (78.8) |
14 (17.5) |
3 (3.8) |
UGT2B15 *185A>T |
46 (57.5) |
29 (36.3) |
5 (6.3) |
Genotype frequencies of variants with minor allele frequency ≥ 1% and call rate > 85% are listed.
Associations between genotypes and plasma concentrations of tamoxifen and its metabolites
Various genotypes showed associations with tamoxifen and its metabolites in univariate analysis. For genotypes showing a statistically significant association with the concentrations of tamoxifen and its metabolites in multivariable analysis, i.e., CYP1A2 -2467delT, CYP2B6 genotype, CYP2D6 AS, FMO3 441C>T, SULT1E1 -9-899G>A, SULT1E1 -9-682A>G, SULT1E1 -9-469A>G, and UGT2B7 genotype, the mean plasma concentrations according to genotype and predicted phenotype are presented in Table 5. The 4-OH tamoxifen/tamoxifen ratio increased with BMI (P = 0.024). In multivariable analysis including tamoxifen and BMI in addition to variables with univariate P-values < 0.100, concentrations of metabolites showed correlations with CYP1A2 -2467delT, CYP2B6 genotype, CYP2D6 AS, and FMO3 441C>T. The mean concentration of endoxifen (P < 0.001) was decreased and that of NDM (P < 0.001) was increased in accord with the decrease in CYP2D6 AS (Figure 3). The ratios of tamoxifen and its metabolites, endoxifen/NDM, NDM/tamoxifen, and 4-OH tamoxifen/tamoxifen, also showed associations with CYP2D6 AS. Patients who were heterozygous or homozygous for CYP1A2 -2467delT had lower endoxifen concentrations than those who were homozygous wild-type (25.3 vs. 30.5 ng/mL, P = 0.048). FMO3 441C>T was associated with high NDM concentration (206 ng/mL for CC genotype vs. 265 ng/mL for CT and TT genotypes, P = 0.027). For 4-OH tamoxifen, the concentration tended to be increased in accord with a decrease in CYP2B6 activity (P = 0.002). 4-OH tamoxifen was found to be decreased according to the increase in the number of variants of the UGT2B7 gene, but statistical significance was not conserved when considering tamoxifen concentration (P = 0.122). In addition to CYP2D6 AS, three variants on the SULT1E1 gene, SULT1E1 -9-899G>A, SULT1E1 -9-682A>G, and SULT1E1 -9-469A>G, affected the ratio of tamoxifen and its metabolites. There was no genotype effect on the ratio of endoxifen and 4-OH tamoxifen. Figure 2C shows multiple endoxifen measurements classified by the CYP2D6 AS; patients showed a wide variation of endoxifen concentrations regardless of the CYP2D6 AS.
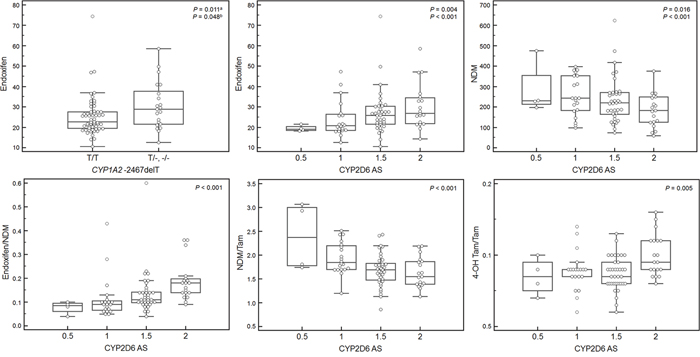
Figure 3: Concentrations of plasma tamoxifen metabolites and their ratios according to CYP1A2 -2467delT genotype and CYP2D6 activity score (AS). Box-plots show differences in endoxifen concentration according to classification based on the genotype of CYP1A2 -2467delT and differences in the concentrations of tamoxifen metabolites and their ratios according to CYP2D6 AS among associations with multivariable P-value less than 0.050 in Table 5. The other statistical significances between metabolite concentrations and genotypes or predicted phenotypes are presented in Table 5. Deletion of nucleotide T in CYP1A2 c.-2467 resulted in higher endoxifen concentrations than wild type. The concentrations and ratios of endoxifen, endoxifen/NDM, and 4-OH tamoxifen/tamoxifen were positively correlated with CYP2D6 AS, and NDM and NDM/tamoxifen were negatively correlated with CYP2D6 AS. NDM, N-desmethyltamoxifen; 4-OH tamoxifen, 4-hydroxytamoxifen; Tam, tamoxifen.
aMultivariable P-value including genetic variants with univariate P-values < 0.100 and body mass index.
bP-value from multivariable analysis including tamoxifen concentration as an indicator of compliance and drug absorption.
Table 5: Mean concentrations of tamoxifen and its metabolites according to genotypes and predicted phenotypes
Variables (n) |
Mean concentrations (95% CI) in ng/mL |
|||||||
|---|---|---|---|---|---|---|---|---|
Endoxifen |
NDM |
Tam |
4-OH Tam |
Endoxifen /NDM |
Endoxifen /4-OH Tam |
NDM /Tam |
4-OH Tam /Tam |
|
CYP1A2 -2467delT |
||||||||
TT (21) |
30.5 |
243 |
149 |
10.3 |
0.13 |
3.03 |
1.68 |
0.07 |
T- + -- (59) |
25.3 |
225 |
123 |
9.27 |
0.14 |
2.83 |
1.80 |
0.08 |
P |
0.043a |
0.503 |
0.062 |
0.125 |
0.899 |
0.303 |
0.216 |
0.066 |
CYP2B6 genotype |
||||||||
NF/IOF (8) |
20.5 |
216 |
123 |
7.20 |
0.10 |
3.44 |
1.79 |
0.06 |
NF/NF (52) |
27.2 |
238 |
133 |
9.69 |
0.14 |
2.86 |
1.77 |
0.08 |
NF/DOF (14) |
30.1 |
244 |
146 |
11.0 |
0.14 |
2.76 |
1.76 |
0.09 |
DOF/DOF (1) |
27.6 |
265 |
109 |
9.80 |
0.10 |
2.82 |
2.43 |
0.09 |
P |
0.031 |
0.539 |
0.429 |
0.005 |
0.335 |
0.361 |
0.654 |
0.039 |
CYP2D6 AS |
||||||||
2 (19) |
30.1 |
184 |
116 |
10.2 |
0.19 |
2.94 |
1.63 |
0.10 |
1.5 (37) |
27.1 |
234 |
138 |
9.54 |
0.14 |
2.95 |
1.68 |
0.07 |
1 (20) |
24.0 |
254 |
132 |
9.30 |
0.11 |
2.73 |
1.93 |
0.08 |
0.5 (4) |
19.5 |
283 |
119 |
7.90 |
0.08 |
2.78 |
2.39 |
0.07 |
P |
0.009 |
0.018 |
0.581 |
0.132 |
< 0.001 |
0.181 |
< 0.001 |
0.010 |
FMO3 441C>T |
||||||||
CC (48) |
27.0 |
206 |
122 |
9.26 |
0.15 |
3.04 |
1.73 |
0.08 |
CT + TT (32) |
26.2 |
265 |
143 |
9.99 |
0.12 |
2.65 |
1.83 |
0.08 |
P |
0.802 |
0.013 |
0.076 |
0.242 |
0.063 |
0.141 |
0.237 |
0.298 |
SULT1E1 -9-899G>A |
||||||||
GG (48) |
26.6 |
252 |
139 |
9.76 |
0.12 |
2.83 |
1.83 |
0.08 |
GA (27) |
26.9 |
200 |
120 |
9.28 |
0.16 |
3.00 |
1.67 |
0.08 |
AA (5) |
25.4 |
171 |
99.4 |
8.96 |
0.19 |
2.79 |
1.70 |
0.11 |
P |
0.881 |
0.014 |
0.045 |
0.383 |
0.022 |
0.636 |
0.117 |
0.022 |
SULT1E1 -9-899G>A |
||||||||
GG (48) |
26.6 |
252 |
139 |
9.76 |
0.12 |
2.83 |
1.83 |
0.08 |
GA+AA (32) |
26.7 |
195 |
117 |
9.23 |
0.16 |
2.97 |
1.67 |
0.09 |
P |
0.967 |
0.015 |
0.068 |
0.399 |
0.038 |
0.530 |
0.076 |
0.141 |
SULT1E1 -9-682A>G |
||||||||
AA (67) |
27.3 |
234 |
130 |
9.58 |
0.14 |
2.94 |
1.81 |
0.08 |
AG + GG (12) |
23.1 |
209 |
131 |
9.35 |
0.14 |
2.60 |
1.59 |
0.08 |
P |
0.199 |
0.444 |
0.971 |
0.784 |
0.915 |
0.216 |
0.078 |
0.841 |
SULT1E1 -9-469A>G |
||||||||
AA+AG (69) |
26.8 |
221 |
127 |
9.44 |
0.15 |
2.94 |
1.75 |
0.08 |
GG (11) |
25.9 |
281 |
152 |
10.2 |
0.10 |
2.51 |
1.90 |
0.07 |
P |
0.950 |
0.077 |
0.148 |
0.380 |
0.059 |
0.195 |
0.220 |
0.245 |
UGT2B7 genotype |
||||||||
*1/*1 (28) |
28.4 |
231 |
135 |
10.2 |
0.15 |
2.73 |
1.69 |
0.08 |
*1/*2, *1/*3 (35) |
26.4 |
236 |
132 |
9.02 |
0.13 |
3.15 |
1.81 |
0.07 |
*2/*3, *3/*3 (6) |
20.5 |
158 |
80.7 |
8.38 |
0.16 |
2.44 |
1.93 |
0.11 |
P |
0.145 |
0.329 |
0.080 |
0.057 |
0.583 |
0.818 |
0.135 |
0.429 |
AS, activity score; BMI, body mass index; CI, confidence interval; NDM, N-desmethyltamoxifen; 4-OH Tam, 4-hydroxytamoxifen; Tam, tamoxifen.
aUnivariable p-value.
bMultivariable p-value.
cP-value from multivariable analysis including tamoxifen concentration as indicator for compliance and drug absorption.
DISCUSSION
In this study, we measured the plasma concentrations of tamoxifen and its metabolites in breast cancer patients treated with tamoxifen and confirmed significant variation among patients. We also evaluated the effects of genetic polymorphisms of multiple genes and clinical factors on tamoxifen metabolism.
The plasma concentrations of tamoxifen and its metabolites showed inter-individual variation among patients receiving the same dose of tamoxifen. To identify clinical and genetic factors for the prediction of these inter-individual variations and to expand the range of pharmacokinetics predicted by genetic factors, we included multiple genetic polymorphisms of tamoxifen metabolizing enzymes. Based on our data, we observed an association between CYP1A2 -2467delT, CYP2B6 genotype, CYP2D6 AS, FMO3 441C>T, SULT1E1 -9-899G>A, SULT1E1 -9-682A>G, SULT1E1 -9-469A>G, and UGT2B7 genotype and the plasma concentrations of tamoxifen and its metabolites. When we included tamoxifen concentration as a compliance indicator in our multivariable analysis of metabolite concentrations, the statistical significances of CYP1A2 -2467delT and CYP2D6 AS for endoxifen, CYP2D6 AS and FMO3 441C>T for NDM, and the CYP2B6 genotype for 4-OH tamoxifen were conserved. CYP2D6 AS showed the most statistically significant effects on various metabolites and ratios. CYP2D6 is known to be the main enzyme responsible for the metabolism of tamoxifen, leading to variability in the concentrations of endoxifen and 4-OH tamoxifen [2, 24]. The CYP1A2 enzyme is known to affect only a small part of the metabolism of NDM to endoxifen [11]. Our study also showed that CYP1A2 -2467delT correlated with endoxifen concentration, but not with the ratio of metabolites, which suggests a minor contribution of CYP1A2 to tamoxifen metabolism and the possibility of other contributing factors. Three polymorphisms of the SULT1E1 gene were associated with the ratio of tamoxifen metabolites, suggesting that the concentration of primary metabolites of tamoxifen can be influenced by enzymes located in a distant metabolic pathway. However, these three polymorphisms have not been evaluated in previous studies. Although previous studies have reported the roles of the SULT1A1 and SULT1A2 genes in tamoxifen metabolism [27, 28], the association between tamoxifen metabolite concentration and the SULT1E1 gene, which is involved in sulfation of 4-OH tamoxifen to 4-OH tamoxifen sulfate, has barely been studied clinically [28]. SULT1E1 -64G>A (rs3736599) homozygotes showed low endoxifen concentrations [28], but the difference was not statistically significant as our study (mean endoxifen concentration in our study, 27.0 ng/mL in wild homozygotes and heterozygotes vs. 23.7 ng/mdL in variant homozygotes, P = 0.389). UGT2B7*2 (rs7439366) was reported to be correlated with concentrations of tamoxifen and its metabolites in some [33, 34], but not other studies [8, 30]. When we simultaneously analyzed UGT2B7*2 and *3, low metabolite concentrations were observed in patients with a variant allele, but statistical significance was not conserved after multivariate correction including tamoxifen concentration. The difference observed with respect to UGT2B7 variant in our study seemed to have been caused by differences in compliance and absorption. BMI was correlated with the 4-OH tamoxifen/tamoxifen ratio in our study. In previous studies, age was correlated with the concentrations of tamoxifen, endoxifen, and NDM [36], and BMI and ethnicity were also reported to be related with endoxifen concentration [24]. In our study, although several variants showed correlations with biochemical phenotypes as described above, there was no variant that correlated with both metabolic concentration and corresponding ratio except CYP2D6 AS and SULT1E1 -9-899G>A. We evaluated multiple genetic polymorphisms and various clinical variables as candidates to explain the inter-individual variation in tamoxifen metabolism. Nevertheless, these factors only partially explained the inter-individual variability of in vivo metabolite concentrations (adjusted R square less than 0.300 for each metabolite and their ratios). Previous studies also reported that CYP2D6 genotypes could only explain 39% and 9%, respectively, of the variability of the concentrations of endoxifen and 4-OH tamoxifen [2, 30]. Although CYP2D6 only explains a part of the variability in metabolic concentration, our findings suggest a low possibility of other genetic variants or combinations that could explain the variation of tamoxifen metabolism better than CYP2D6.
Measurements from each patient at 3-month intervals showed remarkable intra-individual variation in our study, despite the fact that the time required to reach steady state had already passed in those patients. A previous study reported that variations in the intra-patient concentrations of tamoxifen and endoxifen were small at two sampling points with at least a 4-week interval [37]. Our study monitored patients at 3-months intervals given the long-term tamoxifen use. Additionally, the large intra-individual variation in this condition well reflects the routine clinical setting. Even when we classified the serial measurements according to CYP2D6 AS, most patients showed fluctuations in plasma endoxifen concentration regardless of CYP2D6 AS group. This finding shows that genetic polymorphisms have limitations in being able to account for the changes in concentration of tamoxifen and its metabolites in vivo, and tamoxifen metabolism would also be influenced by alterations in the clinical status of each patient. However, except in four patients who were either non-compliant or used CYP inhibitors, we could not identify any specific factor that might influence tamoxifen and its metabolite concentrations. This reflects the difficulty in determining variable factors in a routine clinical setting. Therefore, although genetic polymorphisms might be able to help physicians decide on the initial dose of tamoxifen, it would be necessary to monitor factors reflecting the current status of each patient. In many cases, clinical and environmental factors that cause alterations of the tamoxifen metabolic status cannot be identified; thus, monitoring using direct measurements of plasma tamoxifen and its metabolites would be more informative for estimating tamoxifen dosing and other confounding factors including compliance and concomitant medications. Recently, a studies on tamoxifen dose escalation based on endoxifen concentration was published [38, 39]. Although more evidence is required to confirm the correlation between endoxifen concentration and clinical outcome, this study showed that the best method for determining endoxifen exposure is to measure endoxifen concentration rather than to evaluate clinical and genetic factors and indicated the possibility of tamoxifen dose adjustment using therapeutic drug monitoring [38, 39].
A limitation of our study was that rare genotypes such as CYP2D6 *5/*6 were not evaluated. Although there is no universal consensus for translating CYP2D6 genotypes into phenotypic categories, previous studies have shown that the concentrations of tamoxifen and its metabolites differ according to CYP2D6 phenotype predicted by genotype [24, 30, 40]. Considering the differences in plasma concentrations associated with CYP2D6 AS even among CYP2D6 extensive metabolizers in our study, we suggest that the CYP2D6 gene has a potent relationship with tamoxifen metabolism. Another limitation is that genotyping was performed in only approximately one-third of patients, which limits the power of statistical analysis. Previous studies showed a correlation between endoxifen concentration and recurrence or relapse-free survival of breast cancer [24, 41]. However, the association between drug concentration and clinical outcome has not been validated; thus, validation through further studies will be required. The strength of our study is that we addressed the genotype frequencies of various genes on tamoxifen metabolism in a Korean population and showed intra-individual variation of tamoxifen metabolic status even in the same genotype-predicted phenotype group. The frequency of functional alleles is different among each ethnic population, with around 71% of Caucasians and 50% of Asians having functional alleles [7]; thus, the correlation between variants and clinical and biochemical phenotypes will need to be validated in each ethnic group.
In this study, we showed that various polymorphisms in tamoxifen metabolizing enzymes account in part for inter-individual variations in the plasma concentrations of tamoxifen and its metabolites. Among the multiple genes evaluated, we confirmed a prominent role of the CYP2D6 gene as a genetic factor affecting tamoxifen metabolism. However, tamoxifen metabolism could not be predicted by genetic polymorphisms alone, as we observed by serial measurements of plasma tamoxifen and its metabolites. Our results showed intra-individual variations even in patients belonging to the same CYP2D6 phenotype group. In this respect, our study suggests that therapeutic drug monitoring of plasma tamoxifen and its metabolites would be helpful in evaluating patient compliance, insufficient tamoxifen dose, various unknown confounding factors that are involved in tamoxifen metabolism, and in establishing an individualized therapeutic plan.
MATERIALS AND METHODS
Patients
This study included patients who received adjuvant tamoxifen. Two hundred eighty-one Korean patients who were pathologically diagnosed with ER+ and/or PR+ breast cancer at Samsung Medical Center were retrospectively included. Patients were treated with 20 mg daily tamoxifen with or without ovarian suppression using the GnRH agonist goserelin after surgery, which included either breast-conserving surgery followed by adjuvant radiotherapy or mastectomy. The study excluded patients with the following conditions: metastatic disease at diagnosis, pregnancy, breast feeding, active tuberculosis, acute myocardial infarction within 6 months, uncontrolled angina pectoris, heart failure, forced expiratory volume in one second (FEV1) less than 60% of that of a healthy population, serum creatinine ≥ 2.0 mg/dL, serum total bilirubin ≥ 2.0 mg/dL, history of aspirin administration within 7 days or anticoagulants, and concomitant CYP2D6 inhibitors at initial tamoxifen administration. Compliance was evaluated during a routine regulatory visit by counting the remaining number of doses. Plasma concentrations of tamoxifen and its metabolites were measured at least 8 weeks after initiating tamoxifen therapy. Among these patients, to measure the plasma concentrations of tamoxifen and its metabolites, a second blood sample was collected 3 months after the initial blood sampling in 182 patients, and a third blood sample was collected in 88 patients. Peripheral blood specimens were collected before taking tamoxifen. Clinical and laboratory data at the time of blood collection including age, sex, BMI, liver function test, menopausal state, and concomitant medications was collected. Menopause was defined as amenorrhea of greater than 12 consecutive months. This study was approved by the Samsung Medical Center Institutional Review Board. Informed consent was obtained from all patients.
Metabolite analysis
Concentrations of tamoxifen, 4-OH tamoxifen, NDM, and endoxifen were measured in a total of 550 plasma specimens. Plasma concentrations of tamoxifen and its metabolites were measured by high-performance liquid chromatography-tandem mass spectrometry [42, 43]. Analyses were performed on an API 4000 tandem mass spectrometer (AB Sciex, Foster City, CA, USA) equipped with an Agilent Technologies Series 1200 HPLC system (Agilent Technologies, Santa Clara, CA, USA). The column used was a Poroshell 120 EC-C18 (2.7 μm, 3 mm × 50 mm). The mobile phases A and B were water with 2 mM ammonium acetate and acetonitrile, respectively, both containing 0.1% formic acid. For simple protein precipitation, the plasma samples were mixed with acetonitrile containing an internal standard (IS, diphenhydramine) and centrifuged for 5 min. Quantitative analysis was performed in multiple reaction-monitoring mode (m/z 372.2 → 72.2 for tamoxifen, 388.2 → 72.3 for 4-OH tamoxifen, 358.2 → 58.2 for NDM, 374.3 → 58.1 for endoxifen, and 256.2 → 167.0 for IS) with a total running time of 5 min for each sample. Intra- and inter-day coefficients of variation were lower than 10%.
Genotyping
Tests for genetic variation in tamoxifen-metabolizing enzymes were performed in 80 of a total of 281 patients. Genomic DNA was extracted from peripheral blood leukocytes using the Wizard® Genomic DNA Purification Kit according to the manufacturer’s instructions (Promega, Fitchburg, WI, USA). Extracted DNA was stored at -70°C. Genotyping of drug metabolizing enzymes was performed using the DMET Plus array (Affymetrix, Santa Clara, CA, USA) according to the protocol described in the user guide. The arrays were scanned with a GeneChip® Scanner 3000 7G (Affymetrix), and genotype calls were generated with DMET Console software (Affymetrix). Long-range PCR was performed to identify common deletions or duplications in the CYP2D6 gene [44]. In total, 211 polymorphisms in 16 genes in the tamoxifen metabolic pathway (CYP1A2, CYP2B6, CYP2C9, CYP2C19, CYP2D6, CYP3A4, CYP3A5, FMO1, FMO3, NR1I2, SULT1A1, SULT1E1, SULT2A1, UGT1A4, UGT2B7, and UGT2B15) were genotyped. One polymorphism was excluded due to a Hardy–Weinberg equilibrium (HWE) p-value less than 0.001. Finally, 210 polymorphisms in 16 genes were included in this study (Supplementary Table 1). Genotype was assigned according to the combination of previously known variants for CYP2B6, CYP2C9, CYP2C19, CYP2D6, CYP3A4, CYP3A5, SULT1A1, SULT2A1, and UGT2B7 genes.
Statistical analysis
Plasma concentrations of tamoxifen, 4-OH tamoxifen, NDM, and endoxifen and their ratios were tested for normal distribution. Variables without a normal distribution (endoxifen, the ratio of endoxifen/NDM, and the ratio of endoxifen/4-OH tamoxifen) were converted to a normal distribution by applying a logarithmic scale before statistical analyses. Comparisons of plasma concentrations of tamoxifen, 4-OH tamoxifen, NDM, endoxifen, and their ratios with clinical variables and genotypes were performed by simple regression analysis. Variants with call rates higher than 85% were included in the statistical analysis and in assignment of genotype and predicted phenotype. For genes with previously known genotypes and a predicted phenotype (CYP2B6, CYP2C9, CYP2C19, CYP3A4, CYP3A5, SULT1A1, SULT2A1, and UGT2B7), the plasma concentrations of tamoxifen and its metabolites and their ratios were compared with the predicted phenotype or the presence or absence of the variant allele (Table 3). For CYP2D6, patients were classified according to AS based on previous studies and statistically analyzed [45–48]. For genes whose phenotypes were not well predicted by their genotypes (CYP1A2, FMO1, FMO3, NR1I2, SULT1E1, and UGT2B15), variants with minor allele frequency greater than or equal to 1% were evaluated according to additive, dominant, and recessive genetic models. Genetic variants and clinical variables with univariate P-value < 0.100 and BMI were included as adjusted variables for the multiple regression analysis. Multiple variable analysis including tamoxifen concentration was also performed for metabolite concentrations to evaluate drug absorption and compliance. A P-value < 0.050 was regarded to be statistically significant. Statistical analyses were performed using IBM SPSS Statistics version 20.0 (SPSS Inc., Chicago, IL, USA).
Abbreviations
AS, activity score; BMI, body mass index; CV, coefficient of variation; CYP, cytochrome P450; ER, estrogen receptor; FMO, flavin-containing monooxygenase; 4-OH tamoxifen, 4-hydroxytamoxifen; NDM, N-desmethyltamoxifen; PR, progesterone receptor; SULTs, sulfotransferases; UGTs, UDP-glucuronosyltransferases.
Author contributions
Hye In Woo and Se Kyung Lee wrote the first draft of the manuscript and managed the acquisition, analysis, and interpretation of data. Jiyoung Kim, Seok Won Kim, and Jonghan Yu managed the collection of specimens and acquisition of data. Soo Youn Bae and Jeong Eon Lee participated in the interpretation of data and revised manuscript for important intellectual content. Seok Jin Nam and Soo-Youn Lee designed the study and and revised manuscript for important intellectual content. All author contributed to drafting and critical revision of the manuscript.
CONFLICTS OF INTEREST
The authors declare no conflicts of interest.
FUNDING
This research was supported by a grant of the Korea Health Technology R&D Project through the Korea Health Industry Development Institute (KHIDI), funded by the Ministry of Health & Welfare, Republic of Korea (HI14C3418 and HI13C2098).
REFERENCES
1. Early Breast Cancer Trialists' Collaborative Group (EBCTCG). Effects of chemotherapy and hormonal therapy for early breast cancer on recurrence and 15-year survival: an overview of the randomised trials. Lancet. 2005; 365:1687-1717.
2. de Vries Schultink AH, Zwart W, Linn SC, Beijnen JH, Huitema AD. Effects of pharmacogenetics on the pharmacokinetics and pharmacodynamics of tamoxifen. Clin Pharmacokinet. 2015; 54:797-810.
3. Davies C, Godwin J, Gray R, Clarke M, Cutter D, Darby S, McGale P, Pan HC, Taylor C, Wang YC, Dowsett M, Ingle J, Peto R. Relevance of breast cancer hormone receptors and other factors to the efficacy of adjuvant tamoxifen: patient-level meta-analysis of randomised trials. Lancet. 2011; 378:771-784.
4. Davies C, Pan H, Godwin J, Gray R, Arriagada R, Raina V, Abraham M, Medeiros Alencar VH, Badran A, Bonfill X, Bradbury J, Clarke M, Collins R, et al. Long-term effects of continuing adjuvant tamoxifen to 10 years versus stopping at 5 years after diagnosis of oestrogen receptor-positive breast cancer: ATLAS, a randomised trial. Lancet. 2013; 381:805-816.
5. Burstein HJ, Temin S, Anderson H, Buchholz TA, Davidson NE, Gelmon KE, Giordano SH, Hudis CA, Rowden D, Solky AJ, Stearns V, Winer EP, Griggs JJ. Adjuvant endocrine therapy for women with hormone receptor-positive breast cancer: American Society of Clinical Oncology clinical practice guideline focused update. J Clin Oncol. 2014; 32:2255-2269.
6. Sacco K, Grech G. Actionable pharmacogenetic markers for prediction and prognosis in breast cancer. EPMA J. 2015; 6:15.
7. Bradford LD. CYP2D6 allele frequency in European Caucasians, Asians, Africans and their descendants. Pharmacogenomics. 2002; 3:229-243.
8. Binkhorst L, Mathijssen RH, Jager A, van Gelder T. Individualization of tamoxifen therapy: much more than just CYP2D6 genotyping. Cancer Treat Rev. 2015; 41:289-299.
9. Osborne CK. Tamoxifen in the treatment of breast cancer. N Engl J Med. 1998; 339:1609-1618.
10. Lu WJ, Desta Z, Flockhart DA. Tamoxifen metabolites as active inhibitors of aromatase in the treatment of breast cancer. Breast Cancer Res Treat. 2012; 131:473-481.
11. Desta Z, Ward BA, Soukhova NV, Flockhart DA. Comprehensive evaluation of tamoxifen sequential biotransformation by the human cytochrome P450 system in vitro: prominent roles for CYP3A and CYP2D6. J Pharmacol Exp Ther. 2004; 310:1062-1075.
12. Lim YC, Desta Z, Flockhart DA, Skaar TC. Endoxifen (4-hydroxy-N-desmethyl-tamoxifen) has anti-estrogenic effects in breast cancer cells with potency similar to 4-hydroxy-tamoxifen. Cancer Chemother Pharmacol. 2005; 55:471-478.
13. Johnson MD, Zuo H, Lee KH, Trebley JP, Rae JM, Weatherman RV, Desta Z, Flockhart DA, Skaar TC. Pharmacological characterization of 4-hydroxy-N-desmethyl tamoxifen, a novel active metabolite of tamoxifen. Breast Cancer Res Treat. 2004; 85:151-159.
14. Nishiyama T, Ogura K, Nakano H, Ohnuma T, Kaku T, Hiratsuka A, Muro K, Watabe T. Reverse geometrical selectivity in glucuronidation and sulfation of cis- and trans-4-hydroxytamoxifens by human liver UDP-glucuronosyltransferases and sulfotransferases. Biochem Pharmacol. 2002; 63:1817-1830.
15. Ogura K, Ishikawa Y, Kaku T, Nishiyama T, Ohnuma T, Muro K, Hiratsuka A. Quaternary ammonium-linked glucuronidation of trans-4-hydroxytamoxifen, an active metabolite of tamoxifen, by human liver microsomes and UDP-glucuronosyltransferase 1A4. Biochem Pharmacol. 2006; 71:1358-1369.
16. Krueger SK, Vandyke JE, Williams DE, Hines RN. The role of flavin-containing monooxygenase (FMO) in the metabolism of tamoxifen and other tertiary amines. Drug Metab Rev. 2006; 38:139-147.
17. Schroth W, Goetz MP, Hamann U, Fasching PA, Schmidt M, Winter S, Fritz P, Simon W, Suman VJ, Ames MM, Safgren SL, Kuffel MJ, Ulmer HU, et al. Association between CYP2D6 polymorphisms and outcomes among women with early stage breast cancer treated with tamoxifen. JAMA. 2009; 302:1429-1436.
18. Abraham JE, Maranian MJ, Driver KE, Platte R, Kalmyrzaev B, Baynes C, Luccarini C, Shah M, Ingle S, Greenberg D, Earl HM, Dunning AM, Pharoah PD, et al. CYP2D6 gene variants: association with breast cancer specific survival in a cohort of breast cancer patients from the United Kingdom treated with adjuvant tamoxifen. Breast Cancer Res. 2010; 12:R64.
19. Dezentje VO, van Schaik RH, Vletter-Bogaartz JM, van der Straaten T, Wessels JA, Kranenbarg EM, Berns EM, Seynaeve C, Putter H, van de Velde CJ, Nortier JW, Gelderblom H, Guchelaar HJ. CYP2D6 genotype in relation to tamoxifen efficacy in a Dutch cohort of the tamoxifen exemestane adjuvant multinational (TEAM) trial. Breast Cancer Res Treat. 2013; 140:363-373.
20. Clarke NJ. Mass spectrometry in precision medicine: phenotypic measurements alongside pharmacogenomics. Clin Chem. 2016; 62:70-76.
21. Zafra-Ceres M, de Haro T, Farez-Vidal E, Blancas I, Bandres F, de Duenas EM, Ochoa-Aranda E, Gomez-Capilla JA, Gomez-Llorente C. Influence of CYP2D6 polymorphisms on serum levels of tamoxifen metabolites in Spanish women with breast cancer. Int J Med Sci. 2013; 10:932-937.
22. Borges S, Desta Z, Li L, Skaar TC, Ward BA, Nguyen A, Jin Y, Storniolo AM, Nikoloff DM, Wu L, Hillman G, Hayes DF, Stearns V, et al. Quantitative effect of CYP2D6 genotype and inhibitors on tamoxifen metabolism: implication for optimization of breast cancer treatment. Clin Pharmacol Ther. 2006; 80:61-74.
23. Lim JS, Chen XA, Singh O, Yap YS, Ng RC, Wong NS, Wong M, Lee EJ, Chowbay B. Impact of CYP2D6, CYP3A5, CYP2C9 and CYP2C19 polymorphisms on tamoxifen pharmacokinetics in Asian breast cancer patients. Br J Clin Pharmacol. 2011; 71:737-750.
24. Madlensky L, Natarajan L, Tchu S, Pu M, Mortimer J, Flatt SW, Nikoloff DM, Hillman G, Fontecha MR, Lawrence HJ, Parker BA, Wu AH, Pierce JP. Tamoxifen metabolite concentrations, CYP2D6 genotype, and breast cancer outcomes. Clin Pharmacol Ther. 2011; 89:718-725.
25. Xu Y, Sun Y, Yao L, Shi L, Wu Y, Ouyang T, Li J, Wang T, Fan Z, Fan T, Lin B, He L, Li P, et al. Association between CYP2D6 *10 genotype and survival of breast cancer patients receiving tamoxifen treatment. Ann Oncol. 2008; 19:1423-1429.
26. Lim HS, Ju Lee H, Seok Lee K, Sook Lee E, Jang IJ, Ro J. Clinical implications of CYP2D6 genotypes predictive of tamoxifen pharmacokinetics in metastatic breast cancer. J Clin Oncol. 2007; 25:3837-3845.
27. Gjerde J, Hauglid M, Breilid H, Lundgren S, Varhaug JE, Kisanga ER, Mellgren G, Steen VM, Lien EA. Effects of CYP2D6 and SULT1A1 genotypes including SULT1A1 gene copy number on tamoxifen metabolism. Ann Oncol. 2008; 19:56-61.
28. Fernandez-Santander A, Gaibar M, Novillo A, Romero-Lorca A, Rubio M, Chicharro LM, Tejerina A, Bandres F. Relationship between genotypes Sult1a2 and Cyp2d6 and tamoxifen metabolism in breast cancer patients. PLoS One. 2013; 8:e70183.
29. Jin Y, Desta Z, Stearns V, Ward B, Ho H, Lee KH, Skaar T, Storniolo AM, Li L, Araba A, Blanchard R, Nguyen A, Ullmer L, et al. CYP2D6 genotype, antidepressant use, and tamoxifen metabolism during adjuvant breast cancer treatment. J Natl Cancer Inst. 2005; 97:30-39.
30. Murdter TE, Schroth W, Bacchus-Gerybadze L, Winter S, Heinkele G, Simon W, Fasching PA, Fehm T; German Tamoxifen and AI Clinicians Group, Eichelbaum M, Schwab M, Brauch H. Activity levels of tamoxifen metabolites at the estrogen receptor and the impact of genetic polymorphisms of phase I and II enzymes on their concentration levels in plasma. Clin Pharmacol Ther. 2011; 89:708-717.
31. Saladores P, Mürdter T, Eccles D, Chowbay B, Zgheib NK, Winter S, Ganchev B, Eccles B, Gerty S, Tfayli A, Lim JS, Yap YS, Ng RC, et al. Tamoxifen metabolism predicts drug concentrations and outcome in premenopausal patients with early breast cancer. Pharmacogenomics J. 2014; 15:84-94.
32. Teft WA, Gong IY, Dingle B, Potvin K, Younus J, Vandenberg TA, Brackstone M, Perera FE, Choi YH, Zou G, Legan RM, Tirona RG, Kim RB. CYP3A4 and seasonal variation in vitamin D status in addition to CYP2D6 contribute to therapeutic endoxifen level during tamoxifen therapy. Breast Cancer Res Treat. 2013; 139:95-105.
33. Areepium N, Panomvana D, Rungwanonchai P, Sathaporn S, Voravud N. Effects of CYP2D6 and UGT2B7 polymorphisms on pharmacokinetics of tamoxifen in Thai breast cancer patients. Breast Cancer (Dove Med Press). 2013; 5:73-78.
34. Romero-Lorca A, Novillo A, Gaibar M, Bandres F, Fernandez-Santander A. Impacts of the glucuronidase genotypes UGT1A4, UGT2B7, UGT2B15 and UGT2B17 on tamoxifen metabolism in breast cancer patients. PLoS One. 2015; 10:e0132269.
35. http://medicine.iupui.edu/clinpharm/ddis/main-table/. Accessed 18 March 2016.
36. Lien EA, Soiland H, Lundgren S, Aas T, Steen VM, Mellgren G, Gjerde J. Serum concentrations of tamoxifen and its metabolites increase with age during steady-state treatment. Breast Cancer Res Treat. 2013; 141:243-248.
37. Fotoohi AK, Karim H, Lafolie P, Pohanka A, Ostervall J, Hatschek T, Vitols S. Pronounced interindividual but not intraindividual variation in tamoxifen and metabolite levels in plasma during adjuvant treatment of women with early breast cancer. Ther Drug Monit. 2016; 38:239-245.
38. Koolen SL, Bins S, Mathijssen RH. Individualized tamoxifen dose escalation-letter. Clin Cancer Res. 2016; 22:6300.
39. Fox P, Balleine RL, Lee C, Gao B, Balakrishnar B, Menzies AM, Yeap SH, Ali SS, Gebski V, Provan P, Coulter S, Liddle C, Hui R, et al. Dose escalation of tamoxifen in patients with low endoxifen level: evidence for therapeutic drug monitoring-the TADE study. Clin Cancer Res. 2016; 22:3164-3171.
40. Barginear MF, Jaremko M, Peter I, Yu C, Kasai Y, Kemeny M, Raptis G, Desnick RJ. Increasing tamoxifen dose in breast cancer patients based on CYP2D6 genotypes and endoxifen levels: effect on active metabolite isomers and the antiestrogenic activity ccore. Clin Pharmacol Ther. 2011; 90:605-611.
41. Saladores P, Murdter T, Eccles D, Chowbay B, Zgheib NK, Winter S, Ganchev B, Eccles B, Gerty S, Tfayli A, Lim JS, Yap YS, Ng RC, et al. Tamoxifen metabolism predicts drug concentrations and outcome in premenopausal patients with early breast cancer. Pharmacogenomics J. 2015; 15:84-94.
42. Jager NG, Rosing H, Schellens JH, Linn SC, Beijnen JH. Tamoxifen dose and serum concentrations of tamoxifen and six of its metabolites in routine clinical outpatient care. Breast Cancer Res Treat. 2014; 143:477-483.
43. Binkhorst L, Mathijssen RH, Ghobadi Moghaddam-Helmantel IM, de Bruijn P, van Gelder T, Wiemer EA, Loos WJ. Quantification of tamoxifen and three of its phase-I metabolites in human plasma by liquid chromatography/triple-quadrupole mass spectrometry. J Pharm Biomed Anal. 2011; 56:1016-1023.
44. Lee SY, Sohn KM, Ryu JY, Yoon YR, Shin JG, Kim JW. Sequence-based CYP2D6 genotyping in the Korean population. Ther Drug Monit. 2006; 28:382-387.
45. Gaedigk A. Complexities of CYP2D6 gene analysis and interpretation. Int Rev Psychiatry. 2013; 25:534-553.
46. Gaedigk A, Simon SD, Pearce RE, Bradford LD, Kennedy MJ, Leeder JS. The CYP2D6 activity score: translating genotype information into a qualitative measure of phenotype. Clin Pharmacol Ther. 2008; 83:234-242.
47. Crews KR, Gaedigk A, Dunnenberger HM, Klein TE, Shen DD, Callaghan JT, Kharasch ED, Skaar TC. Clinical Pharmacogenetics Implementation Consortium (CPIC) guidelines for codeine therapy in the context of cytochrome P450 2D6 (CYP2D6) genotype. Clin Pharmacol Ther. 2012; 91:321-326.
48. Hicks JK, Swen JJ, Thorn CF, Sangkuhl K, Kharasch ED, Ellingrod VL, Skaar TC, Muller DJ, Gaedigk A, Stingl JC. Clinical Pharmacogenetics Implementation Consortium guideline for CYP2D6 and CYP2C19 genotypes and dosing of tricyclic antidepressants. Clin Pharmacol Ther. 2013; 93:402-408.