
INTRODUCTION
Gastric cancer is the second leading cause of cancer-associated death worldwide [1, 2]. Approximately 40% of all GC cases occur in China and these are often diagnosed in the advanced stages [3, 4]. The 5 year survival rate was 28% in 2014 [5]. Many factors result in the occurrence of GC, including genetic and epigenetic alterations. In spite of this, tumor suppression genes and growth factors have been discovered which affect the progression of GC [6–8], although the molecular mechanism of tumor metastasis is still poorly documented [9].
Sorcin, a soluble resistance-related calcium-binding protein, belongs to the small penta-EF-hand protein family [10, 11]. Sorcin expressed in many human tissues and at high levels in bones, heart, brain, kidneys, breasts and skin. Sorcin has been found to over expressed in many cancers such as leukemia and gastric, ovarian and breast cancers [10, 12, 13]. Although the function of sorcin in tumors is still unclear, a number of studies have shown that sorcin may associate with multidrug resistance (MDR) [12, 14–16]. Using a gene co-expressed with P-glycoproteins in multidrug-resistant cells, sorcin was shown to be resistance-related [17]. On the other hand, sorcin is related to epithelial-to-mesenchymal (EMT) transition, which contributes to cancer metastases, as in breast cancer and colorectal cancer [14, 18].
Since sorcin plays a significant role in cancer metastasis and the mechanism for this action remains elusive, the present study utilized isobaric tags for lative and absolute quantitation (iTRAQ) to identify differentially expressed proteins (DEP) in AGS and MKN-28 gastric cancer cell lines in which sorcin had been silenced via Small interfering RNA (siRNA). After verification by PT-PCR and western blot, the DEPs were further investigated in order to identify a pathway to explain the sorcin-modulated metastatic mechanism. Our data demonstrated that sorcin can induce tumor growth and metastasis via STAT3 signaling, leading to development of therapeutic treatments for GC.
RESULTS
Differential expression of sorcin in tissues
IHC was utilized to verify whether the expression of sorcin differed between tumor tissues and adjacent normal tissues. The results showed that sorcin expression was higher in tumor tissues than that in normal adjacent tissues (Figure 1A). The IHC value of sorcin in tumor tissues was significantly higher than that in normal tissues (Figure 1B). Moreover, Pearson correlation analysis showed that IHC scoring was correlated with the Grade and Stage of tumor (Table 1).
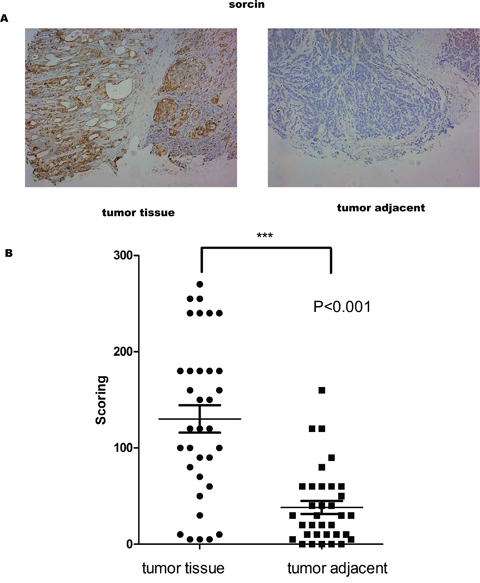
Figure 1: Sorcin levels were higher in GC tissue than in adjacent normal tissue. (A) Representative images of the immmunohistochemical analysis of Sorcin in GC tissue and matched GC adjacent normal tissue. (B) IHC score values of Sorcin are significantly higher in GC tissue compared to matched GC adjacent normal tissue. * P<0.001.
Table 1: Pearson correlation coefficients between IHC scoring, tumor grade, and tumor stage
1 |
2 |
3 |
|
|---|---|---|---|
1 IHC scoring |
1 |
||
2 Grade |
0.817** |
1 |
|
3 Stage |
0.869** |
0.92** |
1 |
*
Effect of sorcin knockdown on migration and invasion in AGS and MKN28 cell lines
In order to identify the association of sorcin with GC migration and invasion, the control siRNA and SRI siRNA (SRI siRNA1 and SRI siRNA3) were transfected into the AGS and MKN28 cell lines. Cells transfected with the SRI siRNA showed significant suppression of sorcin expression (Figure 2A). Pursuant with these results, the invasion and migration capabilities of AGS and MKN28 cells were significantly decreased after transfection with SRI siRNA (Figure 2B and 2C).
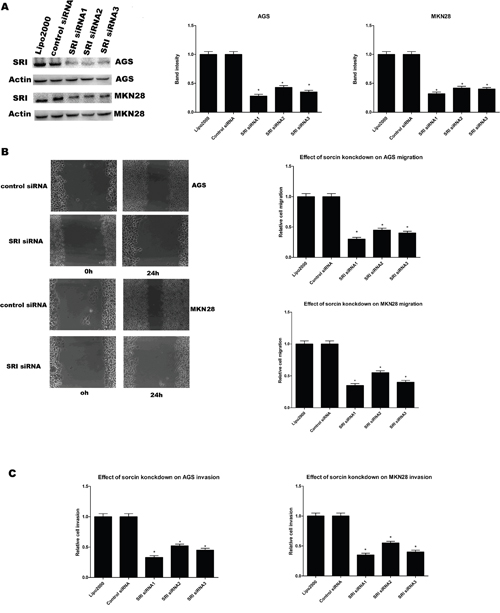
Figure 2: (A) Western blot analysis showed that three different siRNAs targeting sorcin specific siRNAs significantly reduced SRI protein levels in cell lysates, compared to control siRNA and lipo2000 and band intensity analysis. (B) Migration ability of cells in wound healing assays after sorcin knockdown. * P<0.05., Migration ability of AGS and MKN28 after silencing SRI. (C) Invasion ability of AGS and MKN28 after silencing SRI.
Analysis of iTRAQ data of differentially expressed proteins
The iTRAQ technology was used to explore the mechanism by which sorcin affects cell migration and invasion. The iTRAQ assays were performed on proteins isolated from AGS and MKN28 cells sorcin knockdown vs control cells without sorcin silencing. Specimens were labeled in duplicate to improve the confidence and enhance the range of protein identification. Table 2 shows the flow chart of the iTRAQ proteomics approach. The ratios of 114:113, 116:115, 118:117 and 121:119 identified the differential protein expression. An additional 1.3-fold change cutoff for all iTRAQ ratios (ratio <0.77 or >1.3) was used for classifying proteins as being up- or down-regulated.
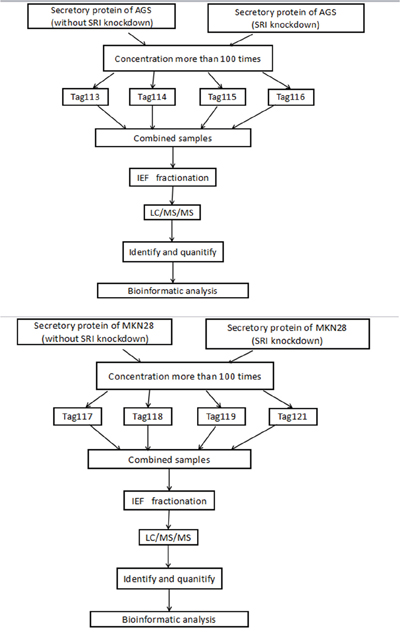
Table 2: The iTRAQ-based MS workflow
A total of 65 proteins were identified in AGS cells and 57 proteins in MKN28 cells. According to the conventions, 22 proteins were up-regulated and 43 proteins were down-regulated in the AGS line. In the MKN-28 line, 25 proteins were up-regulated and 32 were down-regulated (Table 3). To identify the cellular and molecular characteristics of these proteins, the differentially expressed proteins were classified using the PANTHER (www.pantherdb.org/) Classification System (Figure 3A and 3B). Using STRING analysis, sorcin was identified as the most important node in the DEP network because it had the greatest connectivity (Figure 3C).
Table 3: The proteins observed to be differentially expressed by iTRAQ analysis in supernatant of AGS and MKN28: SRI knockdown vs control
AGS
N |
Accession |
Name |
114:113 |
PVal 114:113 |
116:115 |
PVal 116:115 |
|---|---|---|---|---|---|---|
1 |
sp|Q9NPD8|UBE2T_HUMAN |
Ubiquitin-conjugating enzyme E2 T |
1.744066 |
0.026624629 |
1.325548983 |
0.044529971 |
2 |
tr|H6VRG1|H6VRG1_HUMAN |
Keratin 1 |
1.523257017 |
0.001 |
1.7892345 |
0.02378564 |
3 |
sp|Q14019|COTL1_HUMAN |
Coactosin-like protein |
1.486366034 |
0.003839253 |
1.9871653 |
0.00457829 |
4 |
sp|P02787|TRFE_HUMAN |
Serotransferrin |
1.47558701 |
0.001567603 |
1.79888654 |
0.00167298 |
5 |
sp|P35527|K1C9_HUMAN |
Keratin, type I cytoskeletal 9 |
1.456223011 |
0.000636358 |
1.89176432 |
0.000398717 |
6 |
tr|D3DPK5|D3DPK5_HUMAN |
SH3 domain binding glutamic protein like 3 |
1.416821957 |
0.01751755 |
1.56279981 |
0.0192865 |
7 |
sp|P60174|TPIS_HUMAN |
Triosephosphate isomerase |
1.394827962 |
0.000135839 |
1.52817629 |
0.000027817 |
8 |
sp|P62195|PRS8_HUMAN |
26S protease regulatory subunit 8 |
1.392753959 |
0.0281204 |
1.79875428 |
0.0367186 |
9 |
sp|Q5JS37|NHLC3_HUMAN |
NHL repeat-containing protein 3 |
1.388023019 |
0.045731839 |
1.591827113 |
0.0378192 |
10 |
tr|Q53FB6|Q53FB6_HUMAN |
Mitochondrial aldehyde dehydrogenase 2 variant |
1.377797961 |
0.000768409 |
1.398271918 |
0.00036182 |
11 |
sp|P04075|ALDOA_HUMAN |
Fructose-bisphosphate aldolase A |
1.372123957 |
0.00147034 |
1.679281179 |
0.0017891 |
12 |
sp|Q5T4S7|UBR4_HUMAN |
E3 ubiquitin-protein ligase UBR4 |
1.350811958 |
0.03672374 |
1.378291179 |
0.028917123 |
13 |
tr|Q6FGB3|Q6FGB3_HUMAN |
PCBD protein (Fragment) |
1.343956947 |
0.01979435 |
1.562919023 |
0.018273689 |
14 |
sp|Q9Y3C6|PPIL1_HUMAN |
Peptidyl-prolyl cis-trans isomerase-like 1 |
1.343673944 |
0.01674393 |
1.782993739 |
0.017289381 |
15 |
tr|Q5U000|Q5U000_HUMAN |
Cathepsin Z |
0.749955177 |
0.035744209 |
0.65124789 |
0.02134678 |
16 |
sp|P02647|APOA1_HUMAN |
Apolipoprotein A-I |
0.746485889 |
0.01251418 |
0.635172839 |
0.013671898 |
17 |
tr|B4DVA7|B4DVA7_HUMAN |
Beta-hexosaminidase |
0.725379229 |
0.002918514 |
0.726019284 |
0.002189322 |
18 |
sp|Q0VDF9|HSP7E_HUMAN |
Heat shock 70 kDa protein 14 |
0.725047827 |
0.037717941 |
0.6218956 |
0.031275433 |
19 |
sp|P18065|IBP2_HUMAN |
Insulin-like growth factor-binding protein 2 |
0.718883276 |
0.007395078 |
0.71452389 |
0.001789562 |
20 |
tr|G3V1C3|G3V1C3_HUMAN |
Apoptosis inhibitor 5 |
0.709504426 |
0.000174285 |
0.7219271 |
0.000342613 |
21 |
tr|Q6IBU0|Q6IBU0_HUMAN |
EIF5 protein |
0.707335413 |
0.02353386 |
0.682615293 |
0.03782919 |
22 |
sp|Q14393|GAS6_HUMAN |
Growth arrest-specific protein 6 |
0.705515504 |
0.037340712 |
0.67281927 |
0.000128913 |
23 |
sp|Q96JB5|CK5P3_HUMAN |
CDK5 regulatory subunit-associated protein 3 |
0.704363883 |
0.04963446 |
0.672918274 |
0.038291833 |
24 |
sp|P31949|S10AB_HUMAN |
Protein S100-A11 |
0.67395997 |
0.033712041 |
0.631987527 |
0.02567891 |
25 |
sp|P23396|RS3_HUMAN |
40S ribosomal protein S3 |
0.662013173 |
0.000471662 |
0.452719272 |
0.000261839 |
26 |
sp|Q9NZL4|HPBP1_HUMAN |
Hsp70-binding protein 1 |
0.600465178 |
0.000367309 |
0.52918762 |
0.000271836 |
27 |
sp|P01037|CYTN_HUMAN |
Cystatin-SN |
0.576057613 |
0.001708777 |
0.342516829 |
0.001728391 |
28 |
sp|Q9H173|SIL1_HUMAN |
Nucleotide exchange factor SIL1 |
0.574737787 |
0.0174674 |
0.328910722 |
0.001729372 |
29 |
sp|P21926|CD9_HUMAN |
CD9 antigen |
0.516185224 |
0.020510839 |
0.035617839 |
0.025618923 |
30 |
sp|P04080|CYTB_HUMAN |
Cystatin-B |
0.473518968 |
0.003953285 |
0.49178256 |
0.000267819 |
Continued MKN28
N |
Accession |
Name |
118:117 |
PVal 118:117 |
121:119 |
PVal 121:119 |
|---|---|---|---|---|---|---|
1 |
sp|P02787|TRFE_HUMAN |
Serotransferrin |
1.794528008 |
0.000295122 |
2.189219183 |
0.00028131 |
2 |
sp|Q9UNN8|EPCR_HUMAN |
Endothelial protein C receptor |
1.662192941 |
0.025397651 |
1.927371831 |
0.023618391 |
3 |
sp|Q14558|KPRA_HUMAN |
Phosphoribosyl pyrophosphate synthase-associated protein 1 |
1.648730993 |
0.02934215 |
1.789276184 |
0.037826173 |
4 |
sp|Q9HAV7|GRPE1_HUMAN |
GrpE protein homolog 1, mitochondrial |
1.476071954 |
0.02040467 |
1.789261312 |
0.018927193 |
5 |
sp|P28070|PSB4_HUMAN |
Proteasome subunit beta type-4 |
1.468814969 |
0.003261048 |
1.567289184 |
0.004527192 |
6 |
sp|P28070|PSB4_HUMAN |
Proteasome subunit beta type-4 |
1.468814969 |
0.003261048 |
1.898976558 |
0.004261839 |
7 |
sp|O75153|CLU_HUMAN |
Clustered mitochondria protein homolog |
1.453933954 |
0.00138173 |
1.356183992 |
0.00017282 |
8 |
tr|Q6FHK7|Q6FHK7_HUMAN |
PSME3 protein |
1.446910977 |
0.007649424 |
1.888927368 |
0.001839104 |
9 |
sp|P46926|GNPI1_HUMAN |
Glucosamine-6-phosphate isomerase 1 |
1.442389965 |
0.0117149 |
1.666618829 |
0.000271893 |
10 |
tr|I3L504|I3L504_HUMAN |
Eukaryotic translation initiation factor 5A-1 |
1.413321972 |
0.001034902 |
1.789379381 |
0.002781939 |
11 |
tr|Q32Q12|Q32Q12_HUMAN |
Nucleoside diphosphate kinase |
1.385175943 |
0.02030622 |
1.89283901 |
0.018293134 |
12 |
tr|Q59FD4|Q59FD4_HUMAN |
Hexokinase 1 isoform HKI variant |
1.377347946 |
0.002164863 |
1.478290002 |
0.001830019 |
13 |
tr|Q6IPT9|Q6IPT9_HUMAN |
Elongation factor 1-alpha |
1.374544978 |
0.001090406 |
1.7829381 |
0.001782018 |
14 |
tr|B7Z6Q5|B7Z6Q5_HUMAN |
Beta-galactosidase |
0.713971794 |
0.01131486 |
0.34152719 |
0.027816291 |
15 |
sp|Q96AY3|FKB10_HUMAN |
Peptidyl-prolyl cis-trans isomerase FKBP10 |
0.642570615 |
0.036040939 |
0.582981739 |
0.028917362 |
16 |
sp|Q06828|FMOD_HUMAN |
Fibromodulin |
0.640408993 |
0.00128549 |
0.527819371 |
0.003281903 |
17 |
sp|O00339|MATN2_HUMAN |
Matrilin-2 |
0.633856475 |
0.003664825 |
0.608972562 |
0.00278183 |
18 |
sp|P36955|PEDF_HUMAN |
Pigment epithelium-derived factor |
0.62459141 |
0.032367039 |
0.592817293 |
0.034527189 |
19 |
sp|Q92930|RAB8B_HUMAN |
Ras-related protein Rab-8B |
0.623568416 |
0.017293719 |
0.672910381 |
0.019287301 |
20 |
sp|P16035|TIMP2_HUMAN |
Metalloproteinase inhibitor 2 |
0.617994773 |
0.00642046 |
0.72341819 |
0.007189201 |
21 |
sp|P05121|PAI1_HUMAN |
Plasminogen activator inhibitor 1 |
0.61286068 |
0.046489481 |
0.626152901 |
0.056289129 |
22 |
tr|D3DQH8|D3DQH8_HUMAN |
SPARC |
0.597940624 |
0.000163077 |
0.462791023 |
0.000179038 |
23 |
tr|Q1L857|Q1L857_HUMAN |
Ceruloplasmin |
0.59214592 |
0.003437676 |
0.415272801 |
0.002619939 |
24 |
tr|J3KPA4|J3KPA4_HUMAN |
Vascular endothelial growth factor A |
0.587758303 |
0.03545526 |
0.362891004 |
0.027810381 |
25 |
tr|Q5U000|Q5U000_HUMAN |
Cathepsin Z O |
0.578644204 |
0.026196879 |
0.26783619 |
0.002819381 |
26 |
sp|P22692|IBP4_HUMAN |
Insulin-like growth factor-binding protein 4 |
0.57805872 |
0.01133533 |
0.703739491 |
0.022367192 |
27 |
tr|E7EV71|E7EV71_HUMAN |
Latent-transforming growth factor beta-binding protein 1 |
0.531398475 |
0.006499027 |
0.462739103 |
0.006728913 |
28 |
sp|P13645|K1C10_HUMAN |
Keratin, type I cytoskeletal 10 |
0.512651515 |
0.01043807 |
0.537280182 |
0.003781928 |
29 |
tr|C9J0K6|C9J0K6_HUMAN |
Sorcin |
0.43533988 |
0.048046826 |
0.50781692 |
0.03681903 |
30 |
sp|Q9NZL4|HPBP1_HUMAN |
Hsp70-binding protein 1 |
0.314401984 |
0.045458108 |
0.452719301 |
0.035279103 |
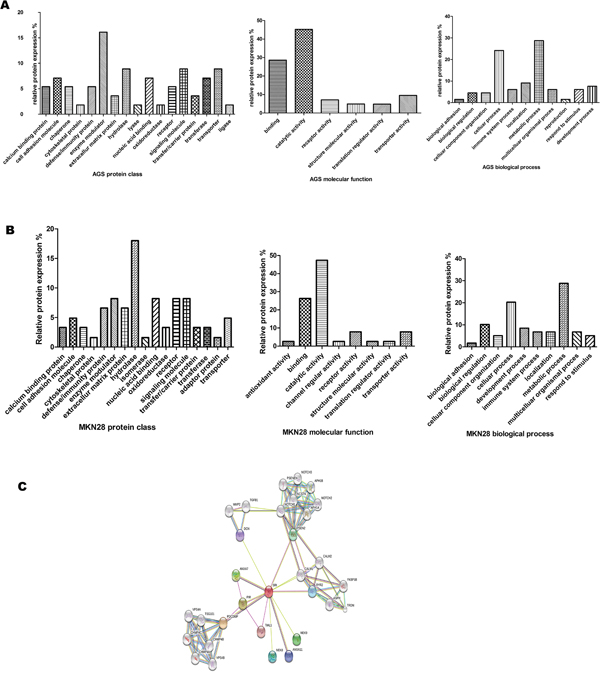
Figure 3: PANTHER analysis of proteins differentially expressed in GC cells. (A) AGS Proteins were categorized by protein class, biological process, and molecular function. (B) MKN28 Proteins were categorized by protein class, biological process, and molecular function. (C) STRING analysis.
Validation of iTRAQ identified candidate proteins
PT-PCR and western blot were used to confirm the changes in the selected proteins. mRNA expression of UBE2T, CTSZ, HSPBP1, S100A11, CSTB, MMP1 and RAC1 were in line with the iTRAQ resultsin AGS cells. In the MKN-28 cell line, mRNA expression of UBE2T, CTSZ, HSPBP1, KRT1, TIMP2, VEGFA and IBP4 were similar to the iTRAQ results. After silencing of sorcin, the mRNA expression of UBE2T was significantly up-regulated compared with 18s, while the mRNA expression of the other identified proteins was down-regulated (Figure 4). Western blot analysis was utilized to quantify the expression levels of the selected proteins (Figure 5A and 5B). The results of CTSZ and HSPBP1 are consistent to the iTRAQ data.
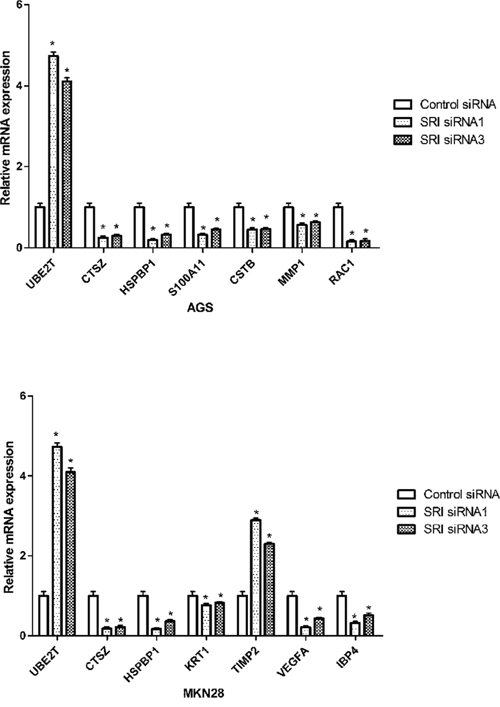
Figure 4: Validation of differentially expressed proteins in mRNA level. RT-PCR detected the relative mRNA expression levels of some DEPs in the sorcin knockdown group compared with untreated (no knockdown) group.
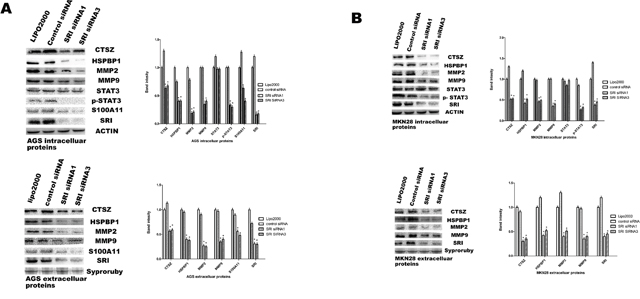
Figure 5: Validation of differentially expressed proteins in protein level. Western blot analysis of CTSZ, HSPBP1, STAT3, p-STAT3, MMP9 and MMP2. (A) Protein levels from AGS cells transfected with SRI-specific or control siRNAs were analyzed by western blot analysis. Band intensity analysis shows significant reduction of p-STAT3, MMP9, and MMP2 after sorcin silencing (* P<0.05). (B) Protein levels from MKN28 cells transfected with SRI-specific or control siRNAs were analyzed by western blot analysis. Band intensity analysis shows significant reduction of p-STAT3, MMP9, and MMP2 after sorcin silencing (* P<0.05).
Knockdown of sorcin suppresses p-STAT3, MMP9 and MMP2 protein expression. Many studies have reported that the overexpression of p-STAT3, MMP2 and MMP9 promotes metastasis. We detected the expression of these proteins in both silenced and untreated cells. The results demonstrated that the down regulation of sorcin inhibits p-STAT3, MMP2, MMP9 expression at the protein level in AGS and MKN28 cells (p<0.05) (Figure 5A and 5B).
Sorcin plays a role in proliferation and cell cycle
AGS and MKN28 cells were transfected with sorcin siRNA sequences. According to the western blot analysis, efficient silencing of sorcin expression was demonstrated by the sorcin-specific siRNA sequences. We also used the MTT assay to examine the proliferation of sorcin-silenced vs control AGS cells and MKN-28 cells. The proliferation of AGS and MKN28 cells was depressed compared to the control cells. We examined the change of the cell cycle and the results showed a difference in the cycles of sorcin-silenced cells compared with untreated cells (Figure 6A and 6B).
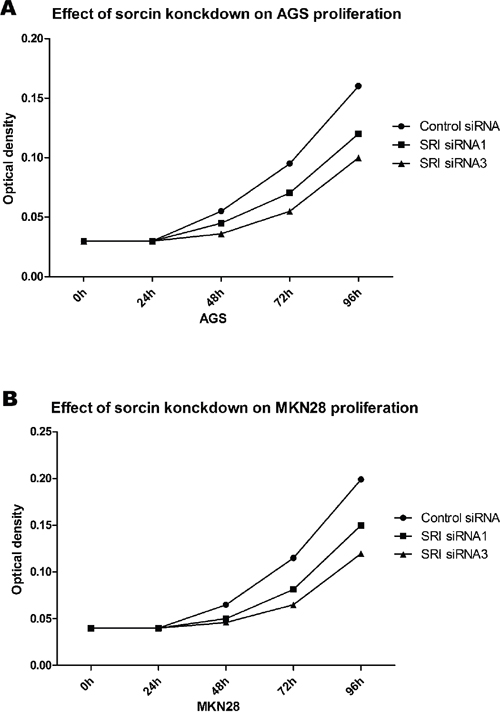
Figure 6: GC proliferation after knockdown of SRI. (A) Proliferation was significant inhibit in cell transfected with SRI- specific siRNA in AGS (* P<0.05). (B) Proliferation was significant inhibit in cell transfected with SRI- specific siRNA in MKN28 (* P<0.05).
DISCUSSION
Gastric cancer has high mortality and mobility rate and is the third leading cause of cancer deaths [19, 20]. Surgery and chemotherapy are the prime treatment for curing the malignancy [8, 20]. According to official statistics, about 50% of GC cases suffer metastases at diagnosis [21]. The 5-year survival rate is greatly decreased in patients with metastases compared with patients diagnosed early in the progression [20]. Therefore, it is urgent to explore the molecular mechanisms underlying the progression of GC, which could identify biomarkers or treatments for GC.
Sorcin is over expressed in many malignant tumors. In the present study, the iTRAQ method was utilized to compare protein expression in GC tumor tissue and compare them with expression from adjacent tissues. As previously reported, sorcin plays a vital role in invasion and migration of tumors, also has an influence on tumor proliferation.
Some of DEPs identified by the iTRAQ results were attributed to cellular processes. CTSZ, HspBp1, S100A11, CTSB, UBET2E, KRT1, MMP1, Rac1 and VEGFA were selected as candidate proteins, and PT-PCR and western blot analyses were used to validate the iTRAQ results. To identify the major changes after suppressing sorcin, we classified these proteins into different categories according to their biological process and molecular functions.
CTSZ is considered a lysosomal proteolytic enzyme and is a member of the peptide C1 family associated with many biological processes, including immune response, cell adhesion and proliferation [22]. CTSZ is over expressed in many cancers [23, 24]. CTSZ belongs to the cathepsin family of lysosomal hydrolases that contribute to the turnover of intra cellular proteins and the degradation of extracellular matrix [25]. Interestingly, several of the tumor-promoting functions of CTSZ were not dependent on its described catalytic activity [26]. Several proteases have been shown to mediate adhesion and migration of cells through interaction with integrins [27]. CTSZ contains an Arg-Gly-Asp (RGD) motif allows it to interact with integrins [26, 28]. RGD is a protein sequence vital to the binding of proteins to cell surface [29], which mediates cell adhesive properties, and this region interacts with the integrin αvb3 [30]. This interaction influences cellular migration as well as cell adhesion [30, 31]. Many studies have shown that CTSZ is related with the EMT, which could promote invasion and migration in tumor [32]. The extracellular matrix (EMT) plays an important role in modulating cell behavior, including cell survival and metastasis [33].
MMPs, a group of zinc-dependent endopeptidases, are involved in degradation of the ECM. MMP2 and MMP9 contribute to tumor metastasis [34–36]. Studies have reported signal transducer and activator of transcription 3 (STAT3) is active in many cancers [37–41]. In the present study, we found that silencing sorcin was related to metastatic activity in tumor cells. Therefore, we suspect that sorcin may be associated with the STAT3 pathway. We found that p-STAT3, MMP2, MMP9 were suppressed after silencing sorcin in GC cell lines. Taken together, these findings suggest that sorcin contribute to STAT3 activation.
In conclusion, our findings indicated that silencing sorcin affects the development of GC cells, by reducing the capacity for invasion, migration and proliferation via CTSZ and the STAT3 pathway. Therefore, suppressing the expression of the sorcin may lead to therapeutic treatments for GC.
MATERIALS AND METHODS
Cell lines
The two human gastric cancer lines AGS and MKN28 were obtained from ATCC, and grown in high glucose DMEM with 10% fetal bovine serum (FBS Corning), augmented with 1% penicillin and streptomycin. Cells were maintained in an incubator in an atmosphere of 5% carbon dioxide at 37°C.
Reagents
The eight-plex iTRAQ kits were acquired from Applied Biosystems (Foster City, CA, USA). Bio-Rad (Hercules, CA, USA) provided all electrophoresis reagents. CytoSelect™ 24-well Cell Migration and Invasion assay kits (8 μm, colorimetric format) were purchased from Cell Biolabs (San Diego, CA, USA). Opti-MEM was acquired from Gibco (San Diego, CA, USA). SRI specific siRNA (HSS110179, HSS110180, HS110181) and Lipofectamine 2000 were purchased from Invitrogen (Carlsbad, CA, USA). Sorcin, CTSZ, Hspbp1 and CSTB antibody were obtained from OriGene (Rockville, MD, USA). The S100A11 antibody used in this study was purchased from Abcam (Cambridge, MA, USA).
Sample collection and ITRAQ labeling
Cells were grown to 80% confluence, washed two times with PBS and incubated in DMEM for 24h. The supernatant containing secreted proteins was collected and filtered using a 0.22 mm filter (Millipore, Bedford, MA, USA) and concentrated by centrifugation with an Amican centrifugal filter (Billerica, MA, USA). The protein concentration was measured using a 2D Quant kit. For each sample, 100 ug of protein was precipitated overnight, re-dissolved in lysis buffer, and cysteine-blocked in accordance with the manufacturer’s instructions. Th protein samples were then labeled with the iTRAQ tags. The secretory protein samples from AGS without sorcin knockdown were labeled with tag 113 and tag 115. The secretory proteins from AGS cells with sorcin-silencing were labeled with tag 114 and tag 116. The secretory proteins from MKN-28 cells without sorcin knockdown were labeled with tags 117 and 119 and the secretory proteins from sorcin-silenced MKN-28 cells were labeled with tags 118 and 121.
Fractionation of pepitides
The pooled iTRAQ labeled samples were dissolved in 300uL 1% Pharmalyte (Amersham Biosciences) and 8M urea and evenly coated on pre-hydrated IPG strips (pH 3-8). The peptides were isolectrically focused successively for 1h at 500v, 1h at 1000v, 1h at 3000v, and 8.5h at 8000v to give a total of 68kv in an IPGphor system (Amersham Biosciences). The peptides were extracted using an acetonitrile (ACN) and formic acid solution. Fractions were lyophilized in a vacuum concentrator and purified on an SPE C18 column. The purified fractions were re-lyophilized and stored in -20°C for use in mass spectrometric analysis.
Mass spectrometry
The purified, labeled peptides were reconstituted in Buffer A (2% ACN; 0.1% formic acid) and injected into the nano LC ESI MS/MS system. Mass spectrometry was performed using a Qstar Elite mass spectrometer coupled to a Dionex Ultimate 3000 liquid chromatography system. A gradient series for each analysis was loaded on C-18 pepMap column at a flow rate of 0.3ul/min. The mass spectrometer was set to perform data acquisition in the positive ion mode, with a selected mass range of 300-1800 m/z. The two most abundantly charged ions above 20 counts were selected for MS/MS. Dynamic exclusion criteria was set to 30s with a ± 50 Da mass tolerance.
Protein Pilot software (version 2.0 applied biosystems, MDS Sciex) was used for the identification and qualification of proteins, with the search being carried out against the International Protein Index (IPI) human database (version 3.77).
Immunohistochemistry and tissue Microarray IHC assessment of sorcin was performed using a commercial tissue microarray (Biomax, Rockville, MD, USA) containing 40 GC samples and 40 matched GC adjacent normal tissue. Immunohistochemistry was performed on the tissue microarrays as previously described [42]. The tissue samples were dewaxed with xylene and rehydrated using an alcohol gradient. The samples were washed three times in double distilled H2O (5 min per wash) and subjected to heat-induced antigen retrieval in a 0.1 M citrate solution for 5 minutes. Endogenous peroxidase activity in the samples was quenched by incubation in 3% H2O2. The sections were blocked with BSA for 0.5h and incubated with anti-sorcin antibody overnight at 4°C. Detection was performed on an Envision/horseradish peroxidase system (DakoCytomation, Glostrup, Denmark) and all slides were counterstained with Gill hematoxylin for examination. Protein expression was evaluated by recording staining intensity (scale 0-3) and the percentage of positive cells (0-100%). Multiplying these scores yielded a value of 0-300. All data analyses were performed with SPSS v.16.0 software (SPSS, Chicago, IL, USA) using the student the t-test with 95% confidence levels.
Sorcin siRNA transfection, wound healing, cell migration and invasion assays
AGS and MKN28 cells were transfected with 50nm of sorcin specific Stealth Selected RNAi siRNA (HSS) or a negative control siRNA using Lipofactamin 2000, according to the manufacturers protocol (Life Technologies, Carlsbad, CA, USA). The cells were cultured in serum-free, high-glucose DMEM with free serum for 2 days in 6-well plates. When the cells became confluent, a scratch was made in the monolayer with a sterile P200 pipette tip. The cells were washed twice with PBS to remove debris and the wound channel was photographed under a phase-contrast microscope at 0h and 24h for comparison. Adobe Photoshop 7.0 was used to measure the relative width of the wound, and cell migration was determined by the ability of the cells to close the scratch area. Migration and invasion assays was performed using Cell Invasion Assay kits (Cell Biolabs, Inc., Beijing China). AGS and MKN28 cells were transfected with negative siRNA or sorcin-targeting siRNA and cultured in free serum media. Approximately 3*105/300ul cells were seeded into the upper chambers of the Transwell chambers, and 500ul media was loaded into the lower chamber. The migration assay cells were cultured for 12h, while the invasion assay cells were cultured for 24h. The non-invasive cells were gently removed with cotton and the invading cells were stained, fixed, extracted and quantified with cyQuant GR fluorescent dye at 560 nm. The knockdown of sorcin protein expression was confirmed by western blot.
RNA extraction and quantitative PT-RCR
Total RNA was extracted using TRIZOL Regent (Gibico-BRL, Gaithersburg, MD, USA), according to the manufacturer’s protocol. First-strand cDNA was synthesized from 2ug of total RNA using a Reverse Transcription kit (Thermo Fisher Scientific, Waltham, MA, USA). A Fast PCR kit (KAPA SYBR, MA, USA) was used to perform PT-PCR using primers for UBE2T (Hs00311058_CE), CTSZ (Hs00216567_CE), HSPBP1 (Hs00358592_CE), S100A11 (Hs00273948_CE), CSTB (Hs00220803_CE), MMP1 (Hs00111380_CE), RAC1 (Hs00368991_CE), KRT1 (Hs00444496_CE), TIMP2 (Hs00171270_CE), VEGFA (Hs00275352_CE) and IBP4 (Hs00398644_CE) (Table 4). Quantification of gene expression was calculated using the 2-ΔΔCTmethod. RT-PCR analyses were conducted in triplicate.
Table 4: The sequence of genes specific primers as followed
Gene |
Primer sequence |
Gene |
Primer sequence |
|---|---|---|---|
UBE2T |
F 5-TGCGAGCTCGTAGAAATATT-3 |
CTSZ |
F 5-CGGCCTCATGAGTACCTGTC-3 |
R 5-TTGAGGGATGGTCTCCAAGC-3 |
R 5-GCAGTATTGGGGGATGTGCT-3 |
||
HSPBP1 |
F 5-CCTCTTCGCCATCTCCTGTC-3 |
S100A11 |
F 5-CTATGGCTTGCCATGACTCCT-3 |
R 5-TCAACACAGAGAAGCCGTCC-3 |
R 5-TACAAGAAAGTTGGGCAGGTCC-3 |
||
CSTB |
F 5-TCCCTGTGTTTAAGGCCGTG-3 |
MMP1 |
F 5-GCGAGCCCTCCTTTATCTCC-3 |
R 5-ACACTCGCAGGTGTACGAAG-3 |
R 5-AGGGTCTAAAACGCCAGTCG-3 |
||
RAC1 |
F 5-AGGCAAACGCCCATTGGATA-3 |
KRT1 |
F 5-GGTGTCAAGTCCTCTGGTGG-3 |
R 5-ACTGCGGTCACTTACCTTGG-3 |
R 5-ACAAGAAAGTTGGGTATCTGGT-3 |
||
TIMP2 |
F 5-TCAAGAGAAGTGACGGCTCC-3 |
VEGFA |
F 5-TGCGGATCAAACCTCACCAA-3 |
R 5-ACAAGAAAGTTGGGTATGGGTCC-3 |
R 5-CAAGAAAGTATGGGCACCGC-3 |
||
IBP4 |
F 5-CAAGTGCTGGTGTGTGGACC-3 |
||
R 5-AAGAAAGTTGGGCACTCTCGAA-3 |
Western blot analysis
Cells were lysed with lysis buffer and the concentration of the proteins was determined by a 2D Quantification kit (GE Healthcare). The proteins were separated by 12% SDS-PAGE and transfected to PVDF membranes. The membranes were blocked in BSA for 1h at room temperature, and incubated with the primary antibody (1:500 dilution) overnight at 4°C. The membranes were washed three times and incubated with HRP-conjugated secondary antibody (1:10000). The membranes were washed thrice with TBST and visualized with the ChemiDoc MP imaging system (BioRad Laboratories, Hercules, CA, USA).
Cell proliferation assay
AGS and MKN28 cells were seeded in 96-well plates at a density of 1.5x10³ cells/well. Cells were cultured in DMEM with 10% FBS and transfected with SRI siRNA or control siRNA for 0, 24, 48, 72 and 96 h at 37°C. The MTT assay was performed as follows: cells were incubated with 20 μl MTT (Sigma-Aldrich, St Louis, USA) at 37°C for 4 h. The MTT substrate was then dissolved in 200 μl of DMSO (Sigma-Aldrich, St Louis, USA) for 5 min. The absorbance was measured at 570 nm.
Statistical analysis
All experiments were performed in triplicate and the data are expresses as the mean ± standard deviation. The Student’s t-test was used to analysis the variables between two groups. Differences were considered significant when p<0.05.
Author contributions
Huan Tuo and Feng Shu: performed all experiments. Sha She, Min Yang, Xiao Qin Zou, Juan Huang performed some experiments. Hong Ren, Huai Dong Hu and Peng Hu gave some critical suggestions to this project. Huan Tuo and Feng Shu analyzed data and wrote the manuscript. Shi Fang Peng Yi Huan Yang did conception and design and final approval of manuscript. Yi Xuan Yang made financial support, and final approval of manuscript.
CONFLICTS OF INTEREST
The authors declare that no conflicts of interest exist.
FUNDING
This study was supported by the National Natural Science Foundation of China (81171560, 30930082, 81171561, 30972584 and 81372399) and the National Science and Technology Major Project of China (2008ZX10002-006, 2012ZX1002007001, 2011ZX09302005, 2012ZX09303001001 and 2012ZX10002003).
REFERENCES
1. Chen ZF, Huang ZM, Xue HB, Lin XQ, Chen RP, Chen MJ, Jin RF. REG3A promotes the proliferation, migration, and invasion of gastric cancer cells. Onco Targets Ther. 2017; 10:2017-2023.
2. Zhu ML, Lu JX, Pan GP, Ping S, Zhao FR, Qi HT, Yu HY, Jian X, Wan GR, Li P. Traditional chinese medicine Ka-Sai-Ping suppresses the growths of gastric cancers via induction of autophagy. Oncotarget. 2017. https://doi.org/10.18632/oncotarget.18041.
3. Wu N, Huang Y, Zou Z, Gimenez-Capitan A, Yu L, Hu W, Zhu L, Sun X, Sanchez JJ, Guan W, Liu B, Rosell R, Wei J. High BIM mRNA levels are associated with longer survival in advanced gastric cancer. Oncol Lett. 2017; 13:1826-1834.
4. Yin K, Wang L, Zhang X, He Z, Xia Y, Xu J, Wei S, Li B, Li Z, Sun G, Li Q, Xu H, Xu Z. Netrin-1 promotes gastric cancer cell proliferation and invasionvia the receptor neogenin through PI3K/AKT signaling pathway. Oncotarget. 2017; 8:51177-51189. https://doi.org/10.18632/oncotarget.17750.
5. Liu J, Chen S, Geng Q, Liu X, Kong P, Zhan Y, Xu D. Prognostic value of pretreatment albumin-globulin ratio in predicting long-term mortality in gastric cancer patients who underwent D2 resection. Onco Targets Ther. 2017; 10:2155-2162.
6. Ni J, Yang Y, Liu D, Sun H, Jin S, Li J. MicroRNA-429 inhibits gastric cancer migration and invasion through the downregulation of specificity protein 1. Oncol Lett. 2017; 13:3845-3849.
7. Yao Y, Ni Y, Zhang J, Wang H, Shao S. The role of Notch signaling in gastric carcinoma: molecular pathogenesis and novel therapeutic targets. Oncotarget. 2017; 8:53839-53853. https://doi.org/10.18632/oncotarget.17809.
8. Wang P, Wang L, Sha J, Lou G, Lu N, Hang B, Mao JH, Zou X. Expression and transcriptional regulation of human ATP6V1A gene in gastric cancers. Sci Rep. 2017; 7:3015.
9. Liu Z, Chen Z, Fan R, Jiang B, Chen X, Chen Q, Nie F, Lu K, Sun M. Over-expressed long noncoding RNA HOXA11-AS promotes cell cycle progression and metastasis in gastric cancer. Mol Cancer. 2017; 16:82.
10. Colotti G, Poser E, Fiorillo A, Genovese I, Chiarini V, Ilari A. Sorcin, a calcium binding protein involved in the multidrug resistance mechanisms in cancer cells. Molecules. 2014; 19:13976-13989.
11. Kim SI, Lee HJ, Kim SS, Kwon YS, Chun W. Sequestration of sorcin by aberrant forms of tau results in the defective calcium homeostasis. Korean J Physiol Pharmacol. 2016; 20:387-397.
12. Gong Z, Sun P, Chu H, Zhu H, Sun D, Chen J. Overexpression of sorcin in multidrug-resistant human breast cancer. Oncol Lett. 2014; 8:2393-2398.
13. Ilari A, Fiorillo A, Poser E, Lalioti VS, Sundell GN, Ivarsson Y, Genovese I, Colotti G. Structural basis of Sorcin-mediated calcium-dependent signal transduction. Sci Rep. 2015; 5:16828.
14. Tong W, Sun D, Wang Q, Suo J. Sorcin enhances metastasis and promotes epithelial-to-mesenchymal transition of colorectal cancer. Cell Biochem Biophys. 2015; 72:453-459.
15. Xu P, Jiang YF, Wang JH. shRNA-mediated silencing of sorcin increases drug chemosensitivity in myeloma KM3/DDP andU266/ADM cell lines. Int J Clin Exp Pathol. 2015; 8:2300-2310.
16. Zhu Y, Zhu L, Lu L, Zhang L, Zhang G, Wang Q, Yang P. Role and mechanism of the alkyl glycerone phosphate synthase in suppressing the invasion potential of human glioma and hepatic carcinoma cells in vitro. Oncol Rep. 2014; 32:431-436.
17. Van der Bliek AM, Meyers MB, Biedler JL, Hes E, Borst P. A 22-kd protein (sorcin/V19) encoded by an amplified gene in multidrug-resistant cells, is homologous to the calcium-binding light chain of calpain. EMBO J. 1986; 5:3201-3208.
18. Hu Y, Li S, Yang M, Yan C, Fan D, Zhou Y, Zhang Y, Yagüe E, Xiong D. Sorcin silencing inhibits epithelial-to-mesenchymal transition and suppresses breast cancer metastasis in vivo Sorcin silencing inhibits epithelial-to-mesenchymal transition and suppresses breast cancer metastasis in vivo. Breast Cancer Res Treat. 2014; 143:287-299.
19. Russo A, Strong VE. Minimally invasive surgery for gastric cancer in USA: current status and future perspectives. Transl Gastroenterol Hepatol. 2017; 2:38.
20. Ran X, Xu X, Yang Y, She S, Yang M, Li S, Peng H, Ding X, Hu H, Hu P, Zhang D, Ren H, Wu L, Zeng W. A quantitative proteomics study on olfactomedin 4 in the development of gastric cancer. Int J Oncol. 2015; 47:1932-1944.
21. Shi J, Chen P, Sun J, Song Y, Ma B, Gao P, Chen X, Wang Z. MicroRNA-1258: An invasion and metastasis regulator that targets heparanase in gastric cancer. Oncol Lett. 2017; 13:3739-3745.
22. Pečar Fonović U, Kos J. Cathepsin X cleaves profilin 1 C-terminal Tyr139 and influences clathrin-mediated endocytosis. PLoS One. 2015; 10:e0137217.
23. Bak HJ, Kim MS, Kim NY, Go HJ, Han JW, In Jo H, Ahn SJ, Park NG, Chung JK, Lee HH. Molecular cloning, expression, and enzymatic analysis of cathepsin X from starfish (Asterina pectinifera). Appl Biochem Biotechnol. 2013; 169:847-861.
24. Kraus S, Fruth M, Bunsen T, Nägler DK. IGF-I receptor phosphorylation is impaired in cathepsin X-deficient prostate cancer cells. Biol Chem. 2012; 393:1457-1462.
25. Cooke GS, Campbell SJ, Bennett S, Lienhardt C, McAdam KP, Sirugo G, Sow O, Gustafson P, Mwangulu F, van Helden P, Fine P, Hoal EG, Hill AV. Mapping of a novel susceptibility locus suggests a role for MC3R and CTSZ in human tuberculosis. Am J Respir Crit Care Med. 2008; 178:203-207.
26. Završnik J, Butinar M, Prebanda MT, Krajnc A, Vidmar R, FonoviÄ M, Grubb A, Turk V, Turk B, Vasiljeva O. Cystatin C deficiency suppresses tumor growth in a breast cancer model through decreased proliferation of tumor cells. Oncotarget. 2017; 8:73793-73809. https://doi.org/10.18632/oncotarget.17379.
27. Bühler A, Berger S, Bengsch F, Martin G, Han H, Vierkotten S, Pielen A, Boehringer D, Schlunck G, Fauser S, Agostini HT, Reinheckel T, Stahl A. Cathepsin proteases promote angiogenic sprouting and laser-induced choroidal neovascularisation in mice. Exp Eye Res. 2013; 115:73-78.
28. Ruan H, Hao S, Young P, Zhang H. Targeting cathepsin B for cancer therapies. Horiz Cancer. 2015; 56:23-40.
29. Seton-Rogers S. Microenvironment: source influences function. Nat Rev Cancer. 2014; 14:704-705.
30. Akkari L, Gocheva V, Kester JC, Hunter KE, Quick ML, Sevenich L, Wang HW, Peters C, Tang LH, Klimstra DS, Reinheckel T, Joyce JA. Distinct functions of macrophage-derived and cancer cell-derived cathepsin Z combine to promote tumor malignancy via interactions with the extracellular matrix. Genes Dev. 2014; 28:2134-2150.
31. Allan ER, Campden RI, Ewanchuk BW, Tailor P, Balce DR, McKenna NT, Greene CJ, Warren AL, Reinheckel T, Yates RM. A role for cathepsin Z in neuroinflammation provides mechanistic support for an epigenetic risk factor in multiple sclerosis. J Neuroinflammation. 2017; 14:103.
32. Jevnikar Z, Obermajer N, Bogyo M, Kos J. The role of cathepsin X in the migration and invasiveness of T lymphocytes. J Cell Sci. 2008; 121:2652-2661.
33. Staudt ND, Aicher WK, Kalbacher H, Stevanovic S, Carmona AK, Bogyo M, Klein G. Cathepsin X is secreted by human osteoblasts, digests CXCL-12 and impairs adhesion of hematopoietic stem and progenitor cells to osteoblasts. Haematologica. 2010; 95:1452-1460.
34. Wang J, Chen L, Li Y, Guan XY. Overexpression of cathepsin Z contributes to tumor metastasis by inducing epithelial-mesenchymal transition in hepatocellular carcinoma. PLoS One. 2011; 6:e24967.
35. Bernhardt A, Kuester D, Roessner A, Reinheckel T, Krueger S. Cathepsin X-deficient gastric epithelial cells in co-culture with macrophages: characterization of cytokine response and migration capability after Helicobacter pylori infection. J Biol Chem. 2010; 285:33691-33700.
36. Biswas SK, Allavena P, Mantovani A. Tumor-associated macrophages: functional diversity, clinical significance, and open questions. Semin Immunopathol. 2013; 35:585-600.
37. Kundu P, Mukhopadhyay AK, Patra R, Banerjee A, Berg DE, Swarnakar S. Cag Pathogenicity island-independent up-regulation of matrix metalloproteinases-9 and -2 secretion and expression in mice by Helicobacter pylori infection. J Biol Chem. 2006; 281:34651-34662.
38. Krueger S, Bernhardt A, Kalinski T, Baldensperger M, Zeh M, Teller A, Adolf D, Reinheckel T, Roessner A, Kuester D. Induction of premalignant host responses by cathepsin x/z-deficiency in Helicobacter pylori-infected mice. PLoS One. 2013; 8:e70242.
39. Shen YG, Feng W, Xu YJ, Jiao NN, Sun DQ, Qu WD, Tang Q, Xiong W, Tang Y, Xia Y, Cai QY, Liu DX, Zhang X, et al. Effects of RNA silencing of matrix metalloproteinase-2 on the growth of esophageal carcinoma cells in vivo. Oncol Lett. 2017; 13:1119-1124.
40. Zhong W, Tong Y, Li Y, Yuan J, Hu S, Hu T, Song G. Mesenchymal stem cells in inflammatory microenvironment potently promote metastatic growth of cholangiocarcinoma via activating Akt/NF-κB signaling by paracrine CCL5. Oncotarget. 2017; 8:73693-73704. https://doi.org/10.18632/oncotarget.17793.
41. Sun XF, Shao YB, Liu MG, Chen Q, Liu ZJ, Xu B, Luo SX, Liu H. High-concentration glucose enhances invasion in invasive ductal breast carcinoma by promoting Glut1/MMP2/MMP9 axis expression. Oncol Lett. 2017; 13:2989-2995.
42. Liao XH, Xiang Y, Yu CX, Li JP, Li H, Nie Q, Hu P, Zhou J, Zhang TC. STAT3 is required for MiR-17-5p-mediated sensitization to chemotherapy-induced apoptosis in breast cancer cells. Oncotarget. 2017; 8:15763-15774. https://doi.org/10.18632/oncotarget.15000.