
INTRODUCTION
Muscle fibers account for 75~90% of the muscle and are main factors that influence the characteristics of the muscle [1]. The major muscle fibers in mammals can be roughly divided into slow and fast-twitch fibers, and further classified into type I, type IIa, type IIx, and type IIb in limb and trunk muscles. Notably, other muscles such as ocular and jaw muscles contain specialized muscle fibers other than these four fibers [2]. It is difficult to clearly distinguish the muscle fibers (I, IIa, IIx, and IIb). However, immunohistochemical studies have shown that the four muscle fibers (type I, IIa, IIx, and IIb) mainly contain myosin heavy chain (MyHC) I, IIa, IIx, and IIb, respectively. MyHC1, IIa, IIx, and IIb are encoded by genes Myh7, Myh2, Myh1, and Myh4, respectively [3]. Type I fibers (slow-twitch, oxidative) contain greater mitochondria and predominately oxidative enzymes, and metabolize lipids as a source of energy. Type IIb fibers (fast-twitch, glycolytic) are predominantly glycolytic and use glycogen and glucose as fuel, and type IIa (fast-twitch, oxidative) and type IIx (fast-twitch, oxido-glycolytic) are intermediate to type I and IIb fibers [4, 5]. In animals, muscle fiber type profile is one of major factors affecting lots of the peri- and post-mortal biochemical processes and hence meat quality [1]. In humans, muscle fiber type is strongly associated with muscle health and overall well-being [6]. For reasons stated above, the regulation of muscle fiber type is of uppermost interest not only in the conversion of animal muscle to meat, but also in molecular medicine for potential therapeutic perspectives.
Adult skeletal muscle shows plasticity and can undergo conversion between different fiber types in response to a myriad of external stimuli [4, 7, 8]. Nutrition has sparked substantial interests as an external stimuli [9–12]. There is a large body of literature supporting nutritional control of the muscle fiber type. For example, a high-protein diet (30%) preserved fiber type distribution, preventing switch from slow-to-fast twitch fibers in rat soleus muscles [9]. Consistently, another experiment using rats have also revealed that 4 weeks of a high-protein diet (35%) induced muscle fibers changing from type II to type I in gastrocnemius muscles, accompanied by increased oxidative properties [12]. Some important regulators, such as peroxisome proliferator-activated receptor-g coactivator-1α (PGC-1α), constitute a mechanism that may be responsible for the effects of high-protein diets commented above [12]. PGC-1α through its interaction with silent information regulator transcript 1 (SIRT1) contributes to regulation of fiber conversion to type I [13]. Moreover, chronic activation of AMP-activated protein kinase (AMPK) has also been demonstrated to evoke muscle plasticity and conversion to the slow oxidative myogenic program, potentially associated with upregulated PGC-1α expression [14]. These observations indicate that the AMPK-SIRT1-PGC-1α axis may promote the slow, oxidative phenotype.
In recent years, there is growing awareness that in swine production, reducing the dietary crude protein (CP) level of the diet and supplementing it with the first four limiting crystalline amino acid (lysine, methionine, threonine, and tryptophan) are able to reduce N excretion and to improve gastrointestinal and function after weaning. However, impairment of piglet growth will occur in parallel [15–17]. Thus, it is urgent to identify the next-limiting amino acids that can maintain the growth performance of piglets fed low-protein diets.
Leucine (Leu) is a branched-chain amino acid (BCAA), which also includes isoleucine (Ile) and valine (Val). The chemical structure of Leu is similar to those of Ile and Val, and Leu competes with Ile and Val for the same enzymes that catalyze the first two catabolic steps [18]. An excessive supply of Leu in diets might augment the catabolism of all BCAAs and hence boost the nutritional requirements for Ile and Val [19]. Therefore, the dietary ratio of individual BCAA needs to be closely managed. We have previously reported that maintaining the dietary BCAA ratio (Leu: Ile: Val) within 1: 0.25: 0.25 – 1: 0.75: 0.75 in low-protein diets (17% CP) contributed to improving the growth performance of growing pigs, facilitating the absorption and utilization of free amino acids, thus improving protein metabolism and muscle growth. These effects even caught up to those observed in the positive control group (Leu: Ile: Val = 1: 0.51: 0.63, 20% CP) [20, 21]. Although the effects of BCAA ratio on muscle protein metabolism have been examined at the molecular level [21], the relationship between the BCAA ratio and muscle fiber types have not been as thoroughly characterized. Based on these observations, we speculated that effects of a low-protein diet (17% CP) supplemented with balanced BCAAs could catch up to those of high-protein diets on muscle fiber types in growing pigs via the AMPK-SIRT1-PGC-1α axis. In an analogy with muscular protein metabolism, it is of great importance to get an overview of relationships between BCAA ratio and signaling molecules for muscle fiber types.
Myofiber type proportions of longissimus dorsi muscle (LM), biceps femoris muscle (BM), and psoas major muscle (PM) are varied due to their anatomical location and thus they have different metabolic properties [22]. The percentage of oxidative (type I and IIa) fibers in the three skeletal muscles is as follows: PM > BM > LM. On the contrary, the percentage of glycolytic (type IIb) fibers in muscles is PM < BM < LM [22]. Muscle fibers are not static structures and easily adapt to altered environmental factors, such as changes in nutritional input. Thus, the aim of the present study was to explore the effects of varying BCAA ratios in low-protein diets (17% CP) on the mRNA and protein abundance of MyHC in muscles of different muscle fiber composition, and whether these effects were associated with the AMPK-SIRT1-PGC1a axis.
RESULTS
Serum glucose and insulin concentrations
As shown in Table 2, the serum glucose concentrations were not different among the groups (P > 0.05). The serum insulin concentrations in the 1:1:1 (17% CP) group was the same as those in the control (PC group, Leu: Ile: Val = 1:0.51:0.63, 20% CP), while the concentrations in other experimental groups significantly increased (P < 0.05), and there was no difference between the three groups.
Table 1: Primers used for real-time quantitative PCR
Genes |
Primers |
Sequences (5’-3’) |
Size (bp) |
|---|---|---|---|
MyHC I |
Forward |
GGCCCCTTCCAGCTTGA |
63 |
Reverse |
TGGCTGCGCCTTGGTTT |
||
MyHC IIa |
Forward |
TTAAAAAGCTCCAAGAACTGTTTCA |
109 |
Reverse |
CCATTTCCTGGTCGGAACTC |
||
MyHC IIx |
Forward |
AGCTTCAAGTTCTGCCCCACT |
79 |
Reverse |
GGCTGCGGGTTATTGATGG |
||
MyHC IIb |
Reverse |
CACTTTAAGTAGTTGTCTGCCTTGAG |
83 |
Forward |
GGCAGCAGGGCACTAGATGT |
||
SIRT1 |
Reverse |
GGTTTGAAGAATGTTGCCTG |
114 |
Forward |
CCGTTTACTAATCTGCTCCT |
||
PGC-1α |
Reverse |
GCCCAGTCTGCGGCTATTT |
265 |
Forward |
GTTCAGCTCGGCTCGGATTT |
||
UCP3 |
Reverse |
GAGATGGTGACCTATGATGT |
260 |
Forward |
CGCAAAAAGGAAGGTGTGAA |
||
GLUT4 |
Reverse |
CGAGGCAGGACGTTTGACC |
75 |
Forward |
CTCCAGTTCTGTGCTGGGTTTC |
||
β-actin |
Forward |
TGCGGGACATCAAGGAGAAG |
292 |
Reverse |
AGTTGAAGGTGGTCTCGTGG |
MyHC = myosin heavy chain; SIRT1 = silent information regulator transcript 1; PGC-1α = peroxisome proliferator-activated receptor-g coactivator-1α; UCP3 = uncoupling protein 3; GLUT4 = glucose transporter 4.
Table 2: Impacts of dietary BCAA ratio on serum biochemical parameters in the growing pigs1
Item |
Leu:Ile:Val |
SEM |
P value |
||||
|---|---|---|---|---|---|---|---|
1:0.51:0.63 (20% CP) |
1:1:1 (17% CP) |
1:0.75:0.75 (17% CP) |
1:0.51:0.63 (17% CP) |
1:0.25:0.25 (17% CP) |
|||
Glucose, mmol/L |
5.21 |
5.62 |
6.22 |
5.24 |
6.69 |
0.41 |
0.20 |
Insulin, IU/mL |
9.65b |
9.60b |
17.01a |
20.28a |
18.57a |
1.70 |
0.04 |
1Means within different superscript letters are significantly different at P < 0.05 and a trend toward significance at P < 0.10, n = 8.
Gene mRNA abundance of MyHC isoforms
We analyzed the mRNA abundance of MyHC I, IIa, IIx, and IIb in LM, BM, and PM of pigs fed low-protein diets with varying BCAA ratios. As shown in Table 3, the mRNA abundance of MyHC I, IIa, IIx, and IIb was highest in BM relative to that in LM and PM. In particular, the mRNA abundance of MyHC I, IIa, IIx, and IIb in BM was 19.58%, 84.37%, 78.83%, and 23.49% higher than that in LM (P < 0.05), respectively, and was 4.91%, 67.38%, 97.84%, and 17.20% higher than that in PM (P < 0.05), respectively. Moreover, compared with the control, the experimental groups exhibited higher mRNA abundance levels of MyHC I and IIa, with the highest values observed in the 1:0.25:0.25 group (P < 0.05). Although the experimental groups showed a higher mRNA abundance of MyHC IIx than the control, the mRNA abundance of MyHC IIx in experimental groups gradually decreased with the reduction of dietary BCAA ratio, with the lowest value observed in the 1:0.25:0.25 group (P < 0.05). There was a muscle × diet interaction for the mRNA abundance of MyHC IIa, IIx, and IIb in muscles of different fiber types (P < 0.05).
Table 3: Impacts of varying BCAA ratios in low-protein diets on relative mRNA abundance of myosin heavy chain isoform (MyHC I, IIa, IIx, and IIb) in skeletal muscle of different muscle fiber composition in growing pigs1
Item |
Skeletal muscles |
Leu: Ile: Val ratio |
SEM |
P value |
||||||||
|---|---|---|---|---|---|---|---|---|---|---|---|---|
Longissimus dorsi muscle |
Biceps femoris muscle |
Psoas major muscle |
1:0.51:0.63 (20% CP) |
1:1:1 (17% CP) |
1:0.75:0.75 (17% CP) |
1:0.51:0.63 (17% CP) |
1:0.25:0.25 (17% CP) |
P muscle |
P ratio |
P muscle×ratio |
||
MyHC I |
1.43B |
1.71A |
1.63AB |
1.05c |
1.52b |
1.74ab |
1.71ab |
1.93a |
0.25 |
0.043 |
<0.001 |
0.133 |
MyHC IIa |
1.28B |
2.36A |
1.41B |
1.09d |
1.58c |
1.97b |
1.55c |
2.28a |
0.25 |
<0.001 |
<0.001 |
<0.001 |
MyHC IIx |
1.37B |
2.45A |
1.09B |
1.07b |
1.73a |
1.78a |
1.62a |
2.03a |
0.28 |
<0.001 |
<0.001 |
<0.001 |
MyHC IIb |
1.49B |
1.84A |
1.57AB |
1.04c |
1.98a |
1.94a |
1.73ab |
1.48b |
0.27 |
0.029 |
<0.001 |
0.010 |
1Means within different superscript letters are significantly different at P < 0.05 and a trend toward significance at P < 0.10, n = 8.
The mRNA abundance of SIRT1, PGC-1α, UCP3, and GLUT4
The relative mRNA abundance levels of the SIRT1, PGC-1α, uncoupling protein 3 (UCP3), and glucose transporter 4 (GLUT4) are presented in Table 4. The mRNA abundance of SIRT1, PGC-1α and UCP3 was highest in BM and lowest in LM, with an intermediate value in PM (P < 0.05). The mRNA abundance of GLUT4 was highest in PM and lowest in LM, with an intermediate value in BM. Furthermore, the mRNA abundance of SIRT1 and UCP3 in 1:0.75:0.75, 1:0.51:0.63, and 1:0.25:0.25 was higher than that in the control (P < 0.05), with the greatest upregulation observed in 1:0.51:0.63 (17% CP). As to the mRNA abundance of PGC-1α, the 1:0.75:0.75 and 1:0.51:0.63 groups exhibited the higher abundance relative to the control (P < 0.05). The mRNA abundance of GLUT4 in the 1:0.75:0.75 group was higher than other groups (P < 0.05), and none of these groups achieved statistical significance. There was a muscle × diet interaction for the mRNA abundance of SIRT1, PGC-1α, UCP3, and GLUT4 in muscles of different fiber types (P < 0.05).
Table 4: Impacts of varying BCAA ratios in low-protein diets on relative mRNA abundance of key molecules involved in energy metabolism in skeletal muscles of different fiber types in growing pigs1
Item |
Skeletal muscles |
Leu: Ile: Val ratio |
SEM |
P value |
||||||||
|---|---|---|---|---|---|---|---|---|---|---|---|---|
Longissimus dorsi muscle |
Biceps femoris muscle |
Psoas major muscle |
1:0.51:0.63 (20% CP) |
1:1:1 (17% CP) |
1:0.75:0.75 (17% CP) |
1:0.51:0.63 (17% CP) |
1:0.25:0.25 (17% CP) |
P muscle |
P ratio |
P muscle×ratio |
||
SIRT1 |
0.93C |
1.91A |
1.34B |
1.05c |
1.26bc |
1.38b |
1.73a |
1.55ab |
0.25 |
<0.001 |
<0.001 |
<0.001 |
PGC-1α |
1.16B |
1.56A |
1.21B |
1.07b |
1.12b |
1.60a |
1.53a |
1.22b |
0.23 |
<0.001 |
<0.001 |
<0.001 |
UCP3 |
0.75C |
1.61A |
1.33B |
1.06b |
1.10b |
1.27ab |
1.43a |
1.28ab |
0.22 |
<0.001 |
<0.001 |
<0.001 |
GLUT4 |
0.91C |
1.12B |
1.61A |
1.08b |
1.15b |
1.40a |
1.19b |
1.21b |
0.20 |
<0.001 |
0.012 |
<0.001 |
1Means within different superscript letters are significantly different at P < 0.05 and a trend toward significance at P < 0.10, n = 8.
Protein abundance of MyHC I and IIa as well as the AMPK-SIRT1- PGC-1α axis
As shown in Figure 1A, in LM, the protein abundance of MyHC IIa and I was highest in 1:0.75:0.75 and 1:0.51:0.63 (17% CP) groups and lowest in the 1:0.25:0.25 group, with an intermediate value in the 1:1:1 and control (P < 0.05). Alteration in the protein abundance of p-SIRT1 and p-AMPKα showed the same trends as that of MyHC IIa and I. The PGC-1α protein abundance in 1:0.25:0.25 group was of the same value as that in the control (P > 0.05), while the 1:1:1, 1:0.75:0.75 and 1:0.51:0.63 (17% CP) groups was unable to bring PGC-1α protein abundance to the same level observed in the control group (P < 0.05). In BM (Figure 1B), the protein abundance of MyHC IIa and I in 1:0.25:0.25 group was not different from that in the control, while other experimental groups was unable to bring the abundance to the same level observed in the control (P < 0.05). The protein abundance of PGC-1α was highest in the 1:0.51:0.63 (17% CP) group (P < 0.05), and other experimental groups were not significantly different from that in the control. The protein abundance of p-SIRT1 was highest in the 1:0.75:0.75 group (P < 0.05), and other experimental groups were not significantly different from that in the control. The p-AMPKα protein abundance was not affected by the treatments (P > 0.05). In PM (Figure 1C), the experimental groups tended to increase the protein abundance of MyHC IIa and I, with the greatest increase observed in the 1:0.51:0.63 (17% CP) group (P < 0.05). Alteration in the protein abundance of p-SIRT1 and p-AMPKα showed the same trends as that of MyHC IIa and I. The PGC-1α protein abundance in 1:1:1 and 1:0.25:0.25 groups was the same as that in the control (P > 0.05), while the 1:0.75:0.75 and 1:0.51:0.63 (17% CP) groups was unable to bring PGC-1α protein abundance to the same level observed in the control group (P < 0.05).
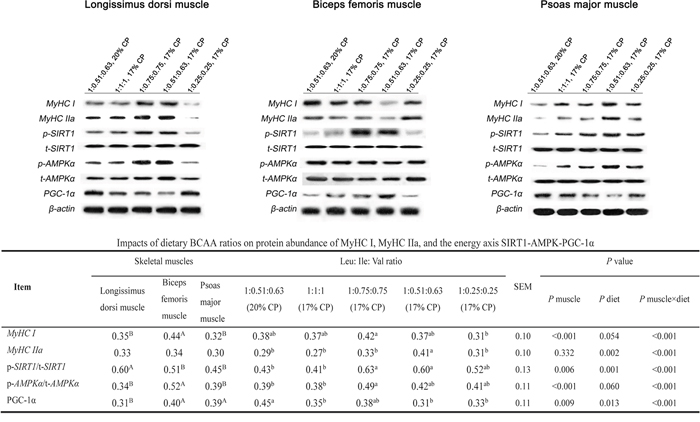
Figure 1: Protein abundance levels of MyCH I, MyCH IIa, and p/t-SIRT1, p/t-AMPKα, PGC-1α in the longissimus dorsi muscle, biceps femoris muscle, and psoas major muscle of growing pigs fed low-protein diets supplemented with varying BCAA ratios. Data were normalized to the value of corresponding total protein or the inner control β-actin and expressed as means ± SE (n = 8). Values within a row with different superscripts differ significantly (P < 0.05).
DISCUSSION
The skeletal muscle, including LM, BM, and PM, is a highly heterogeneous tissue, mainly comprised of four myofiber types: oxidative (I and IIa), intermediate (IIx), and glycolytic (IIb) [22]. There are marked differences in the fiber proportion between these muscles. The porcine LM has a high proportion of type IIb fibers and a small proportion of type I fibers, and is classified as glycolytic skeletal muscle [23]. The BM also mainly contain the fiber type of IIb, whereas the oxidative type I in BM is higher than that in LM. Therefore, the BM is classified as oxido-glycolytic skeletal muscle. Compared to the LM and BM, PM contains a relatively higher percentage of type I fiber and a lower proportion of type IIb fibers, and is classified as oxidative skeletal muscle [24]. Our studies indicated that the mRNA abundance of both oxidative and glycolytic isoforms especially increased in the BM of pigs in response to the treatments of the low-protein diets supplemented with varying BCAA ratios (1:0.75:0.75~0.25:0.25), However, compared to LM and PM, the extent of increases (103.95% and 72.29%, respectively) in oxidative isoforms (I and IIa) in BM was higher than that of increases (78.83% and 17.20%, respectively) in glycolytic isoforms (IIb). Therefore, a transformation from glycolytic-to-oxidative fibers may occur in BM in response to dietary treatments. Muscle fiber type phenotype is strongly associated with meat quality and muscle health. Higher amounts of type I and IIa fibers are associated with improved meat tenderness [25] and afford protection against insulin resistance and metabolic dysregulation [7, 26]. In contrast, increasing percentages of type IIb fibers may increase drip loss and exhibit tougher meat [27]. Based on these, our findings suggest that feeding the low-protein diets (17% CP) with varying BCAA ratios (1:0.75:0.75~0.25:0.25) could induce muscle more oxidative which contributes to the improvement of meat quality and muscle health.
Fiber type shift from glycolytic to oxidative in BM of pigs is consistent with the function of AMPK in skeletal muscle. The enzyme AMPK is a major energy sensor of myocytes [28]. Muscles rich in type IIb fibers may have a greater AMPK activity than muscles rich in type I and IIa fibers to more effectively or rapidly modulate energetic process, thereby conserving energy for ATPase activity and tension cost. Therefore, AMPK activity can be modulated according to the energetic requirements of different muscle fiber types. This indicates an intimate relationship between AMPK activity and muscle function [29]. Chronic exercise training in mice augments mitochondrial biogenesis and induces a glycolytic-to-oxidative fiber type transition in skeletal muscle; these transitions are blocked in AMPKα-inactive mice [30, 31]. Likewise, chronic AMPK activation by injecting AICAR promotes a fast-to-slow fiber type transition in skeletal muscle of rabbits and rodents [14, 32]. Reports of the effect of AMPKα on muscle fiber transformation have mainly focused on rodents, and the relationship between AMPKα and porcine muscle fiber transformation is not well understood. However, it has been recently reported that maternal dietary linoleic acid treatment enhances the AMPKα mRNA abundance in piglets that have more oxidative muscle fibers [33]. These data reveal that AMPKα may be associated with porcine muscle fiber composition. Consistent with the previous studies, we found that low-protein diets supplemented with varying BCAA ratios (1:0.75:0.75~1:0.25:0.25) specifically stimulated the activation of AMPK in BM, which had more oxidative muscle fibers than LM and PM. In contrast, other studies showed a different patterns of responses. For instance, previous studies showed downregulation of AMPK in rats fed increased Leu [34], or the phosphorylation of AMPK was increased in response to high concentration of BCAAs, but accompanied by inflammation [35]. The discrepancies between these findings might be related to several factors including animal model and experimental conditions (i.e., BCAA ratio). Although we show a potential connection between BCAA ratio and AMPK activation, the proximal mechanisms by which AMPK responds to BCAA ratios remain elusive. Overall, muscle fiber type-specific mRNA and protein abundance of AMPKα may promote a shift from glycolytic to oxidative fibers in BM.
It has been reported that PGC-1α, a downstream of AMPK, has been proposed as partially responsible for the effects exerted by AMPK on muscle fiber transformation [3]. Experiments in mice have shown that PGC-1α overabundance results in an enhancement of type I fibers [13], while the proportions of type I fibers tend to reduce in PGC-1α muscle-specific knockout mice [36]. AMPK may modulate PGC-1α directly or through SIRT1 [37]. Consistent with the protein abundance of AMPK, the mRNA abundances of SIRT1 and PGC-1α were higher in BM of pigs fed low-protein diets supplemented with varying BCAA ratios (1:0.75:0.75~1:0.25:0.25). The present results suggest that low-protein diets supplemented with optimal BCAA ratios specifically elevated AMPK abundance in BM of growing pigs and that AMPK may affect muscle fiber transformation by modulating the mRNA abundance of PGC-1α. Previous studies reveal that the AMPK-SIRT1 axis sensing the cellular energy status can modulate muscle fiber type by influencing mitochondria [38–40]. Mitochondrial function has been regarded as a new mediator of skeletal muscle fiber type, and PGC-1α exerts a particularly robust role in mitochondrial biogenesis and function [41]. In addition, mitochondrial biogenesis is involved in the role of Leu in energy metabolism [42]. There is compelling evidence that Leu (0.5 mM) can enhance mitochondrial biogenesis in C2C12 myocytes and regulate skeletal muscle energy metabolism by modulating the abundance of SIRT1 and PGC-1α [43]. Therefore, it is hypothesized, though not yet tested by the present study, that the AMPK-SIRT1-PGC1a axis contributes to the skeletal muscle fiber type alterations in response to dietary treatments by affecting mitochondrial biogenesis and function. Further studies are required to confirm this hypothesis.
In agreement with a typical fast-to-slow fiber type shift, enhancements in GLUT4 abundance generally parallels the activation of AMPK and PGC-1α, thus leading to the enhancement of muscle glucose metabolism and energy utilization [44, 45]. Moreover, GLUT4 protein content and muscle glucose uptake were increased in response to AMPK activation especially in fast-twitch glycolytic muscles rather than in slow-twitch oxidative muscles [46]. In contrast to these previous studies, we did not observe a concurrent increase in GLUT4 and AMPKα abundance in BM upon dietary treatments. Instead, PM exhibited the highest abundance of GLUT4. Our data provide evidence that the capacity of muscle glucose uptake may be improved especially in slow-twitch oxidative muscles. In rodents, GLUT4 content is inherently greater in oxidative type I muscles vs. glycolytic type IIb muscles [47]. Consistent with this, our results with pigs showed that oxidative PM contains more GLUT4 than oxidative-glycolytic BM and glycolytic LM, although the activities of AMPK and PGC-1α were significantly upregulated in BM. In contrast, other studies exhibited a different patterns of responses in muscles from other species. Studies using models of rat and humans show that GLUT4 level is not consistently higher in type I than in type II [48]. A greater GLUT4 level in type IIb fibers than type I and IIa fibers of equine muscle has been reported [49]. Moreover, some studies show that there is little relationship between GLUT4 content and fiber type although exercise training increases GLUT4 level [50]. Therefore, GLUT4 may be more in connection with muscle activity than with MyHC isoform, and the precise mechanism by which AMPK modulates muscle fiber type-specific GLUT4 abundance remains elusive.
It has been reported that UCP3 abundance is closely related to glucose metabolism in skeletal muscle. Overexpressing UCP3 in L6 myotubes promotes glucose uptake through an increased recruitment of the glucose transporter GLUT4 to the cell surface [51]. UCP3 and GLUT4 mRNA abundance have been shown to increase in parallel after endurance exercise [52]. One proposed mechanism by which UCP3 could influence glucose uptake via GLUT4 translocation is via AMPK [53]. Experiments using humans also show that UCP3 is expressed more abundantly in glycolytic type IIb muscle fibers than in oxidative type I muscle fibers [54]. In contrast to the previous findings, we found that in our in vivo experimental conditions the mRNA abundance of UCP3 was highest in oxidative-glycolytic skeletal muscle (BM) and lowest in glycolytic skeletal muscle (LM) of growing pigs. The pattern of UCP3 mRNA abundance was similar to that of AMPKα protein abundance in skeletal muscles. However, GLUT4 mRNA abundance did not increased in parallel with UCP3. Experiments using mice also show that overexpressing UCP3 reduces plasma glucose and insulin levels [55]. However, in the present study, no difference in serum glucose concentrations among all groups was noted, and serum insulin concentrations were increased in pigs fed diets with varying BCAA ratios (1:0.75:0.75~1:0.25:0.25). A peculiar characteristic of skeletal muscle is that it is composed of different types of muscle fibers, with different capacities to respond to external stimuli [56]. Therefore, although the reason for this discrepancy is not clear, it is possible that difference in the experimental approaches such as animal breeds, exercise or not, and diets could have contributed to the observed difference. Overall, our data provide evidence that AMPKα activation increased the PGC-1α mRNA and protein abundance levels, and it consequently increased UCP3 abundance especially in oxido-glycolytic skeletal muscles (BM).
In summary, we herein demonstrated that low-protein diets supplemented with optimal BCAA ratio, i.e. 1:0.75:0.75-1:0.25:0.25, induced a muscle fiber transformation from glycolytic to oxidative fibers especially in oxidative-glycolytic skeletal muscle of growing pigs. These effects were likely attributed to the activation of the AMPK-SIRT1-PGC-1α axis. In addition, such treatment also increased the UCP3 mRNA abundance in the oxido-glycolytic skeletal muscle. It is speculated that this adaptation may be due to an increased AMPKα activity. On the other hand, the pattern of GLUT4 mRNA abundance in selected muscles may be independent of the AMPK pathway.
MATERIALS AND METHODS
All procedures followed in the present experiment were approved by the committee on animal care of the Institute of Subtropical Agriculture, the Chinese Academy of Sciences.
Animals and diets
A total of forty pigs (Large White × Landrace) with a mean initial weight (9.85 ± 0.35 kg) were chosen and randomly allotted into five dietary treatments. Each treatment had eight replicates (n=8). Animals were housed individually in cages. Diets were corn and soybean meal-based and formulated to differ in CP and AA quantities (Supplementary Table 1). All diets were fortified with lysine, methionine, threonine and tryptophan to provide recommended levels according to the National Research Council (NRC, [57]). The diets of positive control (PC) group contained 20% CP with a Leu: Ile: Val ratio of 1:0.51:0.63 according to the recommendation of the 2012 NRC [57]. In the four experimental groups, the dietary CP level was reduced to 17%, and the Leu: Ile: Val ratios were 1:1:1, 1:0.75:0.75, 1:0.51:0.63, and 1:0.25:0.25, respectively. The total BCAA amount was equal in all treatments. All the experimental diets were formulated to be isoenergetic and to meet the nutritional requirements for growing pigs (Supplemental Table 1). Pigs were fed with the experimental diets ad libitum, and had unlimited access to clean drinking-water. The experiment lasted for 45 d.
Tissue sample collection
Before slaughter, blood samples were collected into 10 ml tubes from the jugular vein puncture for the determination of serum biochemical indices. Serum was separated by centrifugation at 3,000 g for 10 min at 4°C and then stored at -80°C until analysis. At the end of the feeding test, all the pigs were fasted overnight and slaughtered by electrically stunning (250V, 0.5 A, for 5~6s) and exsanguinating as described in our previous study [58]. Immediately, skeletal muscle samples including LM, BM, and PM were rapidly excised from the left side of the carcass. The samples were then placed in 10% neutral buffered formalin or placed in liquid nitrogen and then stored at -80°C, respectively, until further analysis.
Measurement of serum glucose and insulin concentrations
The concentrations of serum insulin were measured using commercial ELISA kits (Cusabio Life Science Inc., Wuhan, China). Circulating glucose concentrations were determined using commercial kit from CIBA Corning (OH, USA).
Reverse transcription and real-time quantitative PCR
The reverse transcription and real-time quantitative PCR were conducted as previously described [22, 58]. Briefly, total RNA was extracted from skeletal muscles using Trizol reagent (Invitrogen, Carlsbad, CA, USA). Primers for the selected genes were designed using the Oligo 6.0 software (Table 1). RT was performed using the AMV Reverse Transcriptase Kit (Promega). The relative expression levels of the target genes were determined using quantitative real-time PCR, performed with an ABI 7900 PCR system (ABI Biotechnology). The final volume of the reaction mixtures (20 μL) contained diluted complementary DNA and SYBR Green I (Molecular Probes) as a PCR core reagent. The housing-keeping gene β-actin was used as internal control to normalize the expression of target genes. The relative quantification of gene amplification by RT-PCR was performed using the value of the threshold cycle (Ct). Relative expressions of target genes were determined by the 2-ΔΔCt method [58, 59].
Western blotting analysis
Western blot analysis was conducted according to our previous studies [22, 60, 61]. Briefly, tissue samples (about 500-800 mg) were powdered in liquid N2 to extract total protein. Total protein (about 30-50 μg) was separated by reducing SDS-PAGE electrophoresis. The polyclonal antibodies used were as follows: anti-MyHC IIa (Santa Cruz Biotechnology, sc-71632), anti-MyHC I (Santa Cruz Biotechnology, sc-53089), anti-PGC-1α (Cell Signaling Technology, Danvers, MA; #4259), anti- phosphor (p)-AMPKα (Cell Signaling Technology, Danvers, MA; #2535), total (t)-AMPKα (Cell Signaling Technology, Danvers, MA; #2532S), anti-p-SIRT1 (Cell Signaling Technology, Danvers, MA; #2314), t-SIRT1 Cell Signaling Technology, Danvers, MA; #2310S), and anti-β-actin (Santa Cruz Biotechnology, sc-47778). The secondary antibodies (Goat Anti-Rabbit IgG: ZSGB-BIO, ZB-2301; Goat Anti-Mouse IgG: ZSGB-BIO, ZB-2305) were used (1:5,000) for 1 h at room temperature. The bands of the protein were visualized using a chemiluminescent reagent (Pierce, Rockford, USA) with a ChemiDoc XRS system (Bio-Rad, Philadelphia, PA, USA). We quantified the resultant signals using Alpha Imager 2200 software (Alpha Innotech Corporation, CA, USA) and normalized the data with the value of corresponding total protein or the inner control.
Statistical analyses
Data of serum parameters and the fiber size obtained from this study was analyzed by the One-way analysis of variance (ANOVA) using SAS 8.2 software (Cary, NC, USA) followed by a Duncan’s multiple comparison test. Other data in the present study were performed by ANOVA using the general linear model procedures of SAS appropriate for a 2 × 2 factorial design (SAS Inc., Cary, NC). The statistical model included the effects of muscle (LM, BM, or PM), diet (1:0.51:0.63 (20% CP), 1:1:1 (17% CP), 1:0.75:0.75 (17% CP), 1:0.51:0.63 (17% CP), and 1:0.25:0.25 (17% CP)), and their interactions. The differences among treatments were evaluated using Tukey’s test. Results are presented as means with standard errors. Differences between significant means were considered as statistically different at P < 0.05 and a trend toward significant at P < 0.10.
To view supplementary material for this article, please visit https://link.springer.com/article/10.1007/s00726-016-2223-2
Abbreviations
AMPKα: AMP-activated protein kinase α, AP: adequate protein, BCAA: branched-chain amino acid, BM: biceps femoris muscle, CP: crude protein, GLUT4: glucose transporter 4, Ile: isoleucine, Leu: leucine, LM: longissimus dorsi muscle, LP: low protein, MyHC: myosin heavy chain, PGC-1α: peroxisome proliferator-activated receptor-g coactivator-1α, PM: psoas major muscle, SIRT1: silent information regulator transcript 1, UCP3: uncoupling protein 3, Val: valine.
Author contributions
YLY and FNL conceived and designed the study. YHD conducted the animal trial, analyzed and interpreted the data and wrote the paper. WLW, QPG, and CYW assisted with tissue collection, revised the manuscript and performed the chemical analyses. All authors read and approved the final version of the manuscript.
ACKNOWLEDGMENTS
This study was financially supported by the National Basic Research Program of China (2013CB127305), the Major Project of Hunan Province (2015NK1002), China Agriculture Research System (CARS-35), the Science and technology projects of Hunan Province (2017RS3058, 2016SK3022), the Youth Innovation Promotion Association CAS (2016326), Youth Innovation Team Project of ISA, CAS (2017QNCXTD_ZCS), the Key Project of Research and Development Plan of Hunan Province (2016NK2170) and the National Science and Technology Ministry (2014BAD08B11).
CONFLICTS OF INTEREST
The authors declare that they have no competing interests.
REFERENCES
1. Lee SH, Joo ST, Ryu YC. Skeletal muscle fiber type and myofibrillar proteins in relation to meat quality. Meat Sci. 2010; 86:166–70.
2. Rossi AC, Mammucari C, Argentini C, Reggiani C, Schiaffino S. Two novel/ancient myosins in mammalian skeletal muscles: MYH14/7b and MYH15 are expressed in extraocular muscles and muscle spindles. J Physiol. 2010; 588:353–64.
3. Nakazato K, Tsutaki A. Regulatory mechanisms of muscle fiber types and their possible interactions with external nutritional stimuli. J Phys Fitness Sports Med. 2012; 1:655–64.
4. Pette D, Staron RS. Myosin isoforms, muscle fiber types, and transitions. Microsc Res Tech. 2000; 50:500–09.
5. Choi YM, Ryu YC, Kim BC. Influence of myosin heavy- and light chain isoforms on early postmortem glycolytic rate and pork quality. Meat Sci. 2007; 76:281–88.
6. Bassel-Duby R, Olson EN. Signaling pathways in skeletal muscle remodeling. Annu Rev Biochem. 2006; 75:19–37.
7. Wang YX, Zhang CL, Yu RT, Cho HK, Nelson MC, Bayuga-Ocampo CR, Ham J, Kang H, Evans RM. Regulation of muscle fiber type and running endurance by PPAR delta. PLoS Biol. 2004; 2:1532–39.
8. Duan Y, Li F, Tan B, Yao K, Yin Y. Metabolic control of myofibers: promising therapeutic target for obesity and type 2 diabetes. Obes Rev. 2017; 18:647–59.
9. Taillandier D, Bigard X, Desplanches D, Attaix D, Guezennec CY, Arnal M. Role of protein intake on protein synthesis and fiber distribution in the unweighted soleus muscle. J Appl Physiol (1985). 1993; 75:1226–32.
10. White P, Cattaneo D, Dauncey MJ. Postnatal regulation of myosin heavy chain isoform expression and metabolic enzyme activity by nutrition. Br J Nutr. 2000; 84:185–94.
11. Brodsky IG, Suzara D, Hornberger TA, Goldspink P, Yarasheski KE, Smith S, Kukowski J, Esser K, Bedno S. Isoenergetic dietary protein restriction decreases myosin heavy chain IIx fraction and myosin heavy chain production in humans. J Nutr. 2004; 134:328–34.
12. Nakazato K, Song H. Increased oxidative properties of gastrocnemius in rats fed on a high-protein diet. J Nutr Biochem. 2008; 19:26–32.
13. Lin J, Wu H, Tarr PT, Zhang CY, Wu Z, Boss O, Michael LF, Puigserver P, Isotani E, Olson EN, Lowell BB, Bassel-Duby R, Spiegelman BM. Transcriptional co-activator PGC-1 alpha drives the formation of slow-twitch muscle fibres. Nature. 2002; 418:797–801.
14. Ljubicic V, Miura P, Burt M, Boudreault L, Khogali S, Lunde JA, Renaud JM, Jasmin BJ. Chronic AMPK activation evokes the slow, oxidative myogenic program and triggers beneficial adaptations in mdx mouse skeletal muscle. Hum Mol Genet. 2011; 20:3478–93.
15. Lordelo MM, Gaspar AM, Le Bellego L, Freire JP. Isoleucine and valine supplementation of a low-protein corn-wheat-soybean meal-based diet for piglets: growth performance and nitrogen balance. J Anim Sci. 2008; 86:2936–41.
16. Zhang S, Qiao S, Ren M, Zeng X, Ma X, Wu Z, Thacker P, Wu G. Supplementation with branched-chain amino acids to a low-protein diet regulates intestinal expression of amino acid and peptide transporters in weanling pigs. Amino Acids. 2013; 45:1191–205.
17. Le Bellego L, Noblet J. Performance and utilization of dietary energy and amino acids in piglets fed low protein diets. Livest Prod Sci. 2002; 76:45–58.
18. Langer S, Scislowski PW, Brown DS, Dewey P, Fuller MF. Interactions among the branched-chain amino acids and their effects on methionine utilization in growing pigs: effects on plasma amino- and keto-acid concentrations and branched-chain keto-acid dehydrogenase activity. Br J Nutr. 2000; 83:49–58.
19. Wiltafsky MK, Pfaffl MW, Roth FX. The effects of branched-chain amino acid interactions on growth performance, blood metabolites, enzyme kinetics and transcriptomics in weaned pigs. Br J Nutr. 2010; 103:964–76.
20. Duan YH, Zeng LM, Li FN, Li YH, Tan BE, Ji YJ, Kong XF, Tang YL, Zhang YZ, Yin YL. Effects of dietary branched-chain amino acid ratio on growth performance and serum amino acid pool of growing pigs. J Anim Sci. 2016 (Suppl 3); 94:129–34.
21. Duan Y, Guo Q, Wen C, Wang W, Li Y, Tan B, Li F, Yin Y. Free amino acid profile and expression of genes related to protein metabolism in skeletal muscle of growing pigs fed low-protein diets supplemented with branched-chain amino acids. J Agric Food Chem. 2016; 64:9390–400.
22. Li Y, Li F, Wu L, Wei H, Liu Y, Li T, Tan B, Kong X, Yao K, Chen S, Wu F, Duan Y, Yin Y. Effects of dietary protein restriction on muscle fiber characteristics and mTORC1 pathway in the skeletal muscle of growing-finishing pigs. J Anim Sci Biotechnol. 2016; 7:47.
23. Choi YM, Ryu YC, Kim BC. Effect of myosin heavy chain isoforms on muscle fiber characteristics and meat quality in porcine longissimus muscle. J Muscle Foods. 2006; 17:413–27.
24. Karlssona AH, Klontb RE, Fernandezc X. Skeletal muscle fibres as factors for pork quality. Livest Prod Sci. 1999; 60:255–69.
25. Maltin CA, Sinclair KD, Warriss PD, Grant CM, Porter AD, Delday MI, Warkup CC. The effects of age at slaughter, genotype and finishing system on the biochemical properties, muscle fibre type characteristics and eating quality of bull beef from suckled calves. Anim Sci. 1998; 66:341–48.
26. Barnes BR, Marklund S, Steiler TL, Walter M, Hjälm G, Amarger V, Mahlapuu M, Leng Y, Johansson C, Galuska D, Lindgren K, Abrink M, Stapleton D, et al. The 5′-AMP-activated protein kinase gamma3 isoform has a key role in carbohydrate and lipid metabolism in glycolytic skeletal muscle. J Biol Chem. 2004; 279:38441–47.
27. Choi YM, Kim BC. Muscle fiber characteristics, myofibrillar protein isoforms, and meat quality. Livest Sci. 2009; 122:105–18.
28. Hardie DG, Carling D, Carlson M. The AMP-activated/SNF1 protein kinase subfamily: metabolic sensors of the eukaryotic cell? Annu Rev Biochem. 1998; 67:821–55.
29. Park SK, Sheffler TL, Spurlock ME, Grant AL, Gerrard DE. Chronic activation of 5′-AMP-activated protein kinase changes myosin heavy chain expression in growing pigs. J Anim Sci. 2009; 87:3124–33.
30. Röckl KS, Hirshman MF, Brandauer J, Fujii N, Witters LA, Goodyear LJ. Skeletal muscle adaptation to exercise training: AMP-activated protein kinase mediates muscle fiber type shift. Diabetes. 2007; 56:2062–69.
31. Yan Z, Okutsu M, Akhtar YN, Lira VA. Regulation of exercise-induced fiber type transformation, mitochondrial biogenesis, and angiogenesis in skeletal muscle. J Appl Physiol (1985). 2011; 110:264–74.
32. Green HJ, Düsterhöft S, Dux L, Pette D. Metabolite patterns related to exhaustion, recovery and transformation of chronically stimulated rabbit fast-twitch muscle. Pflugers Arch. 1992; 420:359–66.
33. Lu ZQ, Ren Y, Zhou XH, Yu XF, Huang J, Yu DY, Wang XX, Wang YZ. Maternal dietary linoleic acid supplementation promotes muscle fibre type transformation in suckling piglets. J Anim Physiol Anim Nutr (Berl). 2016; Epub Ahead of Print. https://doi.org/10.1111/jpn.12626.
34. Saha AK, Xu XJ, Lawson E, Deoliveira R, Brandon AE, Kraegen EW, Ruderman NB. Downregulation of AMPK accompanies leucine- and glucose-induced increases in protein synthesis and insulin resistance in rat skeletal muscle. Diabetes. 2010; 59:2426–34.
35. Zhenyukh O, Civantos E, Ruiz-Ortega M, Sánchez MS, Vázquez C, Peiró C, Egido J, Mas S. High concentration of branched-chain amino acids promotes oxidative stress, inflammation and migration of human peripheral blood mononuclear cells via mTORC1 activation. Free Radic Biol Med. 2017; 104:165–77.
36. Handschin C, Chin S, Li P, Liu F, Maratos-Flier E, Lebrasseur NK, Yan Z, Spiegelman BM. Skeletal muscle fiber-type switching, exercise intolerance, and myopathy in PGC-1alpha muscle-specific knock-out animals. J Biol Chem. 2007; 282:30014–21.
37. Cantó C, Auwerx J. PGC-1alpha, SIRT1 and AMPK, an energy sensing network that controls energy expenditure. Curr Opin Lipidol. 2009; 20:98–105.
38. Parsons SA, Wilkins BJ, Bueno OF, Molkentin JD. Altered skeletal muscle phenotypes in calcineurin Aalpha and Abeta gene-targeted mice. Mol Cell Biol. 2003; 23:4331–43.
39. Hardie DG, Ross FA, Hawley SA. AMPK: a nutrient and energy sensor that maintains energy homeostasis. Nat Rev Mol Cell Biol. 2012; 13:251–62.
40. Chalkiadaki A, Igarashi M, Nasamu AS, Knezevic J, Guarente L. Muscle-specific SIRT1 gain-of-function increases slow-twitch fibers and ameliorates pathophysiology in a mouse model of duchenne muscular dystrophy. PLoS Genet. 2014; 10:e1004490.
41. He X, Duan Y, Yao K, Li F, Hou Y, Wu G, Yin Y. β-Hydroxy-β-methylbutyrate, mitochondrial biogenesis, and skeletal muscle health. Amino Acids. 2016; 48:653–64.
42. Duan Y, Li F, Liu H, Li Y, Liu Y, Kong X, Zhang Y, Deng D, Tang Y, Feng Z, Wu G, Yin Y. Nutritional and regulatory roles of leucine in muscle growth and fat reduction. Front Biosci (Landmark Ed). 2015; 20:796–813.
43. Sun X, Zemel MB. Leucine modulation of mitochondrial mass and oxygen consumption in skeletal muscle cells and adipocytes. Nutr Metab (Lond). 2009; 6:26.
44. Hardie DG, Sakamoto K. AMPK: a key sensor of fuel and energy status in skeletal muscle. Physiology (Bethesda). 2006; 21:48–60.
45. Suwa M, Nakano H, Kumagai S. Effects of chronic AICAR treatment on fiber composition, enzyme activity, UCP3, and PGC-1 in rat muscles. J Appl Physiol (1985). 2003; 95:960–68.
46. Winder WW, Holmes BF, Rubink DS, Jensen EB, Chen M, Holloszy JO. Activation of AMP-activated protein kinase increases mitochondrial enzymes in skeletal muscle. J Appl Physiol (1985). 2000; 88:2219–26.
47. Kern M, Wells JA, Stephens JM, Elton CW, Friedman JE, Tapscott EB, Pekala PH, Dohm GL. Insulin responsiveness in skeletal muscle is determined by glucose transporter (Glut4) protein level. Biochem J. 1990; 270:397–400.
48. Borghouts LB, Schaart G, Hesselink MK, Keizer HA. GLUT-4 expression is not consistently higher in type-1 than in type-2 fibres of rat and human vastus lateralis muscles; an immunohistochemical study. Pflugers Arch. 2000; 441:351–58.
49. van Dam KG, van Breda E, Schaart G, van Ginneken MM, Wijnberg ID, de Graaf-Roelfsema E, van der Kolk JH, Keizer HA. Investigation of the expression and localization of glucose transporter 4 and fatty acid translocase/CD36 in equine skeletal muscle. Am J Vet Res. 2004; 65:951–56.
50. Daugaard JR, Nielsen JN, Kristiansen S, Andersen JL, Hargreaves M, Richter EA. Fiber type-specific expression of GLUT4 in human skeletal muscle: influence of exercise training. Diabetes. 2000; 49:1092–95.
51. Huppertz C, Fischer BM, Kim YB, Kotani K, Vidal-Puig A, Slieker LJ, Sloop KW, Lowell BB, Kahn BB. Uncoupling protein 3 (UCP3) stimulates glucose uptake in muscle cells through a phosphoinositide 3-kinase-dependent mechanism. J Biol Chem. 2001; 276:12520–29.
52. Tsuboyama-Kasaoka N, Tsunoda N, Maruyama K, Takahashi M, Kim H, Ikemoto S, Ezaki O. Up-regulation of uncoupling protein 3 (UCP3) mRNA by exercise training and down-regulation of UCP3 by denervation in skeletal muscles. Biochem Biophys Res Commun. 1998; 247:498–503.
53. Winder WW, Hardie DG. AMP-activated protein kinase, a metabolic master switch: possible roles in type 2 diabetes. Am J Physiol. 1999; 277:E1–10.
54. Hesselink MK, Keizer HA, Borghouts LB, Schaart G, Kornips CF, Slieker LJ, Sloop KW, Saris WH, Schrauwen P. Protein expression of UCP3 differs between human type 1, type 2a, and type 2b fibers. FASEB J. 2001; 15:1071–73.
55. Clapham JC, Arch JR, Chapman H, Haynes A, Lister C, Moore GB, Piercy V, Carter SA, Lehner I, Smith SA, Beeley LJ, Godden RJ, Herrity N, et al. Mice overexpressing human uncoupling protein-3 in skeletal muscle are hyperphagic and lean. Nature. 2000; 406:415–18.
56. Schrauwen P, Hesselink M. UCP2 and UCP3 in muscle controlling body metabolism. J Exp Biol. 2002; 205:2275–85.
57. NRC. (2012). Nutrient requirements of swine (eleventh revised edition). Washington, DC: National Academic Press.
58. Duan Y, Duan Y, Li F, Li Y, Guo Q, Ji Y, Tan B, Li T, Yin Y. Effects of supplementation with branched-chain amino acids to low-protein diets on expression of genes related to lipid metabolism in skeletal muscle of growing pigs. Amino Acids. 2016; 48:2131–44.
59. Li F, Duan Y, Li Y, Tang Y, Geng M, Oladele OA, Kim SW, Yin Y. Effects of dietary n-6:n-3 PUFA ratio on fatty acid composition, free amino acid profile and gene expression of transporters in finishing pigs. Br J Nutr. 2015; 113:739–48.
60. Li F, Li Y, Tan B, Wang J, Duan Y, Guo Q, Liu Y, Kong X, Li T, Tang Y, Yin Y. Alteration of inflammatory cytokines, energy metabolic regulators, and muscle fiber type in the skeletal muscle of postweaning piglets. J Anim Sci. 2016; 94:1064–72.
61. Duan Y, Li F, Li L, Fan J, Sun X, Yin Y. n-6:n-3 PUFA ratio is involved in regulating lipid metabolism and inflammation in pigs. Br J Nutr. 2014; 111:445–51.