
INTRODUCTION
Glioma is one of the most fatal types of human brain cancers, and currently there is no effective therapy [1]. According to clinicopathological parameters, the World Health Organization (WHO) has classified human gliomas into grades I–IV [1], which are highly related to progression, treatment and prognosis. Pathological grades for glioma are usually divided into low-grade and high-grade. Low-grade gliomas (LGG) include grades I and II, which often have better prognoses, while high-grade gliomas (HGG) include grades III and IV and have worse prognoses. Malignant gliomas, one of the most aggressive human brain cancers, account for 70%-80% of malignant brain tumors [2–5]. Despite achievements in surgical procedures, radiotherapy and chemotherapy, the 5-year survival rates for gliomas remain low [6, 7]. To achieve better outcomes, a better understanding of the responsible molecular pathways and mechanisms is urgently needed.
Retinol dehydrogenase-10 (RDH10) is a member of the short-chain dehydrogenase/reductase family that was first cloned from human, mouse and bovine retinal pigment epithelial cells [8]. The homology in the amino acid sequences among RDH10 isoforms from different species is extraordinarily high, with a 99% identity between human and murine RDH10 [8], indicating a high functional significance of RDH10. Rdh10-null mice are embryonic lethal, but can be rescued by retinoic acid (RA) treatment of the pregnant mother, suggesting that RDH10 is essential for RA generation during embryonic development [9]. While the exact function of RDH10 in RA generation is unknown, it has been reported that RDH10 mediates retinol (vitamin A) oxidation to generate retinal, which is indispensable for retinoic acid synthesis [10, 11]. As retinoic acid is used in the treatment of many types of leukemia, it is possible that RDH10, an important enzyme in retinoic acid synthesis, might be involved in cancer development.
Tumor necrosis factor-like weak inducer of apoptosis (TNFSF12, TWEAK) and its receptor, fibroblast growth factor-inducible protein14 (TNFRSF12A, TWEAKR, Fn14), are involved in many biological processes, including regulation of NF-κB signaling [12–17]. NF-κB signaling controls many biological processes, including cell survival, and immune and inflammatory responses [18]. The canonical NF-κB pathway is activated by inducible phosphorylation and degradation of IκBα, resulting in the nuclear translocation of NF-kB subunits. The non-canonical NF-κB pathway is regulated by NF-κB inducing kinase (NIK) and ubiquitin-mediated proteasomal degradation of TRAF3 [19–23]. Previous studies have found that TWEAK and Fn14 are over-expressed in gliomas that have high levels of NF-κB activation [24–27], indicating that NF-κB may serve as an important therapeutic target in glioma [28].
In this study, we have analyzed the RDH10 expression in human gliomas, and investigated the role of TWEAK–NF-κB axis during glioma development. Our results demonstrate that RDH10 is highly expressed in gliomas and correlates with poor prognosis, suggesting that it may serve as a new target for glioma treatment.
RESULTS
RDH10 expression is associated with development and progression of human glioma
In our study, 150 human glioma samples of grades I–IV were harvested to evaluate RDH10 expression by immunohistochemistry (IHC) (Figure 1A). IHC data demonstrated that RDH10 was expressed in glioma specimens of different grades to different degrees. Positive RDH10 expression was found in 5/36 grade I glioma specimens, 17/39 grade II specimens, 24/34 grade III specimens, and 37/41 grade IV specimens (Table 1). These data demonstrate that RDH10 expression positively correlates with the pathological grade in human glioma (P<0.001). Analysis of RDH10 expression from GE-mini dataset (http://gemini.cancer-pku.cn/)[29], which integrates The Cancer Genome Atlas (TCGA) and Genotype-Tissue Expression (GTEx) datasets, revealed that RDH10 levels are increased in gliomas compared with normal brain tissues, and highly increased in glioblastoma (GBM) (Figure 1B). In TCGA dataset, the RDH10 expression also exhibited significant differences between LGG and GBM (**P< 0.01) (Figure 1C, Supplymentary Table 1). A generalized linear model analysis was then performed on TCGA RNA-sequencing data for gliomas, and Kaplan-Meier survival curve was used to evaluate patient survival times. These results showed that the cumulative survival rate was remarkably lower in glioma patients with higher RDH10 expression than in those with lower RDH10 expression (**P < 0.01) (Table 2, Figure 1D). As both gliomas grade and RDH10 expression had a significant influence on patient survival, we wondered whether RDH10 expression was an independent prognostic factor of glioma patients’ survival. Analysis with Cox’s regression model revealed that RDH10 expression had independent impact on glioma patients’ survival (Table 3, B=1.068, ***P < 0.001). As the coefficients of Cox’s regression model was positive (B value=1.068), these data suggested that the higher RDH10 level indicated a worse prognosis for glioma patients, and was associated with a 2.908-fold increased risk of death (Exp(B)=2.908). Together, these data indicate that the RDH10 expression may serve as a potential biomarker in the pathogenesis and progression of gliomas.
Table 1: Association between RDH10 expression and WHO grading of gliomas
WHO grading |
N |
RDH10 expression |
|
|---|---|---|---|
Positive(n) |
% |
||
Grade I |
36 |
5 |
13.89 |
Grade II |
39 |
17 |
43.59 |
Grade III |
34 |
24 |
70.59 |
Grade IV |
41 |
37 |
90.24 |
Table 2: Correlation between RDH10 expression and patient survive in TCGA
Patient |
Death |
Death |
P value |
||
|---|---|---|---|---|---|
N |
N |
% |
|||
RDH10 expression level |
Low |
286 |
45 |
15.7 |
0.000 |
High |
311 |
171 |
55 |
||
Total |
597 |
216 |
36.2 |
Table 3: Cox regression analysis results
B |
P value |
Exp (B) |
95.0% CI of Exp(B) |
||
|---|---|---|---|---|---|
Lower |
Upper |
||||
RDH10 level |
1.068 |
.000 |
2.908 |
1.976 |
4.280 |
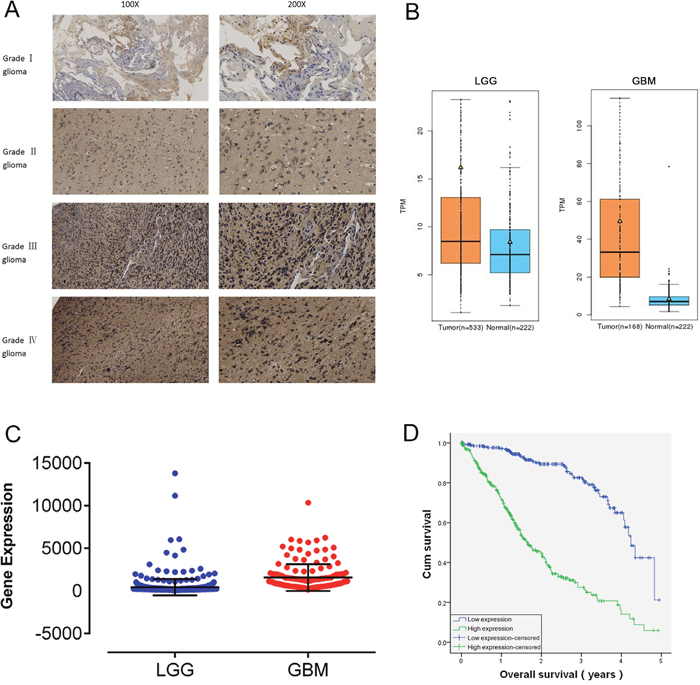
Figure 1: RDH10 is over-expressed in human gliomas and predicts a high grade and poor prognosis. (A) Characteristic micrographs of RDH10 immunostaining in gliomas at WHO grade I, II, III, and IV (magnification left, ×100 and right, ×200). (B) Analysis of RDH10 expression from GE-mini(TCGA and GTEx datasets) revealed significant differences between normal brain tissues and glioma. (C) Analysis of RDH10 expression in LGG and GBM. A generalized linear model (GLM) analysis was performed for TCGA RNA-sequencing data of Gliomas. **P < 0.01. (D) Survival analysis showed that higher RDH10 expressing gliomas had a poorer prognosis than lower RDH10 expressing gliomas. **P < 0.01.
Lentiviral-mediated shRNA efficiently inhibits RDH10 expression
To investigate whether there is a causal relationship between RDH10 expression and development of human glioma, we examined the RDH10 expression in glioma cell lines U87, U251, U373 and A172. Gene expression of RDH10 was moderate in U87 and A172 cells, and high in U373 and U251 cells (Figure 2A). To establish glioma cell lines with suppressed RDH10 expression, glioma cells were treated with RDH10-shRNA or scrambled (Scr)-shRNA viruses and RDH10 gene and protein levels were analyzed by real-time PCR (qPCR) and western blotting, respectively. Gene and protein levels of RDH10 were significantly decreased in cells that received RDH10-shRNA (Figure 2B), demonstrating that the lentivirus-based shRNA strategy efficiently inhibited RDH10 expression in glioma cells.
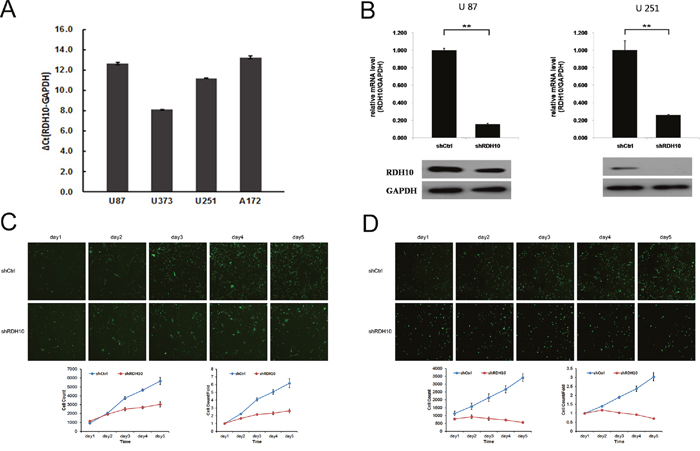
Figure 2: Lentiviral-mediated RDH10 knockdown suppressed human glioma proliferation. (A) Relative RDH10 mRNA levels in glioma cell lines by qPCR. (B) qPCR revealed that RDH10 expression was efficiently reduced in U87 and U251 cells. **P < 0.01. (C and D) RDH10 knockdown inhibited U87 (C) and U251 (D) proliferation in vitro. Proliferation detected by CellomicsArrayScan VTI every day for 5d. All experiments were repeated at least three times. Data are shown as mean ± SD, **P < 0.01.
RDH10 knockdown impairs glioma cell proliferation in vitro
Persistent proliferation signals are an important marker of cancer [30]; thus, it was important to study the impact of RDH10 knockdown on glioma cell proliferation. We assessed cell proliferation with two different assays to reduce subjective factors. First, cell proliferation was monitored using CellomicsArrayScan VTI for five consecutive days (Figure 2C and 2D). These results showed a distinct reduction in cell proliferation starting 48 h after the cells were treated with RDH10-shRNA compared with Scr-shRNA–treated cells. Moreover, the restrictive impact of RDH10-shRNA on proliferation increased over time (Figure 2C and 2D). Second, cell proliferation was assessed by the MTT assay, which showed that the growth rate of RDH10-knockdown cells was lower than Scr-shRNA cells 3, 4 and 5 d after plating (**P< 0.01) (Figure 3A and 3B).
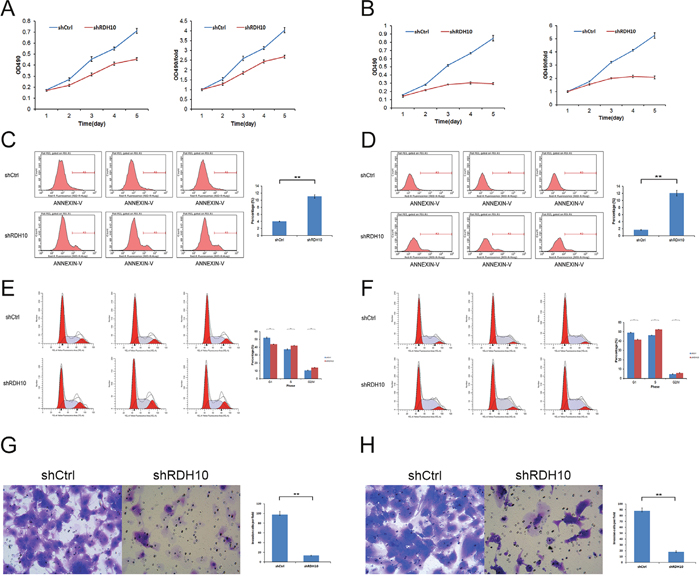
Figure 3: RDH10 is essential for glioma cell proliferation, survival and invasion. (A and B) MTT assays indicated that the growth rates decreased in RDH10-silenced U87 (A) and U251 (B) cells. (C and D) RDH10 knockdown induced apoptosis in U87 (C) and U251 (D) cells. (E and F) RDH10 knock- down induces an S and G2/M cell cycle arrest in U87 (E) and U251 (F) cells. (G and H) Transwell Matrigel invasion assays showed that the number of invasive cells in the RDH10 siRNA group was decreased significantly compared with that in the control group for U87 (G) and U251 (H) cells. All experiments were repeated at least three times. Data are shown as mean ± SD, **P < 0.01.
RDH10 knockdown promotes glioma apoptosis
Resistance to apoptosis is another important feature of cancer cells [31–33]. RDH10 knockdown induced a reduction in cell numbers (Figure 2C and 2D) that was likely due to impaired cell proliferation and/or increased apoptosis. Therefore, we used flow cytometry and Annexin V-APC to assess apoptosis in U87 and U251 cells treated with RDH10-shRNA. The percentage of apoptotic U87 cells was significantly enhanced in the RDH10-shRNA group compared with the Scr-shRNA group (11.06 ± 1.41 % vs 4.03 ± 0.09%, respectively; P = 0.013) (Figure 3C). The percentage of apoptotic U251 cells also significantly increased following RDH10-shRNA treatment compared with Scr-shRNA (12.04 ± 1.12 % vs 1.67 ± 0.12%, respectively; P = 0.0036) (Figure 3D), indicating that RDH10 may have an anti-apoptotic role in glioma cells.
RDH10 knockdown induces glioma cell cycle arrest
To investigate the effect of RDH10 on cell cycle, propidium iodine-stained cells were analyzed by flow cytometry. For U87 cells, the Scr-shRNA group showed the distribution, G0/G1: 51.97%, S: 37.46% and G2/M: 10.58%, and the RDH10-shRNA group showed G0/G1: 43.74%, S: 42.12% and G2/M: 14.14% (Figure 3E). For U251 cells, the Scr-shRNA group showed the profile, G0/G1: 49.1%, S: 46.21% and G2/M: 4.69%, while the RDH10-shRNA group showed G0/G1: 41.6%, S: 52.58% and G2/M: 5.82% (Figure 3F). Suppression of RDH10 in both cell types reduced the number of cells in the G0/G1 phase, and increased the number of cells in the S and G2/M phases, suggesting that RDH10 regulates the cell cycle progression, as its loss causes an S and G2/M phase arrest (**P< 0.01, Figure 3E and 3F).
RDH10 knockdown inhibits glioma cell invasion ability
Next, we evaluated the effect of RDH10 on cell invasion using matrigel-coated trans-well assay. RDH10-shRNA significantly inhibited cell invasion ability of U87 and U251 cells. Invaded cells of Scr-shRNA and RDH10-shRNA groups were 97 ± 6.73 and 13 ± 0.59 in U87 cells, respectively (Figure 3G). Invaded cells of Scr-shRNA and RDH10-shRNA groups were 88 ± 5.04 and 18 ± 1.81 in U251 cells, respectively (Figure 3H) (**P< 0.01). These results indicate that RDH10 knockdown inhibits cell invasion ability in glioma cells.
RDH10 shRNA inhibits glioma cell growth in vivo
To study whether RDH10 silencing affects the growth of glioma cells in vivo, U87 cells transfected with RDH10-shRNA or scrambled-shRNA were inoculated into nude mice to establish xenograft tumor model. The volumes of glioma xenografts with suppressed RDH10 were significantly smaller than the control tumors (Figure 4A). Furthermore, both tumor weight and fluorescence density were significantly lower in the RDH10-shRNA group than in the control Scr-shRNA group (Figure 4B-4C, n=10, P=0.0017 and 0.011, respectively). These results confirmed the in vitro data, and indicated that the increased expression of RDH10 induces glioma development and progression.
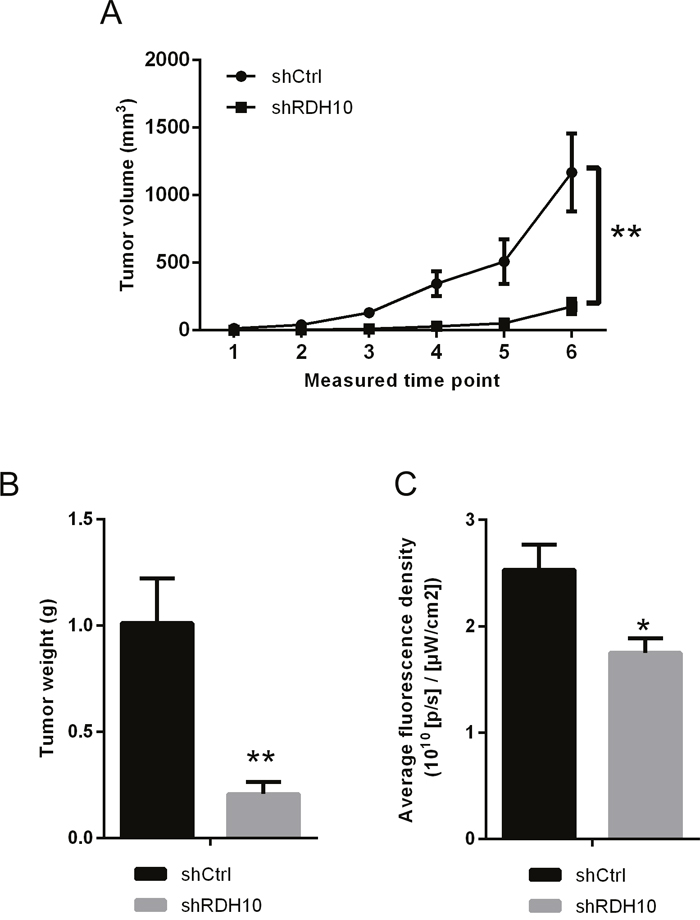
Figure 4: in vivo xenograft models confirmed the effect RDH10 on tumorigenicity. (A) Tumor growth curves of RDH10-shRNA U87 cells compared with control lentivirus infected cells. (B) Tumor weights were compared at the end of the experiment. (C) Fluorescence density of tumors were compared at the end of the experiment. **P <0.01, *P =0.011.
RDH10 regulates expression of glioma genes
To investigate the mechanisms of how RDH10 regulates glioma progression, we performed whole-genome expression microarray on U-87 cells expressing either Scr-shRNA or RDH10-shRNA. We detected 1773 genes that displayed differential expression (corrected P<0.05 and absolute FC≥1.5), including 850 up-regulated genes and 923 down-regulated genes (Figure 5A). According to the Ingenuity Pathway Analysis (IPA) database, RDH10 knockdown affected expression of genes involved in cancer, apoptosis, growth and proliferation, motility and cell cycle (Figure 5B and 5C). Furthermore, RDH10 knockdown significantly repressed several key cancer pathways including TWEAK, TNFR1 and P53 (Figure 5D), indicating that RDH10 regulates malignant phenotypes in human glioma.
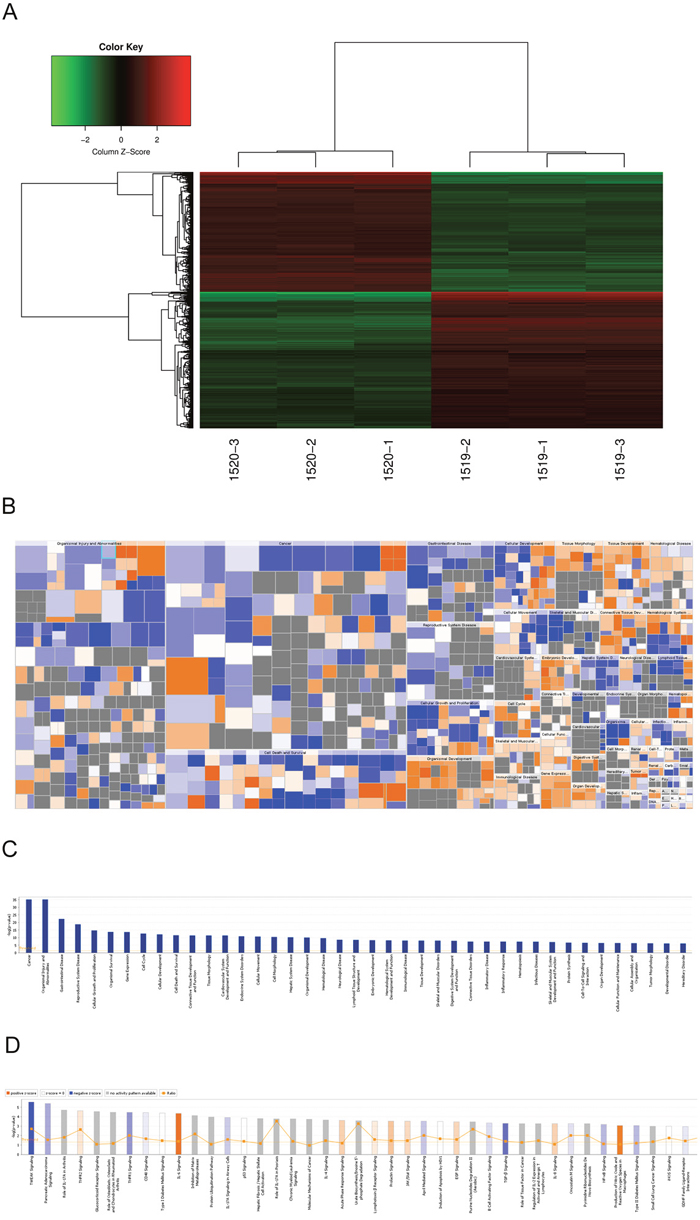
Figure 5: Changes in gene expressions in U-87 cells with RDH10 knockdown by microarray. (A) Heat-map analysis showing 1773 genes that were detected as altered by microarray profiling. corrected P<0.05 and absolute FC >1.5. (B and C) Diseases and functions enrichment of whole-genome expression microarray in RDH10 knockdown U87 cells were analyzed by IPA. (D) Canonical pathways enrichment of whole-genome expression microarray in RDH10 knockdown U87 cells were analyzed by IPA.
RDH10 knockdown inhibits glioma cell growth by down-regulating the TWEAK–NF-κB axis
Previous studies have shown that TWEAK activates NF-κB-dependent genes, including MMP9 [16, 17]. Our microarray analysis indicated that the TWEAK–NF-κB pathway was inhibited after RDH10 knockdown (Figure 5D and 6A). Further analysis of gene and protein levels by qPCR and western blotting validated the microarray data; compared with the control Scr-shRNA group, RDH10 silencing reduced expression of TNFRSF12A (TWEAKR, Fn14), TNFS12 (TWEAK), TRAF3, IKBKB (IKK-β), TGFBR1, and BMPR2, while it increased expression of TRAF1, MAP3K14 (NIK), NFKBIA (IkBα), NFKBIE (IkBε), TNFAIP3, GADD45A, and CDKN1A (Figures 6B-6D). According to the IPA database, IkBα played a central role in the regulation (Figure 6E), and was activated (Figure 6F). Expression of downstream genes involved in cancer development, such as BIRC3, BCL2L1, BCL2L2, CDKN1A, DDIT3, GADD45A, GADD45B, MMP1, MMP2, MMP3, MMP7, RAC1 and YAP1, is shown in Supplementary Table 2. Next, we used the NF-κB agonist fusicoccin to investigate the relationship between RDH10 and NF-κB. We found that increased apoptosis (Figures 7A, 7B) and impaired cellular proliferation (Figure 7C) induced by RDH10 knockdown could be partially rescued by fusicoccin, thus supporting the direct link between RDH10 and NF-κB.
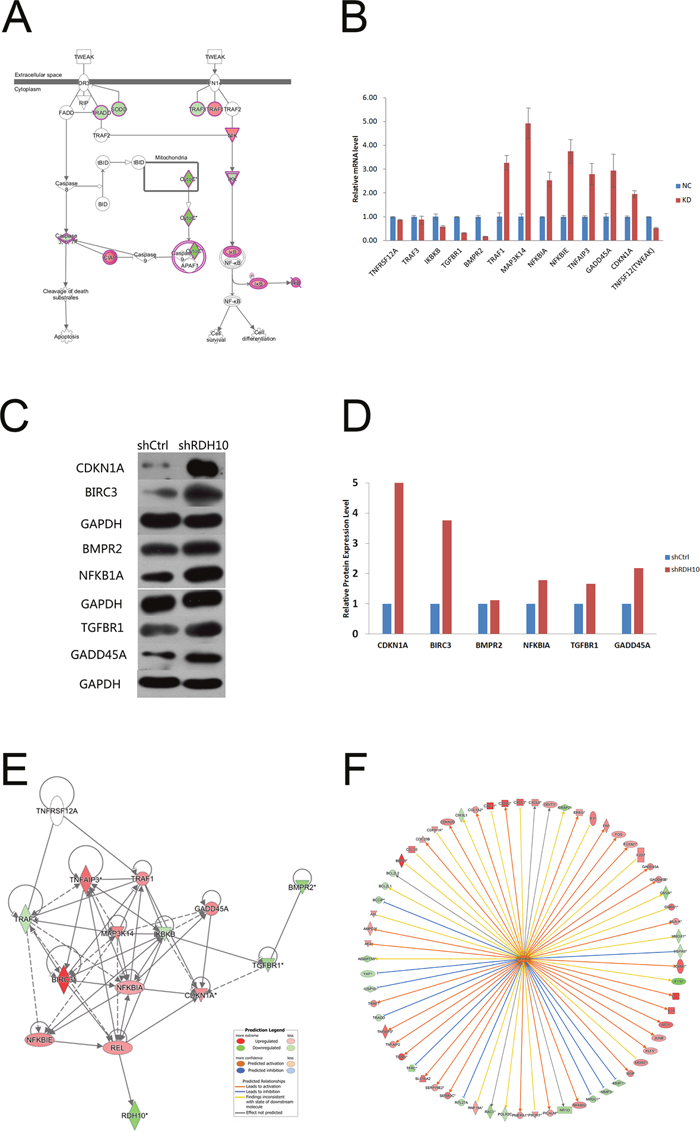
Figure 6: TWEAK–NF-κB signaling pathway was significantly inhibited in RDH10 knockdown U87 cells. (A) IPA showing that TWEAK signaling was one of the most significantly inhibited pathway. (B) qPCR was used to validate the mRNA expression of related genes. (C) Western blotting was used to validate the protein expression levels of related genes. (D) Densitometry showed relative protein expression levels of related genes. (E and F) Gene interaction network of RDH10 and related genes in TWEAK–NF-κB signaling pathway. The results show that NFKBIA is located in the central regulatory position. Data are shown as mean ± SD.
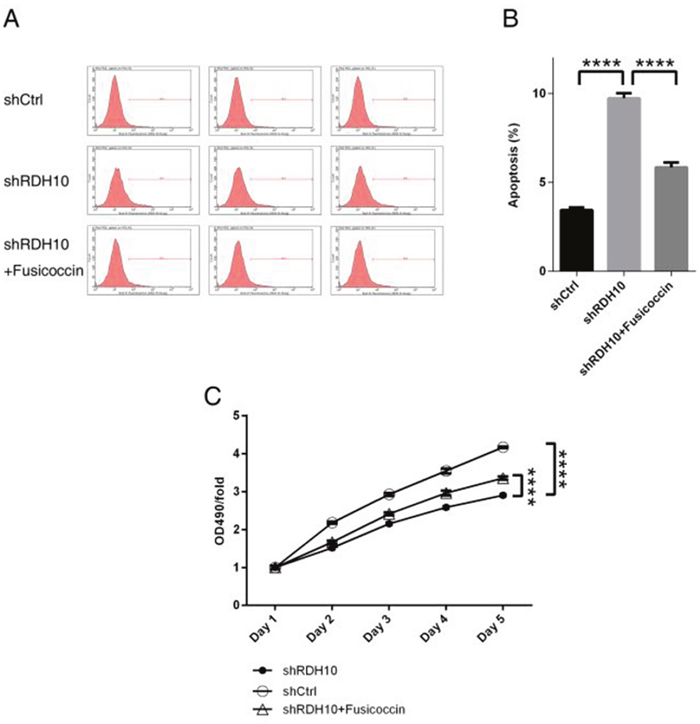
Figure 7: NF-κB agonist rescued abnormal cellular apoptosis and proliferation induced by RDH10 knockdown in U-87 cells. (A-B) NF-κB agonist fusicoccin blocked up-regulated cellular apoptosis mediated by RDH10 knockdown in U87 cells. (C) NF-κB agonist Fusicoccin rescued impaired cellular proliferation status mediated by RDH10 knockdown in U-87 cells. cellular proliferation status was analyzed by MTT assay. ****P <0.0001.
DISCUSSION
Since there are no effective therapies for malignant glioma, it is important to identify new, suitable, therapeutic targets. Only a few tumor types are associated with RDH10. Roles of RDH10 in cancer have been investigated in hepatocellular cancer cell line (HepG2), which showed that RDH10 over-expression inhibited cell growth. Reports of lung cancer showed that RDH10 mutations were common in malignant non-small-cell lung cancer [34–36]. RDH10 plays an important role in the synthesis of RA, which regulates cell proliferation and differentiation. The key molecules in RA signaling regulate biological behavior of glioma stem-like cells (GSCs), such as proliferation, invasion, and angiogenesis. RA also inhibits GSCs proliferation, invasion, lumen formation, and secretion of vascular endothelial growth factor, and reduces formation of angiogenic mimicry, thus promoting differentiation of GSCs and inhibiting their growth [37, 38]. High-dose RA treatment can efficiently inhibit solid tumor formation [39, 40]. Yet, contrary to expectations, RA did not have a beneficial effect in primary clinical trials for glioma patients [41, 42], and neither the combination of RA with temozolomide [43] nor radiotherapy [44] were successful [45, 46]. However, it was unclear whether the poor effect of RA treatment in glioma patients was associated with the RDH10 expression.
In this study, we analyzed the biological function of RDH10 in human gliomas. Analysis of GE-mini dataset demonstrated that the expression of RDH10 is increased in gliomas compared to normal brain tissues, especially in GBM [29]. In addition, high RDH10 expression was associated with malignant progression and poor prognosis in glioma patients, indicating that RDH10 may regulate human glioma development and progression. Our in vitro data demonstrated that RDH10 suppression inhibited glioma cell survival, proliferation, and invasion ability. In vivo, RDH10 suppression significantly reduced xenograft tumor growth. Together, our results demonstrate that RDH10 induces survival, proliferation, and invasion of glioma cells, both in vivo and in vitro.
The above results indicate that RDH10 is a potential oncogene in gliomas. To elucidate the mechanism as to how RDH10 promotes glioma cell proliferation and survival, we performed a whole-genome expression microarray in glioma cells with suppressed RDH10. As predicted, we found that RDH10 regulates a cluster of genes and signaling pathways related to cancer cell proliferation and survival. Based on the IPA database, the TWEAK signaling pathway ranked as the most inhibited pathway in RDH10-suppressed cells (Figures 5 and 6). The TWEAK/Fn14 signaling axis has been previously associated with tumor growth and metastasis, and therapeutic agents that target TWEAK or Fn14 are in development for use in cancer [47–49]. Previous studies have also shown that the TWEAK signaling plays a key role in glioma development and progression via the TWEAK–NF-κB axis [16, 50].
Our data demonstrate that RDH10 silencing suppresses TNFRSF12A (TWEAKR, Fn14), TNFSF12 (TWEAK), TRAF3, IKBKB (IKKβ), TGFBR1, and BMPR2 expression, while it increases TRAF1, MAP3K14 (NIK), NFKBIA (IκBα), NFKBIE (IκBε), TNFAIP3, GADD45A, and CDKN1A expression (Figures 6A–6C). These results are consistent with the previous studies indicating that the TWEAK–NF-κB axis is important for glioma development [16, 35]. Furthermore, we found that NF-κB activation blocked shRDH10-induced apoptosis and partially rescued impaired glioma cell proliferation of shRDH10-treated cells. Gene interaction network analysis and IPA analysis indicated that IκBα is in the center of this regulatory network; its downstream targets, including MMP family members, BCL2L1 (BCL-X) and BCL2L2 (BCL-W), were decreased (Figure 6D and 6E; Supplymentary Table 3). These results are consistent with previous studies [16, 35], and demonstrate that RDH10 promotes glioma progression through the TWEAK–NF-κB axis.
This is the first report that demonstrates the positive correlation between RDH10 expression and glioma progression and grades. Our results show that RDH10 knockdown inhibits glioma cell proliferation, survival, cell cycle, and invasion. In addition, microarray data demonstrate that RDH10 regulates multiple cancer-related genes and pathways, including the TWEAK –NF-κB axis. Together, our results indicate that RDH10 induces glioma development and progression, and suggest that it may serve as a potential novel target for human glioma treatment.
MATERIALS AND METHODS
Glioma samples and RDH10 immunohistochemistry (IHC)
We collected 150 tumor samples for our research, which was approved by the ethics committee of Beijing Tiantan Hospital, CMU; the different glioma grades were equally represented in the 150 samples. We used IHC to stain the formalin-fixed, paraffin-embedded tissues. Each slide was scored by the area and degree of positive staining. For statistical analysis, RDH10 staining was scored as follows: − (<5% positive nuclei) and + (6–100 % positive nuclei). We used SPSS17.0 to analyze the relationship between RDH10 expression and WHO gliomas grade. Statistical significance was calculated with Generalized Linear Model Regression (P<0.05).
TCGA gene expression data
RDH10 expression in human glioma specimens was analyzed using publicly available TCGA Illumina RNA-Seq datasets from 667 glioma patients linked with their clinical parameters and follow-up information. We applied linear regression to study the gene expression and ordinal data analysis to analyze the association between RDH10 expression and WHO grades. We used Kaplan–Meier survival curves of the low- and high-risk groups separated by the level of RDH10 expression. Additionally, the log-rank test was applied to test the significance of differences in the survival curves between the two groups.
Cell culture
Human glioma cell lines U87 and U251 were obtained from ATCC (Manassas, VA, USA). Cells were cultured in Dulbecco’s modified Eagle’s medium (Hyclone, Logan, UT, USA) supplemented using 10% fetal bovine serum (Hyclone, Logan, UT, USA) at 37°C in a humidified atmosphere containing 5% CO2.
RDH10 shRNA design and lentiviral construction
We designed RDH10-shRNA sequences and constructed lentiviruses expressing these RDH10-shRNAs to inhibit RDH10 expression. The most effective RDH10-targeting shRNA had the target sequence: 5'-TACGATGCTGGAGATTAAT-3'and the sequence of Scr-shRNA was5'-TTCTCCGAACGTGTCACGT-3'. The pGCL-GFP-Lentivirus used to express shRNAs was purchased from Shanghai GenechemCo. Ltd. (Shanghai, China).
RNA isolation and qPCR
Total RNA was extracted with TRIzol reagent (Invitrogen, Carlsbad, CA, USA). Approximately 2 μg of total RNA was reverse-transcribed into cDNA. PCR amplification was performed in triplicates with SYBR Master Mix (Takara, Shiga, Japan) using a Bio-Rad CFX96 qPCR detection system (Bio-Rad Laboratories, Hercules, CA, USA). Primer sequences are listed in Supplementary Table 3.
Western blot analysis
We used standard techniques to perform western blotting, using GAPDH as a control for whole-cell lysates. Antibodies were the following: RDH10 (ab174340, Abcam, Cambridge, UK), CDKN1A (ab7960, Abcam), BIRC3 (ab32059, Abcam), BMPR2 (ab130206, Abcam), NFKBIA (ab7217, Abcam), TGFBR1 (ab31013, Abcam), GADD45A (ab180768, Abcam) and GAPDH (sc-32233, Santa Cruz Biotechnology, Dallas, TX, USA).
Cell proliferation and analysis
After cells were treated with RDH10-shRNA or Scr-shRNA lentiviruses, they were incubated at 2000 cells per well in 96-well plates. We next used ArrayScan™ HCS (ThermoFisher, Waltham, MA, USA) to collect fluorescence images of each cell at 24h intervals for 5 d, and counted cell numbers in each well to create growth curves for each condition.
MTT assay
We incubated cells seeded in 96-well plates at an initial density of 2000 cells per well. At each time point, 20 μL of MTT (5 mg/mL tetrazolium bromide, GE Healthcare, Little Chalfont, UK) was added into each well. After 4-h incubation, we added 150 μL of DMSO to solubilize the crystals for 20 min and the absorbance at 570 nm was recorded by an ELISA plate reader (Model 680, Bio-Rad Laboratories). For NF-κB activation, agonist fusicoccin was added 24 hours after cells were treated with RDH10-shRNA or Scr-shRNA lentivirus at a final concentration of 20 μM.
Cell cycle analysis
Cell cycle profiles were examined using flow cytometry. First, cells treated with RDH10 -shRNA or Scr-shRNA were collected and fixed with cold 70 % alcohol for 30 min. Then, the cells were washed twice using PBS and dyed using propidium iodine, and then incubated with RNase in PBS. The suspension was filtered with a nylon mesh, and at least 1 × 10⁵ stained cells were analyzed by flow cytometry (Becton-Dickinson, Franklin Lakes, NJ, USA), and triplicate experiments were performed.
Apoptosis analysis
Apoptosis was assayed by Annexin V-APC staining and detected by flow cytometry (Becton-Dickinson). For apoptosis analysis, cells were stained in 100 μL binding buffer containing 5 μL Annexin V-APC and 10μL propidium iodine (20 ng/mL), and then cultured in the dark at room temperature for 10–15 min. Apoptosis rates were measured by flow cytometry within 1 h.
Cell invasion assay
Cells transfected with shRDH10 or shCtrl were collected, and a total of 1 × 10⁵ cells were seeded onto Corning® BioCoat™ Matrigel®™ Invasion Chambers (Corning, USA). Invasion of the cells through Matrigel to the underside was assessed 16 h (U87) and 40 h (U251) by staining with GIEMSA and counting cells under a microscope. The mean number of invaded cells per field was determined in nine fields per filter. Cells were counted under a light microscope. Assays were performed three times using triplicate wells.
Microarray detection and data analysis
All microarray experiments were performed at Genechem (Shanghai, China) using RNA isolated from RDH10-shRNA and scr-shRNA U-87 cells. We used human GeneChip PrimeView (Affymetrix, Santa Clara, CA, USA) for microarray detection in accordance with the manufacturer’s protocols. Arrays were scanned with a GeneChip Scanner 3000 (Affymetrix) to generate original data. We selected differentially expressed genes between RDH10-shRNA and Scr-shRNA cells using BH corrected P <0.05 and absolute FC>1.5. Pathway analysis, diseases and functions analysis, networks analysis and upstream genes analysis were performed by IPA.
Animal experiments
Animal experiments were performed with 5-week-old BALB/c-A nude mice, which were purchased from Vital River Laboratories China. All procedures were conducted in accordance with the Chinese Council on Animal Care, and the protocol was approved by Beijing Tiantan Hospital, CMU. U87 cells (3 × 10⁶) were subcutaneously implanted into the right axillary region of nude mice to generate xenograft tumors. The mice were divided into two groups, RDH10-shRNA and Scr-shRNA (n=10). When the tumor size approached 100 mm3 (~32 d), we measured tumor diameters with Vernier calipers every 48 h. Tumor volume was calculated by the following formula: v(mm3) = length×width2 ÷ 2. We harvested tumors for comprehensive analysis after 45 d.
Statistical analysis
Statistical data were analyzed with the SPSS17.0 software package. All values were expressed as mean ± standard deviation (SD). The analysis of RDH10 expression in human tissue samples was performed using the survival analyses, generalized linear model, and Fisher’s exact test. All experiments were repeated at least three times and statistical significance was considered at P < 0.05.
Abbreviations
Capital Medical University (CMU), Fluorescence activated Cell Sorting (FACS), fold change (FC), glioblastoma (GBM), Genotype-Tissue Expression (GTEx), glioma stem-like cells(GSCs), High Content Screening (HCS), high-grade gliomas (HGG), Ingenuity Pathway Analysis (IPA), low-grade gliomas (LGG), The Cancer Genome Atlas (TCGA), World Health Organization (WHO)
Author contributions
Junting Zhang and Feng Guan designed the study. Junting Zhang wrote the discussion. Feng Guan, Liang Wang, Zhen Wu and Guijun Zhang collected the glioma samples. Quan Zhou and Hong Chang performed the IHC analysis. Jian Bai and Feng Guan analyzed the TCGA gene expression data and microarray processing. Shuyu Hao performed the Western blotting and real-time PCR. Feng Guan, Junpeng Ma and Kaibin Tian did the cell culture and analysis of cell proliferation, cell cycle, apoptosis and invasion. Zhuang Kang performed the animal experiments. Hui Yin and Da Li performed the statistical data analysis.
CONFLICTS OF INTEREST
The authors have no conflicts of interest to disclose.
FUNDING
This study was supported by the Research Special Fund for Public Welfare Industry of Health of China (201402008).
REFERENCES
1. Surawicz TS, McCarthy BJ, Kupelian V, Jukich PJ, Bruer JM, Davis FG. Descriptive epidemiology of primary brain and CNS tumors: results from the Central Brain Tumor Registry of the United States, 1990-1994. Neuro Oncol. 1999; 1: 14-25. https://doi.org/10.1093/neuonc/1.1.14.
2. Ostrom QT, Gittleman H, Farah P, Ondracek A, Chen Y, Wolinsky Y, Stroup NE, Kruchko C, Barnholtz-Sloan JS. CBTRUS statistical report: primary brain and central nervous system tumors diagnosed in the United States in 2006–2010. Neuro Oncology. 2013;15: ii1–56. https://doi.org/10.1093/neuonc/not151.
3. Goodenberger ML, Jenkins RB. Genetics of adult glioma. Cancer Genet. 2012; 205: 613-621. https://doi.org/10.1016/j.cancergen.2012.10.009.
4. Omuro A, DeAngelis LM. Glioblastoma and other malignant gliomas: a clinical review. JAMA. 2013; 310: 1842–1850. https://doi.org/10.1001/jama.2013.280319.
5. Ohgaki H. Epidemiology of brain tumors. Methods Mol Biol. 2009; 472: 323–342. https://doi.org/10.1007/978-1-60327-492-0_14.
6. Grossman SA, Ye X, Piantadosi S, Desideri S, Nabors LB, Rosenfeld M, Fisher J. Survival of patients with newly diagnosed glioblastoma treated with radiation and temozolomide in research studies in the United States. Clin Cancer Res. 2010; 16: 2443–2449. https://doi.org/10.1158/1078-0432.CCR-09-3106.
7. Fine HA. New Strategies in Glioblastoma: Exploiting the New Biology. Clin Cancer Res. 2015; 21: 1984-8. https://doi.org/10.1158/1078-0432.CCR-14-1328.
8. Wu BX, Chen Y, Fan J, Rohrer B, Crouch RK, Ma JX. Cloning and characterization of a novel all-trans-retinol short-chain dehydrogenase/reductase from the RPE. Invest Ophthalmol Vis Sci. 2002; 43: 3365–3372. http://iovs.arvojournals.org/article.aspx?articleid=2123354.
9. Sandell LL, Sanderson BW, Moiseyev G, Johnson T, Mushegian A, Young K, Rey JP, Ma JX, Staehling-Hampton K, Trainor PA. RDH10 is essential for synthesis of embryonic retinoic acid and is required for limb, craniofacial, and organ development. Genes Dev. 2007; 21: 1113-1124. https://doi.org/10.1101/gad.1533407.
10. Blomhoff R, Blomhoff HK. Overview of retinoid metabolism and function. J Neurobiol. 2006; 66: 606–630. https://doi.org/10.1002/neu.20242.
11. Liden M, Eriksson U. Understanding retinol metabolism: structure and function of retinol dehydrogenases. J Biol Chem. 2006; 281: 13001-13004. https://doi.org/10.1074/jbc.R500027200.
12. Wiley SR, Winkles JA. TWEAK, a member of the TNF superfamily, is a multifunctional cytokine that binds the TweakR/Fn14 receptor. Cytokine & Growth Factor Rev. 2003; 14: 241-249. https://doi.org/10.1016/S1359-6101(03)00019-4.
13. Watts GS, Tran NL, Berens ME, Bhattacharyya AK, Nelson MA, Montgomery EA, Sampliner RE. Identification of Fn14/TWEAK receptor as a potential therapeutic target in esophageal adenocarcinoma. Int J Cancer. 2007; 121: 2132–2139. https://doi.org/10.1002/ijc.22898.
14. Pettersen I, Baryawno N, Abel F, Bakkelund WH, Zykova SN, Winberg JO, Moens U, Rasmuson A, Kogner P, Johnsen JI, Sveinbjörnsson B. Expression of TWEAK/Fn14 in neuroblastoma: implications in tumorigenesis. Int J Oncol. 2013; 42: 1239–1248. https://doi.org/10.3892/ijo.2013.1800.
15. Saitoh T, Nakayama M, Nakano H, Yagita H, Yamamoto N, Yamaoka S. TWEAK induces NF-kappaB2 p100 processing and long lasting NF-kappaB activation. J Biol Chem. 2003; 278: 36005–36012. https://doi.org/10.1074/jbc.M304266200.
16. Cherry EM, Lee DW, Jung JU, Sitcheran R. Tumor necrosis factor-like weak inducer of apoptosis (TWEAK) promotes glioma cell invasion through induction of NF-κB-inducing kinase (NIK) and noncanonical NF-κB signaling. Molecular Cancer. 2015; 14: 9. https://doi.org/10.1186/s12943-014-0273-1.
17. Sun SC. Non-canonical NF-kappaB signaling pathway. Cell Res. 2011; 21: 71–85. https://doi.org/10.1038/cr.2010.177.
18. Brown SA, Richards CM, Hanscom HN, Feng SL, Winkles JA. The Fn14 cytoplasmic tail binds tumour-necrosis-factor-receptor-associated factors 1, 2, 3 and 5 and mediates nuclear factor-kappaB activation. Biochem J. 2003; 371: 395-403. https://doi.org/10.1042/BJ20021730.
19. Xia Y, Shen S, Verma IM. NF-κB, an active player in human cancers. Cancer Immunol Res. 2014; 2: 823-830. https://doi.org/10.1158/2326-6066.CIR-14-0112.
20. Sun SC. Controlling the fate of NIK: a central stage in noncanonical NF-kappaB signaling. Sci Signal. 2010; 3: pe18. https://doi.org/10.1126/scisignal.3123pe18.
21. Qing G, Qu Z, Xiao G. Stabilization of basally translated NF-kappaB-inducing kinase (NIK) protein functions as a molecular switch of processing of NF-kappaB2 p100. J Biol Chem. 2005; 280: 40578–40582. https://doi.org/10.1074/jbc.M508776200.
22. Uno M, Saitoh Y, Mochida K, Tsuruyama E, Kiyono T, Imoto I, Inazawa J, Yuasa Y, Kubota T, Yamaoka S. NF-kappaB inducing kinase, a central signaling component of the non-canonical pathway of NF-kappaB, contributes to ovarian cancer progression. PLoS One. 2014; 9: e88347. https://doi.org/10.1371/journal.pone.0088347.
23. Fusco AJ, Savinova OV, Talwar R, Kearns JD, Hoffmann A, Ghosh G. Stabilization of RelB requires multidomain interactions with p100/p52. J Biol Chem. 2008; 283: 12324–12332. https://doi.org/10.1074/jbc.M707898200.
24. Takeiri M, Horie K, Takahashi D, Watanabe M, Horie R, Simizu S, Umezawa K. Involvement of DNA binding domain in the cellular stability and importin affinity of NF-kappaB component RelB. Org Biomol Chem. 2012; 10: 3053–3059. https://doi.org/10.1039/c2ob07104e.
25. Roos A, Dhruv HD, Mathews IT, Inge LJ, Tuncali S, Hartman LK, Chow D, Millard N, Yin HH, Kloss J, Loftus JC, Winkles JA, Berens ME, et al. Identification of aurintricarboxylic acid as a selective inhibitor of the TWEAK-Fn14 signaling pathway in glioblastoma cells. Oncotarget. 2017; 8: 12234-12246. https://doi.org/10.18632/oncotarget.14685.
26. Armstrong CL, Galisteo R, Brown SA, Winkles JA. TWEAK activation of the non-canonical NF-κB signaling pathway differentially regulates melanoma and prostate cancer cell invasion. Oncotarget. 2016; 7: 81474-81492. https://doi.org/10.18632/oncotarget.13034.
27. Perez JG, Tran NL, Rosenblum MG, Schneider CS, Connolly NP, Kim AJ, Woodworth GF, Winkles JA. The TWEAK receptor Fn14 is a potential cell surface portal for targeted delivery of glioblastoma therapeutics. Oncogene. 2016; 35: 2145-55. https://doi.org/10.1038/onc.2015.310.
28. Friedmann-Morvinski D, Narasimamurthy R, Xia Y, Myskiw C, Soda Y, Verma IM. Targeting NF-κB in glioblastoma: A therapeutic approach. Science Advances. 2016; 2: e1501292. https://doi.org/10.1126/sciadv.1501292.
29. Tang Z, Li C, Zhang K, Yang M, Hu X. GE-mini: a mobile APP for large-scale gene expression visualization. Bioinformatics. 2017; 33: 941-943. https://doi.org/10.1093/bioinformatics/btw775.
30. Louis DN, Ohgaki H, Wiestler OD, Cavenee WK, Burger PC, Jouvet A, Scheithauer BW, Kleihues P. The 2007 WHO classification of tumours of the central nervous system. Acta Neuropathol. 2007; 114: 97-109. https://doi.org/10.1007/s00401-007-0243-4.
31. Hanahan D, Weinberg RA. Hallmarks of cancer: the next generation. Cell. 2011; 144: 646-674. https://doi.org/10.1016/j.cell.2011.02.013.
32. Enderling H, Hahnfeldt P. Cancer stem cells in solid tumors:is ‘evading apoptosis’ a hallmark of cancer? Prog Biophys Mol Biol. 2011; 106: 391–399. https://doi.org/10.1016/j.pbiomolbio.2011.03.007.
33. Fernald K, Kurokawa M. Evading apoptosis in cancer. Trends Cell Biol. 2013; 23: 620-633. https://doi.org/10.1016/j.tcb.2013.07.006.
34. Gauchotte G, Lacomme S, Brochin L, Tournier B, Cahn V, Monhoven N, Piard F, Klein M, Martinet N, Rochette-Egly C, Vignaud JM. Retinoid acid receptor expression is helpful to distinguish between adenoma and well-differentiated carcinoma in the thyroid. Virchows Arch. 2013; 462: 619-32. https://doi.org/10.1007/s00428-013-1419-z.
35. Rossi E, Picozzi P, Bodega B, Lavazza C, Carlo-Stella C, Marozzi A, Ginelli E. Forced expression of RDH10 gene retards growth of HepG2 cells. Cancer Biol Ther. 2007; 6: 238-244. http://dx.doi.org/10.4161/cbt.6.2.3625.
36. Bankovic J, Stojsic J, Jovanovic D, Andjelkovic T, Milinkovic V, Ruzdijic S, Tanic N. Identification of genes associated with non-small-cell lung cancer promotion and progression. Lung Cancer.2010; 67: 151-9. https://doi.org/10.1016/j.lungcan.2009.04.010.
37. Ling GQ, Liu YJ, Ke YQ, Chen L, Jiang XD, Jiang CL, Ye W. All-trans retinoic acid impairs the vasculogenic mimicry formation ability of U87 stem-like ceHs through promoting differentiation. Mol Med Rep. 2015; 12: 165-172. https://doi.org/10.3892/mmr.2015.3449.
38. Karsy M, Albert L, Murali R, Jhanwar-Uniyal M. The impact of arsenic trioxide and all-trans retinoic acid on p53 R273H-codon mutant glioblastoma. Tumour Biol. 2014; 35: 4567-4580. https://doi.org/10.1007/s13277-013-1601-6.
39. Brtko J. Role of retinoids and their cognate nuclear receptors in breast cancer chemo-prevention. Cent Eur J Public Health. 2007; 15: 3–6. http://apps.szu.cz/svi/cejph/show_en.php?kat=obsah/2007-1.
40. Kast RE. Potential for all-trans retinoic acid (tretinoin) to enhance interferon-alpha treatment response in chronic myelogenous leukemia, melanoma, myeloma and renal cell carcinoma. Cancer Biol Ther. 2008; 7: 1515-1519. http://dx.doi.org/10.4161/cbt.7.10.6573.
41. Defer GL, Adle-Biassette H, Ricolfi F, Martin L, Authier FJ, Chomienne C, Degos L, Degos JD. All-trans retinoic acid in relapsing malignant gliomas: clinical and radiological stabilization associated with the appearance of intratumoral calcifications. J Neurooncol. 1997; 34: 169-177. https://link.springer.com/article/10.1023%2FA%3A1005701507111?LI=true.
42. Zang C, Wächter M, Liu H, Posch MG, Fenner MH, Stadelmann C, von Deimling A, Possinger K, Black KL, Koeffler HP, Elstner E. Ligands for PPARgamma and RAR cause induction of growth inhibition and apoptosis in human glioblastomas. J Neurooncol. 2003; 65 : 107-118. https://link.springer.com/article/10.1023/B:NEON.0000003728.80052.a8.
43. Jaeckle KA, Hess KR, Yung WKA, Greenberg H, Fine H, Schiff D, Pollack IF, Kuhn J, Fink K, Mehta M, Cloughesy T, Nicholas MK, Chang S, et al. Phase II Evaluation of Temozolomide and 13-cis-Retinoic Acid for the Treatment of Recurrent and Progressive Malignant Glioma: A North American Brain Tumor Consortium Study. J Clin Oncol. 2003; 21: 2305-2311. https://doi.org/10.1200/JCO.2003.12.097.
44. Phuphanich S, Scott C, Fischbach AJ, Langer C, Yung WK. All-trans-retinoic acid: a phase II Radiation Therapy Oncology Group study (RTOG 91-13) in patients with recurrent malignant astrocytoma. J Neurooncol. 1997; 34: 193-200. https://link.springer.com/article/10.1023%2FA%3A1005765915288?LI=true.
45. Wismeth C, Hau P, Fabel K, Baumgart U, Hirschmann B, Koch H, Jauch T, Grauer O, Drechsel L, Brawanski A, Bogdahn U, Steinbrecher A. Maintenance therapy with 13-cis retinoid acid in high-grade glioma at complete response after first-line multimodal therapy--a phase-II study. J Neurooncol. 2004; 68: 79-86. https://link.springer.com/article/10.1023/B:NEON.0000024748.26608.2f.
46. See SJ, Levin VA, Yung WK, Hess KR, Groves MD. 13-cis-Retinoic acid in the treatment of recurrent glioblastoma multiforme. Neuro Oncol. 2004; 6: 253-258. https://doi.org/10.1215/S1152851703000607
47. Winkles JA. The TWEAK-Fn14 cytokine-receptor axis: discovery, biology and therapeutic targeting. Nat Rev Drug Disc. 2008; 7: 411-425. https://doi.org/10.1038/nrd2488.
48. Cheng E, Armstrong CL, Galisteo R, Winkles JA. TWEAK/Fn14 axis-targeted therapeutics: Moving basic science discoveries to the clinic. Front Immunol. 2013; 4: 473. https://doi.org/10.3389/fimmu.2013.00473.
49. Wajant H. The TWEAK-Fn14 system as a potential drug target. British J Pharm. 2013; 170: 748-764. https://doi.org/10.1111/bph.12337.
50. Tran NL, McDonough WS, Savitch BA, Sawyer TF, Winkles JA, Berens ME. The tumor necrosis factor-like weak inducer of apoptosis (TWEAK)-fibroblast growth factor-inducible 14 (Fn14) signaling system regulates glioma cell survival via NFkappaB pathway activation and BCL-XL/BCL-W expression. J Biol Chem. 2005; 280: 3483-3492. https://doi.org/10.1074/jbc.M409906200.