
INTRODUCTION
CD4+Foxp3+ regulatory T (Treg) cells are crucial for maintaining immune homeostasis and self-tolerance due to their ability to suppress T cell responses. Consequently, mice and humans lacking Treg cells suffer from autoimmune and inflammatory disorders [1, 2]. Besides their well-established role in suppressing autoreactive T cells, Treg cells also fulfill diverse roles promoting or preventing effective immune responses upon infection [3]. Treg cell abundance is tightly balanced for optimal pathogen-specific responses [3]. Treg cell numbers are transiently decreased in many acute infections to allow an optimal immune response and increased Treg cell numbers or activity can impair effector T cell responses resulting in pathogen persistence. Thus, in acute lymphocytic choriomeningitis virus (LCMV) infection, a failure to reduce Treg cell abundance impairs anti-viral T cell responses [4] and in persistent LCMV infection, increased Treg cell numbers contribute to dysregulated T cell responses, which are restored upon Treg cell depletion [5–7]. Most interestingly however, the appropriate magnitude and quality of the Treg cell response can be beneficial for the host by allowing the localization of effector immune cells into lymph nodes and infected tissues [8] and by supporting memory T cell formation [9–11].
Treg cells can be broadly divided into naive-like/central CD44loCD62Lhi Treg cells and activated CD44hiCD62Llo/- Treg cells [12, 13]. Treg cells leaving the thymus belong to the naive-like Treg cell population, characterized by quiescence, expression of high levels of antiapoptotic molecules and recirculation through secondary lymphoid tissues. Treg cells differentiate into more suppressive CD44hi Treg cells upon T cell receptor-mediated activation in the presence of inflammatory signals [12]. Activated Treg cells are further classified based on their phenotypic and functional diversity. This specialization is controlled by the inflammatory milieu wherein they are activated, similarly to the polarization of CD4+ T helper (Th) cells into Th1, Th2, Th17 and other Th cell subsets [14, 15]. These specialized Treg cells co-differentiate with their related Th cell subsets and are specifically tailored to suppress their respective Th cell subset [14]. Treg cell specialization is regulated by the same transcription factors that also control the differentiation of each specific Th cell subset. In line with this, Treg cells expressing the Th1 specific transcription factor T-bet are essential for suppression of Th1 responses [16] and Treg cells deficient in the Th17 associated transcription factor STAT3 selectively fail to suppress Th17 responses [17]. Treg cells are also heterogeneous with regard to the effector mechanisms they employ to suppress immune responses. These include the production of secreted factors such as IL10, TGFβ, IL35, Granzyme B, fibrinogen-like protein-2 (FGL2) and the up-regulation of inhibitory receptors, such as CTLA4, LAG3 or PD1 and others [14, 15]. The expression of these effector molecules is controlled by specific sets of transcriptional regulators. For example, BLIMP1 is essential for Il10 expression and ICOS up-regulation in Treg cells [18] and ligation of TIGIT on Treg cells results in the up-regulation of C/EBPα and the expression of Fgl2 [19].
Id proteins (Id1-4), especially Id2 and Id3, are major regulators of immune cell development and specialization [20]. Id proteins are transcriptional regulators controlling the activity of the basic helix-loop-helix transcription factors of the E protein family through heterodimerization and subsequent prevention of DNA binding by the E proteins [21, 22]. Specifically Id3 controls T cell differentiation at various stages of development and specification [23–28]. In Treg cells, Id3 maintains Foxp3 expression [29] and together with its related factor Id2 it guarantees Treg cell survival and controls Treg cell homing [28]. Yet, whether Id3 regulates Treg cell specification during immune responses is not known.
In this study, we show that differential expression of the transcriptional regulator Id3 allows the separation of activated CD44hi Treg cells into two transcriptionally and functionally distinct subpopulations. CD44hi Treg cells expressing high Id3 levels (Id3hi) showed a naive-like Treg cell transcriptional profile. In contrast, CD44hi Treg cells with low or absent Id3 expression (Id3lo) transcriptionally and phenotypically resembled effector Treg cells. CD44hiId3lo Treg cells were superior in suppressing Th cell differentiation. Acute LCMV infection promoted the differentiation of Id3hi into Id3lo Treg cells and persistent LCMV infection preferentially increased the abundance of the Id3lo Treg cell subtype. These findings support a specific role of Id3lo Treg cells in contributing to the manifestation of T cell dysfunction during chronic viral infection.
RESULTS
Id3 expression separates Treg cells in two transcriptionally distinct populations
Although the majority of Treg cells express high levels of Id3, recent data suggests the presence of an Id3lo Treg cell population [28]. To detect Id3 expression in Treg cells on a single cell level, we used Id3-GFP reporter mice (Id3GFP/+), expressing GFP under the control of the endogenous Id3 locus [24]. As shown before, about 90% of Treg cells (CD4+CD25+CD45RBlo) in spleen and lymph nodes showed high Id3 expression and around 10% of Treg cells had low to absent Id3 expression under homeostatic conditions (Figure 1a) [28]. To investigate if Id3 expression levels separate Treg cells into distinct subpopulations, we determined the transcriptional profile of sorted Id3lo and Id3hi Treg cells from naive Id3GFP/+ mice. Equal Foxp3 protein expression in Id3lo and Id3hi CD4+CD25+CD45RBlo cells confirmed that both populations were indeed Foxp3 expressing Treg cells (Figure 1b). 373 genes with a greater than 4-fold increased expression in Id3lo compared to Id3hi Treg cells and 130 genes with greater than 4-fold increased expression in Id3hi compared to Id3lo Treg cells were identified by RNA sequencing analysis (Figure 1c). Gene set enrichment analysis (GSEA) of the transcriptional profiles of Id3lo and Id3hi Treg cells with the Treg cell transcriptional signature [30] showed no differences in the expression of Treg cell signature genes (Figure 1d), confirming that both subpopulations belong to the Treg cell lineage. Yet, their substantial difference in gene expression suggests that Id3lo and Id3hi Treg cells are two distinct Treg cell subpopulations.
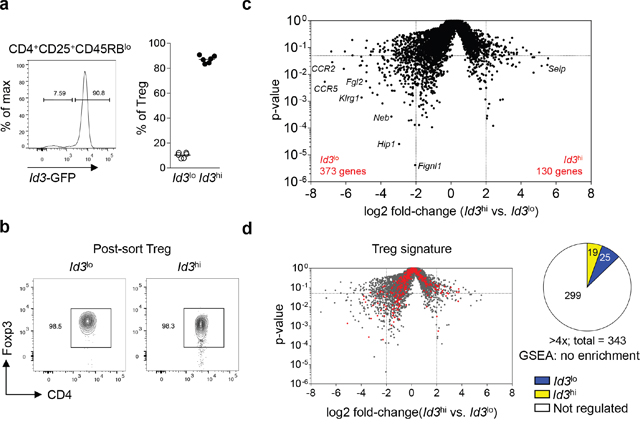
Figure 1: Id3 expression separates Treg cells into two a transcriptionally distinct populations. (a) Id3 expression in splenic Treg cells (CD4+CD25+CD45RBlo) from naive Id3GFP/+ mice using flow cytometry (left) and quantification of the percentage of Id3lo and Id3hi cells among splenic Treg cells (right). Each symbol represents an individual mouse and horizontal lines are the mean. (b) Foxp3 expression of sorted Id3lo and Id3hi splenic Treg cells (CD4+CD25+CD45RBlo) from naive Id3GFP/+ mice by flow cytometry. (c) Volcano plot comparing the p-value versus log2 fold-change in gene expression of Id3hi versus Id3lo Treg cells. (d) Volcano plot from (c) with canonical Treg cell signature genes [30] highlighted in red. Pie chart shows the number of Treg cell signature genes up-regulated more than 4-fold in Id3lo (blue) or Id3hi (yellow) Treg cells.
The transcriptional profile of Id3lo Treg cells indicates a highly activated phenotype
To gain insights into specific functional properties of Id3lo and Id3hi Treg cells, we performed GSEA with known transcriptional profiles of different T cell and Treg cell subpopulations. These analysis showed that Id3lo Treg cells preferentially expressed genes matching the T cell activation and proliferation signature [18, 30] (Figure 2a). Additionally, Id3lo Treg cells expressed genes that are up-regulated upon activation of Treg cells [31] (Figure 2b). Classically, activated Treg cells are separated from naive-like/central CD44loCD62Lhi Treg cells by a CD44hiCD62Llo/- surface phenotype [12]. Alternatively, CD103+KLRG1+ and TIGIT+ Treg cells are highly proliferative and suppressive Treg cell subsets [32, 19]. Comparison of gene expression data showed that the transcriptional signature of Id3lo versus Id3hi Treg cells correlated with: (1) changes in expression occurring during the transition of CD44loCD62Lhi naive-like toCD44hiCD62Llo/- Treg cells [33] (Figure 2c, left), (2) the transcriptional profile of CD103+KLRG1+ Treg cells [32] (Figure 2c, right) and (3) the transcriptional profile of TIGIT+ Treg cells [19], albeit to a lesser extend (Supplementary Figure 1a). As a control, there was no correlation with genes differentially expressed between Treg and CD4+ conventional T cells [30] (Supplementary Figure 1b). Analysis of differential expression of cell surface markers showed that Id3lo Treg cells expressed high levels of KLRG1 and CD103 (Itgae) (Figure 2d), which are exclusively found in highly suppressive effector Treg cells [32]. In contrast, Id3hi Treg cells preferentially expressed selectins E (Sele), L (Sell) and P (Selp) and the chemokine receptor CCR7, which are important for homing and predominantly expressed in naive-like Treg cells (Figure 2d). In summary, Id3lo Treg cells expressed genes predominantly found in activated Treg cells.
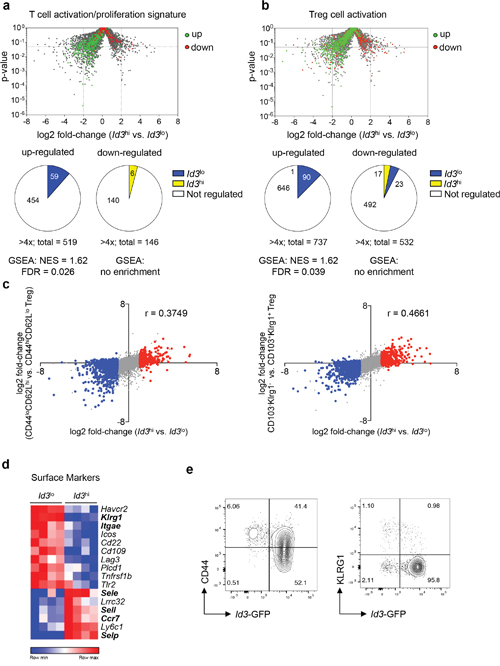
Figure 2: Id3lo Treg cells express a transcriptional profile resembling activated Treg cells. (a, b) Volcano plot from Figure 1c superimposed with genes up- (green) or down-regulated (red) in (a) T cell activation/proliferation transcriptional signatures [30] or (b) in Treg cell activation [31]. Pie charts show the number of genes up-regulated more than 4-fold in Id3lo (blue) or Id3hi (yellow) Treg cells. (c) Difference in transcript abundance in Id3hi versus Id3lo Treg cells plotted against that in CD44loCD62Lhi versus CD44hiCD62Llo Treg cells [33] (left), and plotted against that in CD103-KLRG1- versus CD103+KLRG1+ Treg cells [32] (right). Colors indicate transcripts significantly up-regulated greater than 2-fold in Id3lo (blue) or Id3hi (red) Treg cells. The r-value of Spearman correlation is indicated. (d) Heatmap of genes encoding for surface markers that are differentially (> 4-fold) expressed in splenic Id3hi compared to Id3lo Treg cells (CD4+CD25+CD45RBlo) of naive Id3GFP/+ mice. RNA was obtained from 4 independent experiments. (e) Id3 expression versus CD44 (left) or KLRG1 (right) expression in splenic Treg cells (CD4+CD25+) from naive Id3GFP/+ mice. Data are representative from at least 2 individual mice.
To investigate, if all activated Treg cells were Id3lo, we determined the abundance of Id3lo Treg cells among CD44hi and KLRG1+ Treg cells. As expected from their transcriptional profile, all Id3lo Treg cells expressed high levels of CD44 (Figure 2e), but although their transcriptional profile correlated with that of CD103+KLRG1+ Treg cells only one third of Id3lo Treg cells were KLRG1+ (Figure 2e). Id3hi Treg cells contained CD44lo and CD44hi Treg cells, but almost no KLRG1+ cells (Figure 2e). Thus, highly suppressive KLRG1+ cells predominantly express low Id3 levels, while activated CD44hi Treg cells are separate into two distinct cell populations based on the expression of Id3.
Id3lo Treg cells are highly suppressive effector Treg cells
Specialized Treg cell subpopulations tailored to suppress Th1, Th2, Th17 or follicular helper T (Tfh) cell responses are defined by the expression of specific transcription factors and chemokine receptors [14, 34]. To investigate, if Id3lo Treg cells were enriched for a specific subtype of Treg cells, we analyzed which transcription factors were differentially expressed in Id3lo compared to Id3hi Treg cells. RNA-sequencing analysis revealed that 10 transcriptional regulators were preferentially expressed in Id3hi cells and 30 transcriptional regulators were significantly higher expressed in Id3lo Treg cells (Figure 3a). Interestingly, genes enriched in Id3lo Treg cells included Prdm1, encoding for BLIMP1, which is pivotal for effector Treg cell functions [18], confirming the enrichment of effector Treg cells among the Id3lo Treg subpopulation. Indeed, the transcriptional signature of Id3hi versus Id3lo Treg cells strongly correlated with the transcriptional profile of Prdm1- versus Prdm1+ Treg cells [35] (Figure 3b) suggesting that Id3lo and Prdm1+ Treg cells are highly similar Treg cell populations. The Th1-specific transcription factor Tbx21 (T-bet) and the Th17-specific transcription factors Rorc (RORγ), Arnt2 (ARNT2) and Rorα (RORα) were highly expressed in the Id3lo Treg cell population (Figure 3a). Accordingly, genes up-regulated in Th1-specific CXCR3+ Treg cells were highly expressed in Id3lo Treg cells, whereas genes down-regulated in CXCR3+ Treg cells were mainly expressed in Id3hi Treg cells (Supplementary Figure 1c) [19]. The Th2- and Tfh-specific transcription factors Gata3, Irf4 and Bcl6 were not differentially expressed between Id3lo and Id3hi Treg cells (data not shown), but IRF4-dependent genes [36] were selectively expressed in Id3lo Treg cells (Supplementary Figure 1d). According to their transcription factor profile, Id3lo Treg cells had high expression levels of chemokine receptors associated with Treg cell subsets specialized to target Th1 (CCR5, CXCR3, CXCR6), Th17 (CCR4, CCR2, CXCR6) or Th2 (CCR3) immune responses (Figure 3c). Id3lo Treg cells expressed high levels of the Treg cell effector molecules Fgl2, Gzmb (Granzyme B) and Ebi3 (IL17B) (Figure 3d) and had increased expression of the coinhibitory surface receptors Icos and Lag3 (Figure 3d) providing further support for the effector nature of Id3lo Treg cells. However, Id3lo Treg cells seemed to express a broad spectrum of effector molecules, targeting several Th cell responses. To further investigate this, we compared the suppressive capacity of CD44hiId3hi and CD44hiId3lo Treg cells towards Th cell proliferation and differentiation after exclusion of naive-like CD44loId3hi Treg cells. We co-cultured the purified Treg cell populations with CFSE-labeled CD4+CD25- effector T (Teff) cells under differentiation conditions for Th1, Th2 and Th17 cells. CD44hiId3lo Treg cells more effectively inhibited the proliferation of Teff cells compared to CD44hiId3hi Treg cells irrespective of the cytokine milieu (Figure 3e). Furthermore, CD44hiId3lo Treg cells were superior in inhibiting the differentiation of Th1, Th2 and Th17 cells as shown by lower percentages of IFNγ+, IL13+ and IL17A+ Teff cells in the presence of Id3lo Treg cells (Figure 3f). Taken together, CD44hiId3lo Treg cells are highly suppressive Treg cells and not limited to targeting one specific Th cell response.
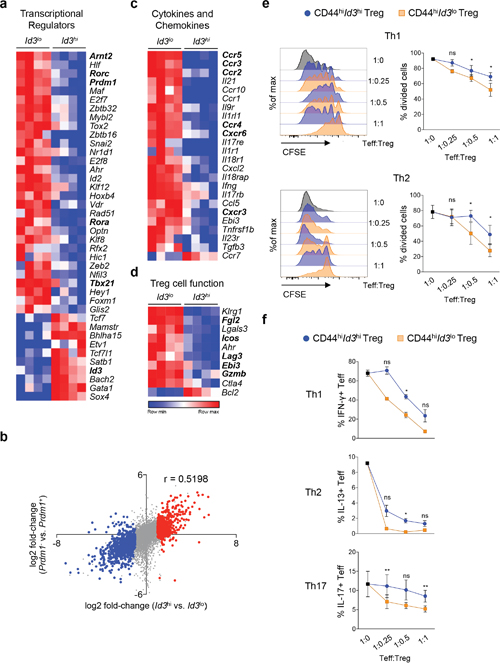
Figure 3: Id3lo Treg cells are highly suppressive. (a) Heatmap of genes encoding for transcriptional regulators that are differentially (> 4-fold) expressed in splenic Id3hi compared to Id3lo Treg cells (CD4+CD25+CD45RBlo) of naive Id3GFP/+ mice. RNA was obtained from 4 independent experiments. (b) Difference in transcript abundance in Id3hi versus Id3lo Treg cells plotted against that in Prdm1- versus Prdm1+ Treg cells [35]. Colors indicate transcripts significantly up-regulated more than 2-fold in Id3lo (blue) or Id3hi (red) Treg cells. The r-value of Spearman correlation is indicated. (c, d) Heatmaps of genes encoding for (c) cytokines, chemokines and their receptors and (d) genes encoding for molecules involved in Treg cell function that are differentially (> 4-fold) expressed in splenic Id3hi compared to Id3lo Treg cells (CD4+CD25+CD45RBlo) of naive Id3GFP/+ mice. RNA was obtained from 4 independent isolations. (e, f) 105 CFSE labeled CD4+ effector T (Teff) cells (Thy1.1) were co-cultured under Th1, Th2 or Th17 cell polarizing conditions with sorted CD44hiId3hi (blue) or CD44hiId3lo (orange) Treg cells (CD4+CD25hi) from IL2/IL2mAb treated Id3GFP/+ mice (Thy1.2). (e) Representative CFSE fluorescence of Teff cells (Thy1.1+) cultured at the indicated Treg/Teff cell ratios and quantification of the percentage of divided Teff cells. Mean ± SEM from 3 independent experiments are shown. *p < 0.05; ns = not significant (paired Student’s t test). (f) Flow cytometric quantification of the percentage of Teff cells (Thy1.1+) expressing IFNγ, IL13 or IL17A after restimulation with PMA/Iono for 4 hours. Mean ± SEM from 3 independent experiments (Th1, Th17) or mean ± SEM from several wells of 1 representative experiment (Th2) are shown. *p < 0.05; **p < 0.01; ns = not significant (Student’s t test).
Viral infection promotes the differentiation of CD44hiId3hi into CD44hiId3lo Treg cells
Inflammation and infection promote the differentiation of Treg cells into specialized effector Treg cells [3]. In this context, IL2 and proinflammatory cytokines increase the abundance of suppressive BLIMP1+ Treg cells [18]. Thus, we hypothesized that the proportion of Id3lo to Id3hi Treg cells should change upon infection. We analyzed Id3 expression in Treg cells upon LCMV infection, since Treg cells critically affect the antiviral response against LCMV [4, 7, 8]. Infection of Id3GFP/+ mice with 200 pfu LCMV WE resulted in a transient increase in the relative abundance of Id3lo to Id3hi Treg cells (Figure 4a). At the peak of the CD8+ T cell response, day 8 post-infection, about 25% of Treg cells were Id3lo and after virus clearance, on day 35 post-infection, percentages of Id3lo and Id3hi Treg cells were comparable to naive mice (Figure 4a). In line with previous studies [4], we confirmed that Treg cell numbers transiently declined during acute LCMV infection (Supplementary Figure 2a). Interestingly, this decline in Treg cell numbers was reflected as a selective loss of Id3hi Treg cells, whereas Id3lo Treg cell numbers were not significantly reduced (Figure 4b). Closer analysis of the relative abundance of CD44lo, CD44hiId3hi and CD44hiId3lo Treg cells showed that the fraction of the quiescent CD44lo Treg cells decreased upon LCMV infection. Strikingly, within the CD44hi Treg cell population, we found a selective increase of CD44hiId3lo Treg cells, whereas the relative abundance of CD44hiId3hi Treg cells remained unchanged (Figure 4c). These data suggest that viral infection promotes the differentiation of Treg cells into the CD44hiId3lo subpopulation.
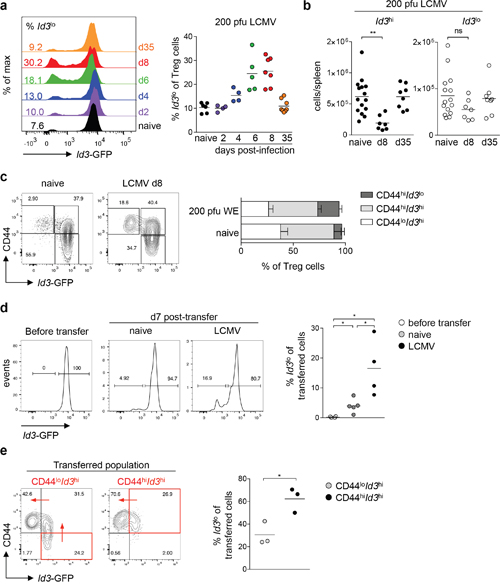
Figure 4: Viral infection promotes the differentiation of CD44hiId3hi to CD44hiId3lo Treg cells. (a) Id3 expression in splenic Treg cells (CD4+CD25+CD45RBlo) from naive Id3GFP/+ mice and Id3GFP/+ mice at the indicated times upon 200 pfu LCMV WE infection using flow cytometry (left) and quantification of the percentage of Id3lo cells among splenic Treg cells (right). Each symbol represents an individual mouse and horizontal lines are the mean. (b) Cell number of Id3hi (left) or Id3lo (right) Treg cells (CD4+CD25+CD45RBlo) in spleens of naive, d8 or d35 LCMV WE (200 pfu) infected Id3GFP/+ mice. Each symbol represents an individual mouse and horizontal lines are the mean. **p < 0.01; ns = not significant (unpaired Student’s t test). (c) Id3 and CD44 expression in splenic Treg cells (CD4+CD25+) and quantification of the percentages of CD44loId3hi, CD44hiId3hi and CD44hiId3lo cells among splenic Treg cells of naive or d8 LCMV WE infected mice. Mean ± SEM from at least 3 individual mice are shown. (d) Id3hi Treg cells (CD4+CD25+CD45RBlo) from naive Id3GFP/+ mice (Thy1.2) were transferred into wt mice (Thy1.1). One day after, mice were left untreated or infected with 200 pfu LCMV WE. Id3 expression of purified Id3hi Treg cells immediately before transfer and of transferred cells (Thy1.2+) 7 days post-transfer in spleens of naive or LCMV WE infected mice (left). Quantification of the percentage of Id3lo cells among splenic transferred cells (right). Each symbol represents the mean of 1-3 mice obtained from 4 independent experiments and horizontal lines are the mean. *p < 0.05 (unpaired Student’s t test). (e) CD44loId3hi and CD44hiId3hi Treg cells (CD4+CD25+CD45RBlo) from naive Id3GFP/+ mice (Thy1.2) were transferred into wt mice (Thy1.1). One day after, mice were infected with 200 pfu LCMV Docile. Id3 and CD44 expression of transferred cells (Thy1.2+) in spleens were analyzed 7 days post-transfer (left). Quantification of the percentage of Id3lo cells among splenic transferred cells (right). For clarity the quadrant of the transferred cell population is marked in red and red arrows indicated the differentiation pathway. Each symbol represents one individual mouse obtained from 2 independent experiments and horizontal lines are the mean.
To determine the lineage relationship between Id3hi and Id3lo Treg cells, we isolated Id3hi and Id3lo Treg cells from naive Id3GFP/+ mice and transferred them into wild-type (wt) recipients. Seven days post-transfer, about 5% of transferred Id3hi Treg cells had differentiated into Id3lo Treg cells (Figure 4d). Interestingly, LCMV infection one day after Treg cell transfer led to an increased differentiation of transferred Id3hi Treg cells into Id3lo Treg cells, resulting in about 20% of Id3lo Treg cells at day 7 post-transfer (Figure 4d). In contrast, we were not able to detect any Id3hi Treg cells in recipients that had received Id3lo Treg cells (Supplementary Figure 2b). Next, we separated the Id3hi Treg cell population based on differential CD44 expression and found a linear differentiation path from CD44loId3hi over CD44hiId3hi to CD44hiId3lo Treg cells seven days post-transfer during LCMV infection (Figure 4e). Taken together, CD44hiId3lo Treg cells are generated from CD44hiId3hi Treg cells and this differentiation is augmented upon viral infection.
IL2 signaling stimulates the differentiation of Id3hi into Id3lo Treg cells
Type I interferons (IFN), abundantly present in the early stages of LCMV infection, inhibit Treg cell proliferation and promote Treg cell activation [4, 37, 38]. Thus, we hypothesized that type I IFNs could play a role in the differentiation of Id3hi to Id3lo Treg cells. Id3hi Treg cells isolated from control Id3GFP/+ or from Ifnar1-/-Id3GFP/+ mice, lacking the type I IFN receptor, were transferred into wt recipients and Id3 expression was analyzed seven days post-transfer. Transferred Ifnar1-/-Id3hi Treg cells differentiated into Id3lo Treg cells to the same extent as transferred control Id3hi Treg cells in naive recipient mice (Figure 5a, left). Again, in LCMV infected host mice a greater percentage of Id3hi Treg cells differentiated into Id3lo Treg cells than in naive mice, however this was independent of type I IFN signaling (Figure 5a, right).
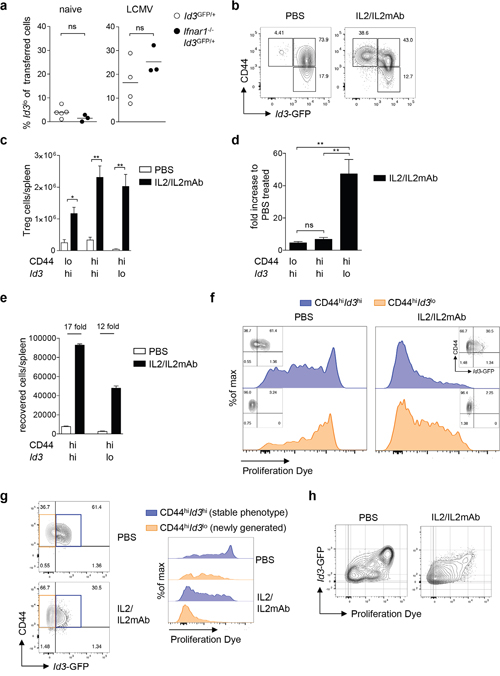
Figure 5: Differentiation into Id3lo Treg cells is promoted by IL2 signaling. (a) Id3hi Treg cells (CD4+CD25+CD45RBlo) purified from naive Id3GFP/+ or Ifnar1-/-Id3GFP/+ mice (Thy1.2) were transferred into wt mice (Thy1.1). One day after transfer, mice were left untreated or infected with 200 pfu LCMV WE. The percentage of Id3lo Treg cells among transferred cells (Thy1.2+) 7 days post-transfer in spleens of naive or LCMV WE infected host mice. Results from 1-3 mice per experiment were pooled and the mean value from each of 3-5 independent experiments is presented by the symbols. The horizontal lines are the mean of all experiments. ns = not significant (unpaired Student’s t test). (b) Id3 and CD44 expression in splenic Treg cells (CD4+CD25+) of PBS or IL2/IL2mAb treated Id3GFP/+ mice at day 5 after treatment. (c) Total cell number of CD44loId3hi, CD44hiId3hi and CD44hiId3lo Treg cells (CD4+CD25+) in spleens of PBS or IL2/IL2mAB treated mice. Mean ± SEM from at least 4 independent experiments are shown. *p < 0.05, **p < 0.01 (unpaired Student’s t test). (d) Fold increase in CD44loId3hi, CD44hiId3hi and CD44hiId3lo Treg cells in IL2/IL2mAb treated mice compared to PBS treated mice. Mean ± SEM from at least 4 independent experiments are shown. **p < 0.01; ns = not significant (unpaired Student’s t test). (e-h) CD44hiId3hi and CD44hiId3lo Treg cells (CD4+CD25+) from IL2/IL2mAb treated Id3GFP/+ mice (Thy1.2) were labeled with a proliferation dye and transferred into wt mice (Thy1.1). Transferred cells (Thy1.2+) were analyzed 7 days post-transfer in the spleens after PBS or IL2/IL2mAB treatment. (e) Absolute numbers of recovered Thy1.2+ cells. (f) Representative analysis of Id3 and CD44 expression (small insets) and proliferation of Thy1.2+ cells recovered after transferring CD44hiId3hi (blue) or CD44hiId3lo (orange) Treg cell populations. (g) Id3 and CD44 expression of recovered Thy1.2+ cells in spleens of PBS or IL2/IL2mAB treated mice that had received CD44hiId3hi Treg cells (left). Representative proliferation analysis of recovered phenotypically stable Thy1.2+CD44hiId3hi (blue) or newly generated Thy1.2+CD44hiId3lo (orange) cells in spleens of PBS or IL2/IL2mAB treated mice that had received CD44hiId3hi Treg cells (right). (h) Representative analysis of Id3 expression versus proliferation of recovered Thy1.2+ cells in spleens of PBS or IL2/IL2mAB treated mice that had received CD44hiId3hi Treg cells.
It has been shown that interleukin-2 (IL2) signaling induces the differentiation into BLIMP1+ effector Treg cells [18]. To test whether the differentiation of Id3hi to Id3lo Treg cells was triggered by IL2, we induced IL2 signaling by injecting complexes of IL2 and anti-IL2 antibody (IL2/IL2mAb) [39] into Id3GFP/+ reporter mice and analyzed splenic Treg cells. We found a strong increase in the relative abundance of Id3lo Treg cells upon IL2/IL2mAb treatment (Figure 5b). Absolute numbers of all Treg cell subsets increased upon treatment (Figure 5c), yet the fold increase in the CD44hiId3lo Treg cell population was 7 to 10-fold higher than in the CD44loId3hi or CD44hiId3hi Treg cell populations (Figure 5d). This suggests that, beside its function in stimulating Treg cell proliferation, IL2 signaling induces the differentiation of Id3hi into Id3lo Treg cells.
To further delineate the role of IL2 on proliferation and differentiation of Id3lo and Id3hi Treg cells, CD44hiId3lo or CD44hiId3hi Treg cells were labeled with a proliferation dye and equal numbers were transferred into wt recipients, which were injected with IL2/IL2mAb complexes or PBS as control. Cell recovery was lower in mice that received CD44hiId3lo compared to CD44hiId3hi Treg cells (Figure 5e, white bars). Cell numbers increased upon IL2/IL2mAb treatment in both cases, but to a greater extend in mice that received CD44hiId3hi Treg cells indicating a higher proliferative capacity of this Treg cell population (Figure 5e). Transferred CD44hiId3lo Treg cells remained CD44hiId3lo also upon IL2/IL2mAb treatment, while transferred CD44hiId3hi Treg cells differentiated to a great extend into CD44hiId3lo cells (Figure 5f, small insets). CD44hiId3hi Treg cells and their CD44hiId3lo progeny proliferated moderately more than phenotypically stable CD44hiId3lo Treg cells (Figure 5f), explaining the observed increase in cell recovery. IL2/IL2mAb treatment greatly induced proliferation of CD44hiId3hi and CD44hiId3lo Treg cells (Figure 5f). Comparison of newly generated CD44hiId3lo Treg cells and those that remained CD44hiId3hi at day 7 post-transfer (stable phenotype) showed that the newly differentiated CD44hiId3lo Treg cells had undergone more cell divisions (Figure 5g). Reduced Id3 expression correlated with increased numbers of cell divisions and this effect was enhanced by IL2/IL2mAb treatment (Figure 5h). Taken together, the differentiation of Id3hi into Id3lo Treg cells was accompanied by proliferation and induced by IL2.
Highly suppressive expression profile of Id3lo Treg cells during infection
Next, we analyzed the transcriptional profile of Id3lo Treg cells under inflammatory conditions. As controls, we additionally separated CD44loId3hi from CD44hiId3hi Treg cells to prevent skewing of the analysis. Isolated CD44loId3hi, CD44hiId3hi and CD44hiId3lo Treg cells from LCMV infected Id3GFP/+ mice on day 8 post-infection were analyzed for the expression of transcription factors and suppressive molecules by quantitative RT-PCR and FACS. Significantly higher levels of Prdm1 were detected in CD44hiId3lo Treg cells compared to CD44hiId3hi Treg cells, suggesting that also BLIMP1 expression separates CD44hi Treg cells into two distinct populations (Figure 6a and Supplementary Figure 3a). Furthermore, we found increased mRNA levels of Tbx21 and Rorc in Id3lo Treg cells, but no significant differences in the expression of the Th2-specific transcription factors Gata3 and Irf4 or the Tfh-specific transcription factor Bcl6 were found between the analyzed populations (Figure 6a and Supplementary Figure 3a). These data confirmed that certain specialized Treg cells, such as those targeting Th1 and Th17 cells are enriched among Id3lo Treg cells, while follicular Treg cells are mostly found within the Id3hi Treg cell population. This notion was enforced by higher CXCR5+ expression in the CD44hiId3hi Treg cell population (Figure 6b and Supplementary Figure 3b). The CD44hiId3lo Treg cell population could be further divided by low/absent and high surface expression of KLRG1 (Figure 6b). CD44hiId3lo Treg cells had selectively higher expression of CTLA4 and ICOS, slightly higher CD103 and LAG3 expression and similar PD1 and CD62L surface levels compared to the CD44hiId3hi Treg cell population. With regard to their suppressive function, RT-PCR analysis showed that expression of the cytokines Il10 and Ifng, as well as the immunosuppressive molecule Fgl2 was mostly restricted to the CD44hiId3lo Treg cell population (Figure 6c and Supplementary Figure 3a). Altogether, these data suggest that during infection the CD44hiId3lo Treg cell population is the main producer of suppressive molecules.
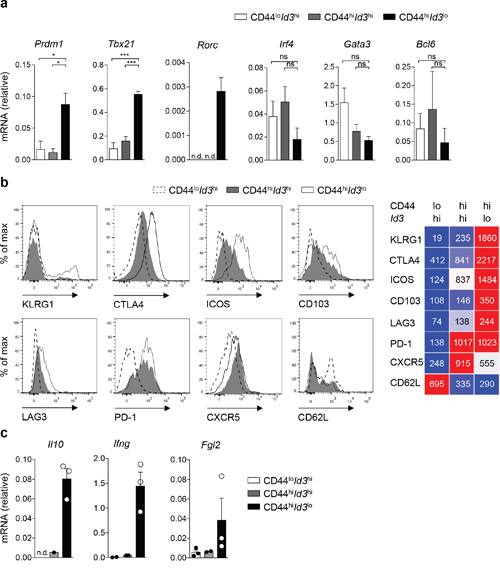
Figure 6: Id3lo Treg cells are highly suppressive effector Treg cells after infection. (a, c) Quantitative RT-PCR analysis of the indicated mRNA transcripts in CD44loId3hi (white), CD44hiId3hi (grey) or CD44hiId3lo (black) splenic Treg cells (CD4+CD25+) from d8 LCMV WE infected Id3GFP/+ mice. (a) Mean ± SEM from 3 individual mice or (c) mean ± SEM and single values from 3 individual mice are shown. n.d. = not detectable in all experiments, *p < 0.05; **p < 0.01; ns = not significant (unpaired Student’s t test). (b) Flow cytometric analysis of the indicated surface markers on CD44loId3hi, CD44hiId3hi, CD44hiId3lo Treg cells (CD4+CD25hi) of d8 LCMV WE infected Id3GFP/+ mice or in the case of CTLA4 of IL2/IL2mAB treated Id3GFP/+ mice. Representative histograms (left) and quantification of the mean fluorescence intensity of the indicated surface proteins from 3 individual mice (right) are shown.
Id3lo Treg cells are more abundant during chronic compared to acute viral LCMV infection
We next investigated whether the abundance of the highly suppressive Id3lo Treg cell subset might be differentially elevated in acute compared to chronic infection. We infected Id3GFP/+ mice with either 200 pfu LCMV Docile for an acute infection or 106 pfu LCMV Docile for a chronic infection [27] and analyzed the abundance of Treg cell populations. At day 8 post-infection with 200 pfu LCMV Docile, overall Treg cells, and specifically both Id3lo and Id3hi Treg cell numbers decreased (Figure 7a). In contrast, at day 8 post-infection with 106 pfu LCMV Docile, overall Treg cell numbers were comparable to naive mice while Id3lo Treg cell numbers increased (Figure 7a). The absolute abundance of Id3lo Treg cells drastically changed, resulting in a 2-fold increase of Id3lo Treg cells compared to naive mice and about 4-fold compared to acutely infected mice at day 8 and day 35 post-infection (Figure 7b). This increased abundance of Id3lo Treg cells among the Treg cell pool was observed in the spleen, lymph nodes and lung at day 8 both under acute or chronic infection (Figure 7c). Strikingly, only during chronic infection the increased abundance of Id3lo Treg cells persisted until day 35 upon infection in the spleen, and most prominently in the lungs (Figure 7c, lower panel). The overall phenotype of Id3lo Treg cells was comparable in acute and chronic infected mice (Supplementary Figure 3a, 3b). However, it was striking that during chronic infection Id3lo Treg cells produced significantly higher levels of the immunosuppressive cytokine Fgl2 compared to Id3lo Treg cells in acute infected mice (Figure 7d). In summary, Id3lo Treg cells expressing elevated levels of Fgl2 are highly abundant in mice with chronic LCMV infection.
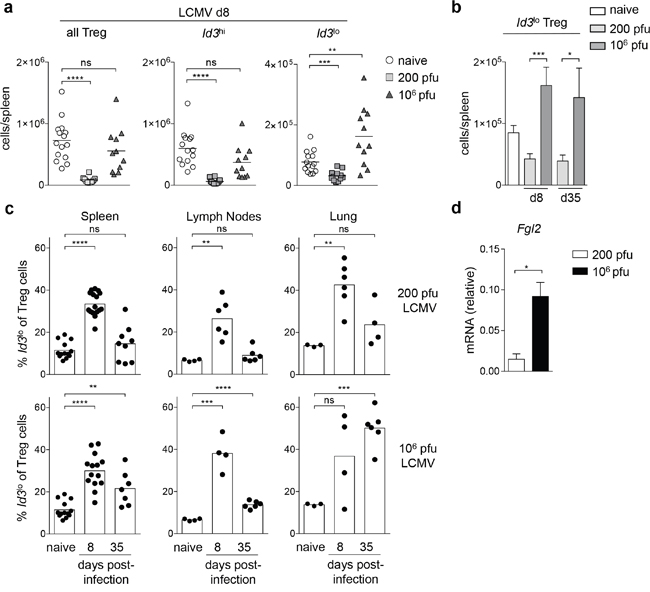
Figure 7: Id3lo Treg cells are more abundant in chronic LCMV infection. (a) Cell number of all, Id3hi or Id3lo Treg cells (CD4+CD25+CD45RBlo) in spleens of naive, 200 (acute) or 106 (chronic) pfu LCMV Docile infected Id3GFP/+ mice. Each symbol represents an individual mouse and horizontal lines are the mean. **p < 0.01; ***p < 0.001; ****p < 0.0001; ns = not significant (unpaired Student’s t test). (b) Id3lo Treg cell numbers per spleen upon infection with 200 (acute) or 106 (chronic) pfu LCMV Docile at d8 and d35 post-infection. Mean ± SEM from at least 4 individual mice are shown. *p < 0.05; ***p < 0.001 (unpaired Student’s t test). (c) Id3lo Treg cell percentages among Treg cells (CD4+CD25+) from the spleens, lymph nodes and lungs of naive or infected mice with 200 (acute, top) or 106 pfu (chronic, bottom) LCMV Docile at d8 and d35 post-infection. Each symbol represents an individual mouse and bars are the mean. **p < 0.01; ***p < 0.001; ****p < 0.0001; ns = not significant (unpaired Student’s t test). (d) Quantitative RT-PCR analysis of Fgl2 mRNA transcripts in CD44hiId3lo Treg cells (CD4+CD25+) from 200 (white) or 106 (black) pfu LCMV Docile infected Id3GFP/+ mice at d8 post-infection. Mean ± SEM from 3 independent experiments are shown. *p < 0.05 (unpaired Student’s t test).
DISCUSSION
In this study, we identified a highly suppressive Treg cell subpopulation characterized by low expression of the transcriptional regulator Id3, which (1) defined a subpopulation of activated CD44hi Treg cells, (2) had a transcriptional profile of late-stage differentiated effector Treg cells, (3) expressed high levels of inhibitory surface receptors and immunosuppressive cytokines and (4) was superior in suppressing proliferation and differentiation of T cells compared to CD44hiId3hi Treg cells. Id3lo Treg cells were the predominant Treg cell population during chronic LCMV infection. Therefore, we suggest that Id3lo Treg cells contribute to the dysregulated T cell response during chronic infection and propose that preventing the differentiation of Id3hi into Id3lo Treg cells might provide a new therapeutic approach for treating chronic infections.
To fulfill diverse functions, from controlling self-reactive T cells to preventing or allowing pathogen and tissue-specific immune responses, different subpopulations of Treg cells utilize different mechanisms to regulate the immune response [14, 15]. CD44hi Treg cells, which are generated by TCR signaling from naive-like Treg cells, possess greater suppressive activity against effector T cells compared to the naive-like Treg cell population [33, 40]. We show here, that this activated CD44hi Treg cell population can be further divided into Id3lo and Id3hi populations. While the CD44hiId3hi population already had some features of effector Treg cells, such as increased surface levels of CD103 and intermediate ICOS levels, the levels of mRNA transcripts of the immunomodulatory cytokines Il10 and Fgl2 and of the lineage determining transcription factors Prdm1, Tbx21 and Rorc were similar to naive-like CD44lo Treg cells. These data suggest that CD44hiId3hi Treg cells, although based on elevated expression of the surface marker CD44 already categorized as activated Treg cells, have only a limited set of suppressor functions and retain the capacity to further specialize.
Further specialization tailors Treg cells to specifically suppress Th1, Th2, Th17 or Tfh cell responses [14, 34]. CD44hiId3lo Treg cells were highly suppressive towards any T cell response tested, suggesting that this population is enriched with cells possessing great suppressive capacity towards a variety of T cell responses. Highly suppressive effector Treg cells have been described to express high levels of the transcription factor BLIMP1 [18]. Accordingly, also CD44hiId3lo Treg cells had increased Prdm1 expression and based on their gene expression profiles Id3lo and BLIMP1+ Treg cells were highly similar Treg cell subpopulations. However, it was suggested that BLIMP1+ effector Treg cells also include follicular Treg cells [14, 41] and our data suggests that follicular Treg cells were not specifically included in the CD44hiId3lo Treg cell population. Thus, we propose that Id3lo Treg cells are a subpopulation of BLIMP1+ effector Treg cells, including a wide range, but not all types of specialized effector Treg cells. Mechanistically, we propose that BLIMP1 is up-regulated in Treg cells differentiating into effector Treg cells and subsequently, in a subset of effector Treg cells, BLIMP1 acts to suppress Id3 expression, as it has been shown to directly repress Id3 transcription in CD8+ T cells [42].
Treg cell differentiation in infection is controlled by different signals, such as TCR and cytokine signaling, with TCR signaling being required for the differentiation of naive-like to activated CD44hi Treg cells [12, 33, 40]. We propose here that the differentiation into highly suppressive Id3lo Treg cells occurs in a multi-step process. First, antigen-mediated TCR signaling activates naive-like Treg cells, resulting in the generation of activated Id3hiCD44hi Treg cells with a limited suppressive potential. In a later step, Id3 is down-regulated, possibly through BLIMP-1 mediated repression, resulting in further differentiation and specialization of Treg cells. This later step is augmented upon LCMV infection, and it is most probably triggered by extracellular signals, among others IL2. IL2 has multiple effects on Treg cells, ranging from inducing Treg cell specific gene expression, such as Foxp3, to supporting Treg cell homeostasis and proliferation [43–45]. IL2 is also required for the development of highly suppressive KLRG1+ Treg cells [46] and of BLIMP1+ effector Treg cells [18]. Our data demonstrated that IL2 signaling promoted the accumulation of Id3lo Treg cells. This preferential accumulation may have resulted exclusively from IL2 promoted differentiation of Id3hi into Id3lo Treg cells or additionally from IL2-mediated selective expansion or/and survival of the CD44hiId3lo Treg cell subpopulation. IL2/IL2mAb complex treatment, for instance, stimulates KLRG1- Treg cells to proliferate and differentiate into KLRG1+ Treg cells, whereas proliferation of KLRG1+ Treg cells is not induced [46]. In a similar way, IL2/IL2mAb complex treatment stimulated Id3hi Treg cells to proliferate and develop into Id3lo Treg cells, but it also stimulated proliferation of purified Id3lo Treg cells. In combination with our data showing that the fold increase of Id3lo Treg cells was much greater than that of the Id3hi Treg cell subsets upon IL2/IL2mAb complex treatment, we suggest that besides supporting proliferation of both Id3lo and Id3hi Treg cell subsets, IL2 also drives differentiation into Id3lo Treg cells. Regarding its role as a survival factor, our RNA-sequencing data showed that Id3lo Treg cells expressed low levels of the anti-apoptotic protein Bcl-2, suggesting that these cells are probably short-lived compared to Id3hi Treg cells. Indeed, cell recovery after transfer of Id3lo Treg cells was reduced compared to Id3hi Treg cells. As this trend was unaltered after IL2/IL2mAb complex treatment, a role of IL2 specifically supporting survival of Id3lo Treg cells is unlikely. Regardless of its exact way of action, we clearly show that high-dose IL2 treatment led to increased abundance of highly suppressive Id3lo Treg cells. Thus, our data suggest that IL2 treatment differentially affects the abundance of specialized Treg cell subtypes. Thus, it would be interesting to determine, if there is a relationship between applied IL2/IL2mAb complex dose and predominant Treg cell phenotype that can be monitored in clinical applications of IL2, especially since the effects of low versus high dose IL2 treatment are currently investigated for the treatment of autoimmune diseases such as diabetes [47, 48].
We showed here for the first time that a subset of effector Treg cells in a late stage of differentiation was characterized by low Id3 expression. Other T cell differentiation processes are also accompanied by the down-regulation of Id3. For instance, high Id3 expression is required for the maintenance of the naive phenotype of T cells [24] and Id3loCD8+ T cells differentiate into KLRG1+ effector cells in infection [26, 27]. In Treg cells, low Id3 expression could have several functional consequences: (1) Id3 acts by inhibiting the gene regulatory activity of the E protein transcription factors E2A and HEB [21], and known E2A target genes in T cells include Il10 and Rorct [49, 50], suggesting that the down-regulation of Id3 in activated Treg cells is necessary to activate the expression of effector molecules and lineage determining factors by releasing E protein activity; (2) Id3 maintains the expression of Foxp3 in Treg cells [29], however, Foxp3 transcript and protein expression were not reduced in Id3lo compared to Id3hi Treg cells. We suggest that in activated Treg cells feedback mechanisms prevent the down-regulation of Foxp3 expression by increased E47 activity. One of such mechanisms could be the increased Id2 expression we found by RNA-Sequencing in Id3lo Treg cells (Figure 3a), which would guarantee low E protein activity. And (3) loss of both Id3 and Id2 expression in Treg cells results in the preferential generation of CXCR5+ follicular Treg cells [28], whereas we found that follicular Treg cells were mainly included in the CD44hiId3hi Treg cell population. Thus, we propose that again high levels of Id2 in the Id3lo Treg cell population prevent the differentiation into follicular Treg cells. Further, since follicular Treg cells were generated within the CD44hiId3hi Treg cell population, it is tempting to speculate that high Id3 levels do not restrict the generation of follicular Treg cells and thus it would be of uttermost interest to understand which transcriptional targets are selectively controlled by Id2 and Id3 in Treg cells.
Finally, we found an increased abundance of Id3lo Treg cells during chronic compared to acute LCMV infection suggesting that the Id3lo effector Treg cell population specifically contributed to the insufficient T cell responses during chronic viral infections. During chronic LCMV infection, blocking IL10 receptor signaling or FGL2 depletion results in enhanced antiviral CD8+ T cell responses and viral clearance [51, 52]. Since Id3lo Treg cells have preferential high expression of Il10 and Fgl2, we propose that the Id3lo Treg subpopulation is a major source of IL10 and FGL2 during chronic LCMV infection. LCMV-specific Treg cell numbers decline during acute and chronic infection [53], however, Id3lo Treg cells specifically accumulated during chronic infection. We therefore speculate, that Id3lo Treg cells were most probably not LCMV-specific, but generated from LCMV-unrelated, maybe even self-reactive, activated CD44hiId3hi Treg cells by the action of IL2 and other unknown factors present during infection. These highly suppressive Id3lo Treg cells would then suppress the immune response in a bystander mechanism contributing to chronic infection [54]. Most interestingly upon chronic LCMV infection, Id3lo Treg cells specifically persisted within the lungs, an organ wherein LCMV-Docile persists for a long time. Thus, the preferential presence of Id3lo Treg cells within this organ might be either causative for virus persistence within this site or the consequence of increased virus presence, which would constantly trigger differentiation of Id3hi into Id3lo Treg cells. Regardless, the increased abundance of highly suppressive Id3lo Treg cells would contribute to reduced T cell responses at these sites.
In summary, the present study shows that activated CD44hi Treg cells further differentiate into highly suppressive effector Treg cells. During this differentiation process, Treg cells down-regulate Id3 and subsequently acquire the expression of transcription factors specific for highly suppressive effector Treg cells. Id3lo Treg cells were, indeed, highly suppressive, most likely due to their high ICOS, Il10 and Fgl2 expression levels. Interestingly, these highly suppressive Id3lo Treg cells were more abundant during chronic compared to acute LCMV infection. Thus, preventing the differentiation of CD44hiId3hi to CD44hiId3lo or specifically depleting the Id3lo Treg cell subset in chronic viral infections might rescue antiviral T cell responses, resulting in viral clearance.
MATERIALS AND METHODS
Mice and LCMV infections
Id3GFP/+ [B6.Id3tm2.1Cmu] [24], Thy1.1 and Ifnar- /-Id3GFP/+ [55] mice were housed and bred in specific pathogen-free conditions. All experiments were performed on 7–15-week-old mice. For LCMV experiments, mice were infected i.v. with 200 pfu LCMW-WE or LCMV Docile using 200 pfu for acute and 106 pfu for chronic infection. LCMV was grown in Madin Darby canine kidney (MDCK) cells and titered on MC57G fibrosarcoma cells by standard focus-forming assay as described [56]. Sample sizes were determined based on experience [27]. The groups were neither randomized, nor were experiments conducted in a blinded manner. All animal experiments were approved and performed in accordance with the guidelines of the local animal care and use committees and the Regierungspräsidium Freiburg.
In vivo transfer experiments and IL2/IL2mAb treatment
Id3hi or Id3lo Treg cells (CD4+CD8-CD25+Thy1.2+) were FACS sorted from spleen and LN of Id3GFP/+ or Ifnar- /-Id3GFP/+ mice. 2.5 x 10⁵ Id3hi, CD44hiId3hi, CD44loId3hi or 105 Id3lo Treg cells were transferred into wt (Thy1.1+) recipients. Recipient mice were infected with 200 pfu LCMV WE or 106 pfu LCMV Docile one day before or after transfer, as indicated. Spleens were analyzed seven days post-transfer. Mice with no detectable Thy1.1+ cells were excluded from the analysis. For IL2/IL2mAb treatments 2 μg IL2 (Immunotools) were incubated with 10 μg anti-IL2 antibody (JES6-1A12, ebioscience) in PBS for 30 min at 37°C prior to intraperitoneal injections. Id3GFP/+ mice were treated with IL2/IL2mAb on three consecutive days and analyzed five days after the first treatment.
In vitro suppression assay
105 MACS-isolated or FACS-sorted (CD4+CD8-CD25-CD44loCD62Lhi; for Th2 differentiation) and CFSE-labeled CD4+CD25- cells were cultured with 1 x 10⁵, 0.5 x 10⁵ or 0.25 x 10⁵ FACS sorted Id3hi or Id3lo Treg cells (CD4+CD8-CD25+CD44hi) from spleens of IL2/IL2mAb treated Id3GFP/+ mice in the presence of 2.5 μl (Th1, Th2) or 5 μl (Th17, Th2 differentiation) CD3/CD28 activator beads (life technologies) under the following conditions: Th1: IL-12 (5 ng/ml, Peprotech), anti-IL-4 (10 ng/ml, ebioscience); Th2 (proliferation): IL-4 (20 ng/ml, Peprotech), anti-IL-12 (10 ng/ml, ebioscience), anti-IFN-γ (10 ng/ml, ebioscience); Th2 (differentiation): IL-4 (100 ng/ml, Peprotech), IL2 (50U), anti-IL12 (10 ng/ml, ebioscience), anti-IFNγ (10 ng/ml, ebioscience), anti-CD28 (1μg/ml); Th17: IL-6 (20 ng/ml, Peprotech), TGF-β (5 ng/ml, R&D), anti-IL-4 (10 ng/ml, ebioscience), anti-IFN-γ (10 ng/ml, Peprotech). After 6 days cells were stimulated with PMA and Ionomycin for 1 hour and additionally with Golgi Plug for another 3 hours. The percentage of divided cells was calculated similar to Gett et al. [57]. In detail, relative cell numbers per division were determined using FlowJo and precursor frequencies were calculated as cell number/(2^number of cell divisions). Finally, the percentage of divided cells was calculated as 100*((precursor number of cells in divisions 1-6)/(total number of precursor cells)).
Flow cytometry and cell sorting
Single-cell suspensions for FACS analysis were obtained from the indicated organs. Splenic erythrocytes were eliminated using red blood cell lysis buffer. Cells were stained at 4°C for 15 min in PBS supplemented with 1% fetal calf serum and 2 μM EDTA, and various fluorochrome-conjugated antibodies purchased from eBioscience. Propidium iodide (1 μg/ml; Sigma) was included to exclude dead cells. A three-step CXCR5 staining was performed as described [58] by using purified rat anti-mouse CXCR5 (BD), a secondary Biotin-SP-conjugated Affinipure F(Ab’)2 Goat anti-rat IgG (Jackson Immunoresearch) and finally with streptavidin-eFluor®450 (ebioscience). For labeling with CFSE or Proliferation Dye, cells were resuspended at a concentration of 10 × 106 cells per ml in PBS containing 1 μM CFSE (Sigma) or 5 μM Cell Proliferation Dye eFluor®670 (ebioscience) and incubated for 10 min at 37°C. For intracellular staining of Foxp3 and CTLA4, cells were fixed and permeabilized using the Foxp3 Staining Buffer Kit (eBioscience), according to the manufacturer’s protocol, after staining of surface antigens and staining with the Fixable Viability Dye (eBioscience; eFluor®450 or eFluor®780) to exclude dead cells. Data were collected using the LSR Fortessa (BD Bioscience) flow cytometer and were analyzed with FlowJo software (Tree Star). Specific cell populations were either sorted on a MoFlo Astrios (Beckman Coulter), FACSAria III (BD Biosciences) or isolated by magnetic cell sorting (MACS; Miltenyi Biotec) with anti-biotin microbeads according to the manufacturer’s protocol. Antibodies with the following specificities were used: CD4 (RM4-5), TCRβ (H57-597), CD25 (PC61.5), CD45RB (C363.16A), Thy1.1 (HIS51), Thy1.2 (53-2.1), CD62L (MEL-14), Foxp3 (FJK-16s), CD3ε (145-2C11), CD8α (53-6.7), B220 (RA3-6B2), MHCII (M5/114.15.2), CD44 (IM7), KLRG1 (2F1), PD1 (RMP1-30), LAG3 (eBioC9B7W), ICOS (15F9), CXCR5 (2G8), CTLA4 (UC10-4B9), CD103 (2E7), IL17A (17B7), IFNγ (XMG1.2), IL4 (11B11) and NK1.1 (PK136).
RNA sequencing
Id3hi and Id3lo Treg cells (CD3+CD4+CD8-CD25+CD45RBlo) were sorted by flow cytometry from spleens of individual naive Id3GFP/+ mice directly into RLT buffer (Qiagen). Total RNA was isolated using RNAeasy MicroKit (Qiagen) according to the manufacturer’s recommendations. cDNA was generated using Ovation RNA-seq system V2 (NuGEN) and libraries were constructed with Ovation Ultralow System V2 1-16 (NuGEN) according to the manufacturer’s instructions. The libraries were subjected to 50 cycles of NextSeq 500 sequencing from 2-3 samples per cell type. Data analysis was performed with RNAExpress (Illumina), which performed alignment of reads to the mouse reference genome using the STAR aligner (mm10) and determined differentially expressed genes using DESeq2. Genes of interest (fold-change > 4) for the heat maps were handpicked and heat maps were generated with GENE-E (Broad Institute). Analysis of signature genes within the Id3lo/Id3hi comparison used previously determined gene sets: canonical Treg signature [30], T cell activation/proliferation signature from in vivo activated T cells [30], genes up-regulated in activated Treg cells [31], IRF4-dependent signature in Treg cells [36], CXCR3+ Treg signature [19]. Broad Institute GSEA was performed to determine Normalized Enrichment Scores (NES) and False Discovery Rates (FDR). Gene Set Enrichment was supposed when NES > 1.50 or < - 1.50 and FDR < 0.25. For comparisons to publically available gene expression data, RNA-sequencing data of BLIMP1+ and BLIMP1- Treg cells (GSE62535) was analyzed using RNAExpress (Illumina) and microarray data of CD44hiCD62Llo versus CD44loCD62Lhi (GSE61077), CD103-KLRG1- versus CD103+KLRG1+ (GSE20366), TIGIT- versus TIGIT+ Treg cells (GSE56299) and Tconv versus Treg cells (GSE7460) were analyzed using Geo2R (www.ncbi.nlm.nih.gov/geo/geo2r). The Id3lo and Id3hi Treg cell RNA-sequencing data reported in this paper are available in the Gene Expression Omnibus database under the accession number GSE75936.
RT-PCR
Total RNA was isolated using either the RNeasy Kit (Qiagen) or Trizol (Invitrogen). cDNA was prepared with oligo-dT primers using the First Strand cDNA Synthesis Kit (Thermo Scientific), including DNAse I treatment. Quantitative PCR was performed with the Fast Start Universal SYBR Green Master Kit (Roche) on the Mastercycler epgradient S (Eppendorf) with gene-specific primers listed in the Supplemental Experimental Procedures. Hypoxanthine guanine phosphoribosyl transferase 1 (Hprt1) transcript levels were used for normalization.
Statistical analyses
Statistical analyses were performed with two-tailed Student’s t-test, as indicated in the figure legends using Prism 6 software (GraphPad Software, Inc.). All p values < 0.05 were considered significant.
ACKNOWLEDGMENTS
We thank N. Langer for technical assistance, J. Bodinek for assistance with FACS sorting, Lise-Lotte Lenner (University of Lund) for performing microarray analysis, P. Stäheli (University of Freiburg) for Ifnar-/- mice, H. Pircher (University of Freiburg), T. Kögl (University of Freiburg) and C. Murre (UCSD) for reagents and support. This study was supported by an International Graduate Academy fellowship to K.S.R., a Fill-in-the-gap stipend to M.H., the German Research Foundation (DFG SFB1160-IMPATH TP2) to P.A., the German Research Foundation (DFG SCHA 1442/5-1 and 1442/6-1) to C.S. and the Federal Ministry of Education and Research (BMBF 01EO1303), the European Commission (FP7 PIRG08-GA-2010-276906) and the Müller-Fahnenberg Stiftung to K.S. M.H. was partially supported by the German Research Foundation (DFG) through SFB1160-IMPATH TP5 to S.M.
Author contributions
K.S.R. designed and conducted experiments, analyzed data and wrote the manuscript; M.H. performed experiments, A.J.M. performed initial LCMV infections; M.S. performed microarray analysis; S.M., P.A. and C.S. contributed intellectual input and crucial reagents; and K.S. directed research, designed the study, analyzed data and wrote the manuscript with input from all authors.
CONFLICTS OF INTEREST
The authors declare no competing financial interests.
REFERENCES
1. Josefowicz SZ, Lu LF, Rudensky AY. Regulatory T cells: mechanisms of differentiation and function. Annu Rev Immunol. 2012; 30: 531-64. doi: 10.1146/annurev.immunol.25.022106.141623.
2. Ohkura N, Kitagawa Y, Sakaguchi S. Development and maintenance of regulatory T cells. Immunity. 2013; 38: 414-23. doi: 10.1016/j.immuni.2013.03.002.
3. Smigiel KS, Srivastava S, Stolley JM, Campbell DJ. Regulatory T-cell homeostasis: steady-state maintenance and modulation during inflammation. Immunol Rev. 2014; 259: 40-59. doi: 10.1111/imr.12170.
4. Srivastava S, Koch MA, Pepper M, Campbell DJ. Type I interferons directly inhibit regulatory T cells to allow optimal antiviral T cell responses during acute LCMV infection. J Exp Med. 2014; 211: 961-74. doi: 10.1084/jem.20131556.
5. Penaloza-MacMaster P, Kamphorst AO, Wieland A, Araki K, Iyer SS, West EE, O'Mara L, Yang S, Konieczny BT, Sharpe AH, Freeman GJ, Rudensky AY, Ahmed R. Interplay between regulatory T cells and PD-1 in modulating T cell exhaustion and viral control during chronic LCMV infection. J Exp Med. 2014; 211: 1905-18. doi: 10.1084/jem.20132577.
6. Park HJ, Park JS, Jeong YH, Son J, Ban YH, Lee BH, Chen L, Chang J, Chung DH, Choi I, Ha SJ. PD-1 upregulated on regulatory T cells during chronic virus infection enhances the suppression of CD8+ T cell immune response via the interaction with PD-L1 expressed on CD8+ T cells. J Immunol. 2015; 194: 5801-11. doi: 10.4049/jimmunol.1401936.
7. Schmitz I, Schneider C, Frohlich A, Frebel H, Christ D, Leonard WJ, Sparwasser T, Oxenius A, Freigang S, Kopf M. IL-21 restricts virus-driven Treg cell expansion in chronic LCMV infection. PLoS Pathol. 2013; 9: e1003362. doi: 10.1371/journal.ppat.1003362.
8. Lund JM, Hsing L, Pham TT, Rudensky AY. Coordination of early protective immunity to viral infection by regulatory T cells. Science. 2008; 320: 1220-4. doi: 10.1126/science.1155209.
9. Pace L, Tempez A, Arnold-Schrauf C, Lemaitre F, Bousso P, Fetler L, Sparwasser T, Amigorena S. Regulatory T cells increase the avidity of primary CD8+ T cell responses and promote memory. Science. 2012; 338: 532-6. doi: 10.1126/science.1227049.
10. Laidlaw BJ, Cui W, Amezquita RA, Gray SM, Guan T, Lu Y, Kobayashi Y, Flavell RA, Kleinstein SH, Craft J, Kaech SM. Production of IL-10 by CD4(+) regulatory T cells during the resolution of infection promotes the maturation of memory CD8(+) T cells. Nat Immunol. 2015; 16: 871-9. doi: 10.1038/ni.3224.
11. Kalia V, Penny LA, Yuzefpolskiy Y, Baumann FM, Sarkar S. Quiescence of Memory CD8(+) T Cells Is Mediated by Regulatory T Cells through Inhibitory Receptor CTLA-4. Immunity. 2015; 42: 1116-29. doi: 10.1016/j.immuni.2015.05.023.
12. Smigiel KS, Richards E, Srivastava S, Thomas KR, Dudda JC, Klonowski KD, Campbell DJ. CCR7 provides localized access to IL-2 and defines homeostatically distinct regulatory T cell subsets. J Exp Med. 2014; 211: 121-36. doi: 10.1084/jem.20131142.
13. Huehn J, Siegmund K, Lehmann JC, Siewert C, Haubold U, Feuerer M, Debes GF, Lauber J, Frey O, Przybylski GK, Niesner U, de la Rosa M, Schmidt CA, et al. Developmental stage, phenotype, and migration distinguish naive- and effector/memory-like CD4+ regulatory T cells. J Exp Med. 2004; 199: 303-13. doi: 10.1084/jem.20031562.
14. Cretney E, Kallies A, Nutt SL. Differentiation and function of Foxp3(+) effector regulatory T cells. Trends Immunol. 2013; 34: 74-80. doi: 10.1016/j.it.2012.11.002.
15. Yuan X, Cheng G, Malek TR. The importance of regulatory T-cell heterogeneity in maintaining self-tolerance. Immunol Rev. 2014; 259: 103-14. doi: 10.1111/imr.12163.
16. Koch MA, Tucker-Heard G, Perdue NR, Killebrew JR, Urdahl KB, Campbell DJ. The transcription factor T-bet controls regulatory T cell homeostasis and function during type 1 inflammation. Nat Immunol. 2009; 10: 595-602. doi: 10.1038/ni.1731.
17. Chaudhry A, Rudra D, Treuting P, Samstein RM, Liang Y, Kas A, Rudensky AY. CD4+ regulatory T cells control TH17 responses in a Stat3-dependent manner. Science. 2009; 326: 986-91. doi: 10.1126/science.1172702.
18. Cretney E, Xin A, Shi W, Minnich M, Masson F, Miasari M, Belz GT, Smyth GK, Busslinger M, Nutt SL, Kallies A. The transcription factors Blimp-1 and IRF4 jointly control the differentiation and function of effector regulatory T cells. Nat Immunol. 2011; 12: 304-11. doi: 10.1038/ni.2006.
19. Joller N, Lozano E, Burkett PR, Patel B, Xiao S, Zhu C, Xia J, Tan TG, Sefik E, Yajnik V, Sharpe AH, Quintana FJ, Mathis D, et al. Treg cells expressing the coinhibitory molecule TIGIT selectively inhibit proinflammatory Th1 and Th17 cell responses. Immunity. 2014; 40: 569-81. doi: 10.1016/j.immuni.2014.02.012.
20. Kee BL. E and ID proteins branch out. Nat Rev Immunol. 2009; 9: 175-84. doi: 10.1038/nri2507.
21. Murre C. Helix-loop-helix proteins and lymphocyte development. Nat Immunol. 2005; 6: 1079-86. doi: 10.1038/ni1260.
22. Benezra R, Davis RL, Lockshon D, Turner DL, Weintraub H. The protein Id: a negative regulator of helix-loop-helix DNA binding proteins. Cell. 1990; 61: 49-59. doi:
23. Jones ME, Zhuang Y. Acquisition of a functional T cell receptor during T lymphocyte development is enforced by HEB and E2A transcription factors. Immunity. 2007; 27: 860-70. doi: 10.1016/j.immuni.2007.10.014.
24. Miyazaki M, Rivera RR, Miyazaki K, Lin YC, Agata Y, Murre C. The opposing roles of the transcription factor E2A and its antagonist Id3 that orchestrate and enforce the naive fate of T cells. Nat Immunol. 2011; 12: 992-1001. doi: 10.1038/ni.2086.
25. Rivera RR, Johns CP, Quan J, Johnson RS, Murre C. Thymocyte selection is regulated by the helix-loop-helix inhibitor protein, Id3. Immunity. 2000; 12: 17-26. doi:
26. Yang CY, Best JA, Knell J, Yang E, Sheridan AD, Jesionek AK, Li HS, Rivera RR, Lind KC, D'Cruz LM, Watowich SS, Murre C, Goldrath AW. The transcriptional regulators Id2 and Id3 control the formation of distinct memory CD8+ T cell subsets. Nat Immunol. 2011; 12: 1221-9. doi: 10.1038/ni.2158.
27. Menner AJ, Rauch KS, Aichele P, Pircher H, Schachtrup C, Schachtrup K. Id3 Controls Cell Death of 2B4+ Virus-Specific CD8+ T Cells in Chronic Viral Infection. J Immunol. 2015; 195: 2103-14. doi: 10.4049/jimmunol.1402607.
28. Miyazaki M, Miyazaki K, Chen S, Itoi M, Miller M, Lu LF, Varki N, Chang AN, Broide DH, Murre C. Id2 and Id3 maintain the regulatory T cell pool to suppress inflammatory disease. Nat Immunol. 2014; 15: 767-76. doi: 10.1038/ni.2928.
29. Rauch KS, Hils M, Lupar E, Minguet S, Sigvardsson M, Rottenberg ME, Izcue A, Schachtrup C, Schachtrup K. Id3 Maintains Foxp3 Expression in Regulatory T Cells by Controlling a Transcriptional Network of E47, Spi-B, and SOCS3. Cell Rep. 2016; 17: 2827-36. doi: 10.1016/j.celrep.2016.11.045.
30. Hill JA, Feuerer M, Tash K, Haxhinasto S, Perez J, Melamed R, Mathis D, Benoist C. Foxp3 transcription-factor-dependent and -independent regulation of the regulatory T cell transcriptional signature. Immunity. 2007; 27: 786-800. doi: 10.1016/j.immuni.2007.09.010.
31. van der Veeken J, Gonzalez AJ, Cho H, Arvey A, Hemmers S, Leslie CS, Rudensky AY. Memory of Inflammation in Regulatory T Cells. Cell. 2016; 166: 977-90. doi: 10.1016/j.cell.2016.07.006.
32. Feuerer M, Hill JA, Kretschmer K, von Boehmer H, Mathis D, Benoist C. Genomic definition of multiple ex vivo regulatory T cell subphenotypes. Proc Natl Acad Sci U S A. 2010; 107: 5919-24. doi: 10.1073/pnas.1002006107.
33. Levine AG, Arvey A, Jin W, Rudensky AY. Continuous requirement for the TCR in regulatory T cell function. Nat Immunol. 2014; 15: 1070-8. doi: 10.1038/ni.3004.
34. Bromley SK, Mempel TR, Luster AD. Orchestrating the orchestrators: chemokines in control of T cell traffic. Nat Immunol. 2008; 9: 970-80. doi: 10.1038/ni.f.213.
35. Vasanthakumar A, Moro K, Xin A, Liao Y, Gloury R, Kawamoto S, Fagarasan S, Mielke LA, Afshar-Sterle S, Masters SL, Nakae S, Saito H, Wentworth JM, et al. The transcriptional regulators IRF4, BATF and IL-33 orchestrate development and maintenance of adipose tissue-resident regulatory T cells. Nat Immunol. 2015; 16: 276-85. doi: 10.1038/ni.3085.
36. Zheng Y, Chaudhry A, Kas A, deRoos P, Kim JM, Chu TT, Corcoran L, Treuting P, Klein U, Rudensky AY. Regulatory T-cell suppressor program co-opts transcription factor IRF4 to control T(H)2 responses. Nature. 2009; 458: 351-6. doi: 10.1038/nature07674.
37. Lee LN, Burke S, Montoya M, Borrow P. Multiple mechanisms contribute to impairment of type 1 interferon production during chronic lymphocytic choriomeningitis virus infection of mice. J Immunol. 2009; 182: 7178-89. doi: 10.4049/jimmunol.0802526.
38. Metidji A, Rieder SA, Glass DD, Cremer I, Punkosdy GA, Shevach EM. IFN-alpha/beta receptor signaling promotes regulatory T cell development and function under stress conditions. J Immunol. 2015; 194: 4265-76. doi: 10.4049/jimmunol.1500036.
39. Boyman O, Kovar M, Rubinstein MP, Surh CD, Sprent J. Selective stimulation of T cell subsets with antibody-cytokine immune complexes. Science. 2006; 311: 1924-7. doi: 10.1126/science.1122927.
40. Vahl JC, Drees C, Heger K, Heink S, Fischer JC, Nedjic J, Ohkura N, Morikawa H, Poeck H, Schallenberg S, Riess D, Hein MY, Buch T, et al. Continuous T cell receptor signals maintain a functional regulatory T cell pool. Immunity. 2014; 41: 722-36. doi: 10.1016/j.immuni.2014.10.012.
41. Linterman MA, Pierson W, Lee SK, Kallies A, Kawamoto S, Rayner TF, Srivastava M, Divekar DP, Beaton L, Hogan JJ, Fagarasan S, Liston A, Smith KG, et al. Foxp3+ follicular regulatory T cells control the germinal center response. Nat Med. 2011; 17: 975-82. doi: 10.1038/nm.2425.
42. Ji Y, Pos Z, Rao M, Klebanoff CA, Yu Z, Sukumar M, Reger RN, Palmer DC, Borman ZA, Muranski P, Wang E, Schrump DS, Marincola FM, et al. Repression of the DNA-binding inhibitor Id3 by Blimp-1 limits the formation of memory CD8+ T cells. Nat Immunol. 2011; 12: 1230-7. doi: 10.1038/ni.2153.
43. Malek TR. The biology of interleukin-2. Annu Rev Immunol. 2008; 26: 453-79. doi: 10.1146/annurev.immunol.26.021607.090357.
44. Chinen T, Kannan AK, Levine AG, Fan X, Klein U, Zheng Y, Gasteiger G, Feng Y, Fontenot JD, Rudensky AY. An essential role for the IL-2 receptor in Treg cell function. Nat Immunol. 2016; 17: 1322-33. doi: 10.1038/ni.3540.
45. Fontenot JD, Rasmussen JP, Gavin MA, Rudensky AY. A function for interleukin 2 in Foxp3-expressing regulatory T cells. Nat Immunol. 2005; 6: 1142-51. doi: 10.1038/ni1263.
46. Cheng G, Yuan X, Tsai MS, Podack ER, Yu A, Malek TR. IL-2 receptor signaling is essential for the development of Klrg1+ terminally differentiated T regulatory cells. J Immunol. 2012; 189: 1780-91. doi: 10.4049/jimmunol.1103768.
47. Perdigoto AL, Chatenoud L, Bluestone JA, Herold KC. Inducing and Administering Tregs to Treat Human Disease. Front Immunol. 2015; 6: 654. doi: 10.3389/fimmu.2015.00654.
48. Klatzmann D, Abbas AK. The promise of low-dose interleukin-2 therapy for autoimmune and inflammatory diseases. Nat Rev Immunol. 2015; 15: 283-94. doi: 10.1038/nri3823.
49. Zhang F, Fuss IJ, Yang Z, Strober W. Transcription of RORgammat in developing Th17 cells is regulated by E-proteins. Mucosal Immunol. 2014; 7: 521-32. doi: 10.1038/mi.2013.69.
50. Masson F, Ghisi M, Groom JR, Kallies A, Seillet C, Johnstone RW, Nutt SL, Belz GT. Id2 represses E2A-mediated activation of IL-10 expression in T cells. Blood. 2014; 123: 3420-8. doi: 10.1182/blood-2014-03-561456.
51. Ejrnaes M, Filippi CM, Martinic MM, Ling EM, Togher LM, Crotty S, von Herrath MG. Resolution of a chronic viral infection after interleukin-10 receptor blockade. J Exp Med. 2006; 203: 2461-72. doi: 10.1084/jem.20061462.
52. Khattar R, Luft O, Yavorska N, Shalev I, Phillips MJ, Adeyi O, Gao D, Bartczak A, Urbanellis P, Shyu W, Zhang J, Manuel J, Levy GA, et al. Targeted deletion of FGL2 leads to increased early viral replication and enhanced adaptive immunity in a murine model of acute viral hepatitis caused by LCMV WE. PLoS One. 2013; 8: e72309. doi: 10.1371/journal.pone.0072309.
53. Su LF, Del Alcazar D, Stelekati E, Wherry EJ, Davis MM. Antigen exposure shapes the ratio between antigen-specific Tregs and conventional T cells in human peripheral blood. Proc Natl Acad Sci U S A. 2016; 113: E6192-E8. doi: 10.1073/pnas.1611723113.
54. Belkaid Y. Regulatory T cells and infection: a dangerous necessity. Nat Rev Immunol. 2007; 7: 875-88. doi: 10.1038/nri2189.
55. Muller U, Steinhoff U, Reis LF, Hemmi S, Pavlovic J, Zinkernagel RM, Aguet M. Functional role of type I and type II interferons in antiviral defense. Science. 1994; 264: 1918-21. doi:
56. Battegay M, Cooper S, Althage A, Banziger J, Hengartner H, Zinkernagel RM. Quantification of lymphocytic choriomeningitis virus with an immunological focus assay in 24- or 96-well plates. J Virol Methods. 1991; 33: 191-8. doi:
57. Gett AV, Hodgkin PD. A cellular calculus for signal integration by T cells. Nat Immunol. 2000; 1: 239-44. doi: 10.1038/79782.
58. Johnston RJ, Poholek AC, DiToro D, Yusuf I, Eto D, Barnett B, Dent AL, Craft J, Crotty S. Bcl6 and Blimp-1 are reciprocal and antagonistic regulators of T follicular helper cell differentiation. Science. 2009; 325: 1006-10. doi: 10.1126/science.1175870.