
INTRODUCTION
The 43 kDa cyclic AMP (cAMP)-responsive element binding protein (CREB) is a member of the large family of basic leucine zipper (bZIP)-containing transcription factors (TF) and plays a key role in many physiologic as well as pathophysiologic processes including cell growth, differentiation, apoptosis, cell cycle progression and immune response amongst others [1]. CREB exerts distinct activities in context and time-dependent manners [2–4], which depend on its phosphorylation status mediated by various kinases. Phosphorylated CREB interacts with the CREB-binding protein CBP/p300 via its kinase inducible domain (KID) and the KID-interacting domain (KIX) in CBP/p300 [5]. The CREB/CBP complex induces a transcriptional machinery leading to activation of cAMP-responsive element (CRE) containing gene promoters. CREB mediates transcriptional responses to different stimuli including hormones, growth factors and neurotransmitters thereby acting as mediator between signaling pathways and their downstream activation target [3, 6].
However, based on its frequent overexpression and persistent activation CREB is also involved in the malignant transformation process [7]. This is mediated by aberrant activation of cAMP signal transduction-dependent pathways such as G-coupled receptors, receptor tyrosine kinase (RTK) like human epidermal growth factor receptor 2 (HER-2/neu) and the cytokine/JAK/STAT signaling cascades, as well as signaling events downstream of CREB.
HER-2/neu is a member of the transmembrane epidermal growth factor receptor (EGF-R) family and is physiological expressed in many epithelial cells. However, it is overexpressed and/or amplified in human tumor of distinct origin including mammary carcinoma [8] and colorectal cancer [9]. HER-2/neu transformation is associated with an increased cell proliferation, migration, enhanced cell cycle progression as well as a survival of patients [10]. Recently, we could demonstrate in the murine model system used also in this study, that HER-2/neu can increase the phosphorylation rate of CREB and that HER-2/neu overexpressing cells had more detectable CREB protein than the parental NIH3T3 cells [11].
As recently reviewed CREB overexpression and its constitutive activation was found in many solid tumors, including non-small cell lung carcinoma, glioblastoma, melanoma, mammary carcinoma, renal cell carcinoma and mesothelioma as well as in different hematopoietic malignancies [4, 12–18], leading to enhanced cell proliferation, reduced apoptosis, increased angiogenesis and migration rates. Downregulation of CREB expression inhibits proliferation, migration and/or invasion, which was accompanied by suppression of matrix metallopeptidases and proteins of the epithelial mesenchymal transition [18]. Furthermore, CREB overexpression can be correlated with clinico-pathological parameters, in particular with tumor grade, stage, metastasis formation, poor prognosis and reduced patients’ survival [14, 19–22]. In addition, CREB overexpression is often caused by an up-regulation of downstream target genes involved in neoplastic transformation as demonstrated by different high throughput analysis [23].
The expression level and activity of CREB is dynamically regulated by different mechanisms [24] and critical for maintaining a homeostatic cellular environment [25]. CREB transcriptionally controls a large number of putative target genes, which are involved in numerous cellular processes, such as signal transduction, cell structure, differentiation, cell survival as well as proliferation [17]. So far, amplifications and/or deletions in CREB have only been rarely detected suggesting that rather deregulation mechanisms of CREB appear to be responsible for its overexpression in tumors [26, 27]. Recently, a post-transcriptional control mechanism for CREB has been described, which seems to be mediated by microRNAs (miRs) known to for their binding to the 3' untranslated region (UTR) of CREB thereby contributing to tumorigenesis in different tumor models as demonstrated both in vitro and in vivo [28–31]. In addition, there is increasing evidence that different extra-cellular signals have an impact on the tumor microenvironment (TME), like hypoxia, pH variation and oxidative stress [32]. Furthermore, post-translational modifications (PTM) of CREB, which can be quite diverse including phosphorylation, ubiquitination, methylation, glycosylation and SUMOylation, might have an impact on CREB function(s) [3, 17, 33]. So far, a link between CREB expression levels/function(s) and tumor metabolism has not been identified. Therefore, this study analyzed the effects of CREB on the metabolism using a murine model of HER-2/neu transformation with distinct CREB expression and activation levels, which has been previously well characterized and was able to induce tumors in immunocompetend DBA mice [11, 17, 34].
RESULTS
CREB-mediated changes in the protein expression pattern
Since the level of CREB and HER-2/neu expression has been correlated with growth characteristics and altered signaling cascades [32], the protein expression pattern of HER-2/neu+ versus CREB-diminished HER-2/neu+ (shCREB) cells (Supplementary Figure 1A), with a knock down of up to 80% on the protein level (Supplementary Figure 1B, 1C) were determined by using two-dimensional gel electrophoresis (2-DE)-based proteome analysis and differentially expressed protein spots, defined by a 2-fold regulation, were identified by mass spectrometry. Overall 23 differentially expressed protein spots have been identified from three biological replicates (merged gels of all three experiments can be found in Supplementary Figure 2A), from which 13 proteins were down-regulated including four different forms of alpha-tubulin and 10 up-regulated upon CREB down-regulation. The differentially expressed proteins were mainly involved in metabolic processes (Table 1, Figure 1A, Supplementary Figure 2B), in particular in glycolysis (Figure 1B). Based on their distinct expression pattern the following candidate CREB-regulated proteins were selected and their expression validated by qPCR and/or Western blot analyses: The panel of potential targets includes the phosphoglycerate kinase (PKG)1, prolyl endopeptidase, peroxiredoxin (PRX)4, enolase (ENO), triose phosphate isomerase (TPI), pyruvate kinase M (PKM) and citrate synthase. In line with the proteomic profiling data reduced transcription levels of PKM, citrate synthase and TPI were found in CREB down-regulated HER-2/neu+ cells (Table 2), while the mRNA expression level of PGK1 remained unchanged and that of the prolyl endopeptidase (PEP) induced. In addition, a CREB-mediated transcriptional control was detected for cofilin and α-crystalline (Table 2). The decreased mRNA levels were associated with decreased protein expression levels of ENO, PRX4, PGK1, PGAM1, PKM and TPI in HER-2/neu+ shCREB versus HER-2/neu+ cells (Figure 1C), which was further confirmed by a down-regulated PKM, TPI, and PGK1 enzyme activity (Table 3). Other differentially expressed proteins were enzymes important for detoxification mechanisms (catalase, PRX4, superoxide dismutase [Cu-Zn]) or linked to the protein degradation process (26S proteasome non-ATPase regulatory subunit 13, PEP, leukocyte elastase inhibitor A) (Table 1).
Table 1: CREB-regulated proteins identified by 2-DE-based proteomics
Protein |
Acc no. |
Molecular weight |
IP |
Ratio |
Sequence |
Score (range) |
Localization |
Function |
|
|---|---|---|---|---|---|---|---|---|---|
pyruvate kinase isozymes M1/M2 |
P52480 |
58.3 |
55 |
7.18 |
0.09 - 0.201 |
19 |
78 - 212 |
cytoplasm and nucleus |
glycolysis, degradation of carbohydrates |
heat shock protein HSP 90-alpha |
P07901 |
83.5 |
4.93 |
0.145 - 0.192 |
14 |
56 - 62 |
cytoplasm and melanosome |
chaperon, cell cycle control, signal transduction |
|
tubulin alpha-1A chain |
P68369 |
50.7 |
45 |
4.94 |
0.179 - 0.45 |
25 |
83 - 102 |
cytoplasm and |
microtubules |
tubulin alpha-1B chain |
P05213 |
50.8 |
|
4.94 |
|
25 |
83 - 102 |
|
|
tubulin alpha-1C chain |
P68373 |
50.5 |
|
4.96 |
|
26 |
83 - 102 |
|
|
tubulin alpha-3 chain |
P68373 |
50.6 |
|
4.97 |
|
20 |
53 - 74 |
|
|
phosphoglycerate kinase 1 |
P09411 |
44.9 |
41 |
8.02 |
0.228 - |
38 |
66 - 116 |
cytoplasm |
glycolysis, degradation of carbohydrates, angiogenesis |
catalase |
P24270 |
59.7 |
57 |
7.72 |
0.248 - |
29 |
76 - 90 |
peroxisome |
detoxification of hydrogen peroxide |
alpha-enolase |
P17182 |
47.5 |
41 |
6.37 |
0.125 - |
35 |
116 - 128 |
cytoplasm and cell membrane |
glycolysis, growth, regulation of hypoxic events |
phosphoglycerate mutase 1 |
Q9DBJ1 |
28.9 |
30 |
6.67 |
0.077 - |
31 |
101 - 135 |
cytoplasm and membrane |
glycolysis |
vimentin |
P20152 |
53.7 |
60 |
5.06 |
0.244 - |
29 |
62 - 81 |
cytoplasm |
structural protein |
protein disulfide-isomerase A6 |
P09103 |
48.5 |
42 |
5.00 |
0.273 - |
21 |
78 - 80 |
ER lumen |
yield of disulfide bridges, chaperone |
triosephosphate isomerase |
P17751 |
32.6 |
29 |
5.56 |
0.246 - |
33 |
92 - 191 |
nucleus |
glycolysis, gluconeogenesis |
prolyl endopeptidase |
Q8C167 |
81.6 |
77 |
5.44 |
2.144 - |
20 |
136 - 202 |
cytoplasm |
serine protease, synthesis and degradation of peptide hormones |
spliceosome RNA helicase Ddx39b |
Q9Z1N5 |
49.4 |
50 |
5.44 |
2.01 - |
35 |
61 - 95 |
nucleus |
splicing |
26S proteasome non-ATPase regulatory subunit 13 |
Q9WVJ2 |
43.1 |
39 |
5.46 |
2.352 - |
57 |
65 - 245 |
cytoplasm |
protein degradation, regulation of proteasomal activity |
superoxide dismutase [Cu-Zn] |
P08228 |
16.1 |
6.02 |
2.574 - |
38 |
80 - 91 |
cytoplasm |
radical detoxification |
|
flavin reductase (NADPH) |
Q923D2 |
22.2 |
24 |
6.49 |
2.696 - |
38 |
84 - 104 |
cytoplasm |
oxidoreductase |
peroxiredoxin-4 |
O08807 |
31.2 |
28 |
6.67 |
2.704 - |
40 |
59 - 98 |
cytoplasm and extracellular |
redox regulation, regulation of NF-k-B activity |
ATP-dependent RNA helicase DDX39A |
Q8VDW0 |
49.5 |
5.46 |
3.473 - |
43 |
167 - 188 |
cytoplasm and nucleus |
splicing |
|
leukocyte elastase inhibitor A |
Q9D154 |
42.7 |
40 |
5.85 |
7.577 - |
33 |
138 - 183 |
cytoplasm |
regulation of protease activity |
cofilin-1 |
P18760 |
18.7 |
21 |
8.22 |
21.579 - 24.771 |
46 |
92 - 107 |
cytoplasm and nucleus |
cell morphology and cytoskeleton, mitosis |
alpha-crystallin B chain |
P23927 |
20.0 |
22 |
6.76 |
20.082 - 86.972 |
58 |
108 - 173 |
cytoplasm and nucleus |
stress induced chaperone, protection against protein aggregation |
Functions, localization, IP, estimated molecular weigth and accession number of the proteins were added according to the MASCOT and SwissProt database.Up-regulated proteins after CREB knock down are marked in red, down-regulated proteins in green. The red bold value in the row “molecular weight found” indicates samples with an alteration of the molecular weight by 15 or more percent compared to the estimated molecular weight. For the ratio and the score value the range of the three experiments is given.
Table 2: mRNA expression level of metabolic and stress related genes as identified to be differentially expressed in 2D gel electrophoresis of CREB down-regulated vs. HER-2/neu+ and NIH3T3 cells
|
NIH3T3 |
NIH3T3 shCREB |
HER-2/neu+ |
HER-2/neu+ shCREB |
|---|---|---|---|---|
citrate synthase |
1 |
0.87 +/- 0.28 |
1.09 +/- 0.13 |
0.34 +/- 0.05 * |
cofilin 1 |
1 |
0.68 +/- 0.12 * |
0.41 +/- 0.16 * |
0.93 +/- 0.22 * |
α-crystalline B |
1 |
0.61 +/- 0.17 * |
0.45 +/- 0.12 * |
0.2 +/- 0.04 * |
peroxiredoxin 4 |
1 |
1.23 +/- 0.42 |
0.81 +/- 0.17 |
1.76 +/- 0.18 * |
PGAM1 |
1 |
0.89 +/- 0.17 |
1.87 +/- 0.12 * |
1.21 +/- 0.2 * |
PGK1 |
1 |
0.68 +/- 0.18 * |
1.76 +/- 0.45 * |
0.78 +/- 0.02 * |
prolyl endopeptidase |
1 |
0.42 +/- 0.12 * |
0.3 +/- 0.08 * |
0.57 +/- 0.08 * |
pyruvate kinase M1/2 |
1 |
0.62 +/- 0.05 * |
1.68 +/- 0.14 * |
0.12 +/- 0.03 * |
triose phosphate isomerase |
1 |
0.7 +/- 0.12 * |
4.97 +/- 1.11 * |
4.82 +/- 1.23 |
Expression levels of the parental NIH3T3 were normalized to 1. For the significance of the row HER-2/neu+ the values were compared to that of the parental NIH3T3.
The expression of the genes analysed was compared to parental NIH3T3 cells (normalizied to 1). * statistical significant (p < 0.05).
Table 3: Modulation of enzymatic activities by CREB down-regulation in HER-2/neu+ cells
Activity [U/mg total protein] |
HER-2/neu+ |
HER-2/neu+ shCREB |
|---|---|---|
PKM |
12.64 + 0.52 |
3.01 +/- 0.7 * |
TPI |
38.64 +/- 0.31 |
6.81 +/- 0.47 * |
PGAM1 |
5.24 +/- 0.61 |
2.28 +/- 0.24 * |
PGK |
5.45 +/- 0.62 |
2.56 +/- 0.21 * |
prolyl endopeptidase |
0.63 +/- 0.45 |
1.57 +/- 0.54 |
peroxiredoxin 4 |
1.48 +/- 0.79 |
3.44 +/- 0.35 * |
The enzyme activity was calculated to the protein concentration.
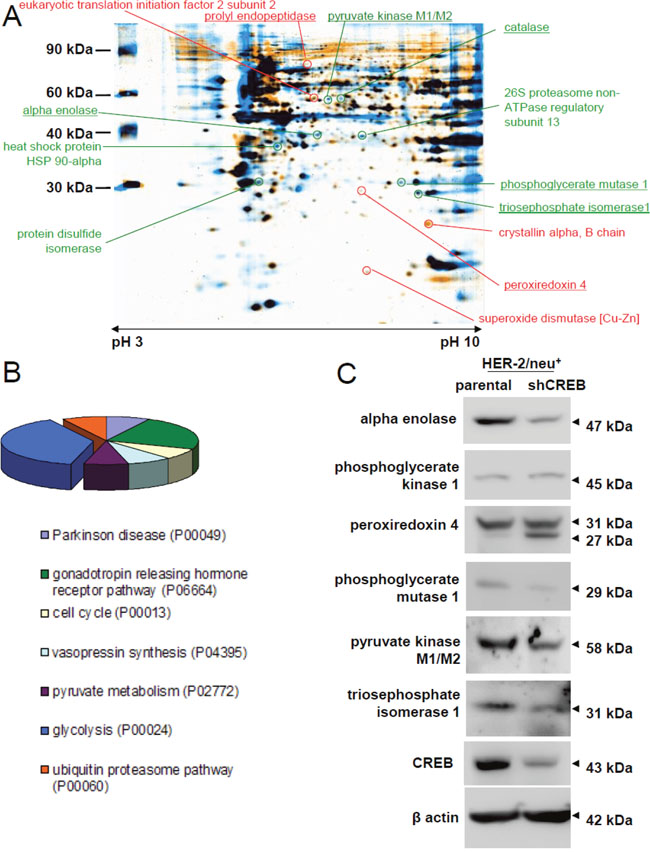
Figure 1: Influence of CREB knock down on metabolism and glycolytic enzymes. (A) HER-2/neu+ and CREB-downregulated HER-2/neu+ (shCREB) cells were lysed and the protein pattern was analyzed by 2-DE gel electrophoresis following staining of the gels with colloidal Coomassie Blue. Differentially regulated protein spots of interest were digested with trypsin and the fragments were identified by MS/MS-TOF analysis. The picture represents a representative overlay of merged profiles (four technical replicates for both cell lines) in sum of three independent experiments. Some identified proteins are marked and listed. Red marked spots were up-regulated in CREB knock down cells, whereas green marked spots were down-regulated. The underlined proteins were further validated by measuring the mRNA expression status. (B) The graph shows the distribution pattern of the identified targets in (A) based on their classification into various pathways, functional roles or diseases and was performed by using the PANTHER database (pantherdb.org). (C) Validation of the differentially expressed proteins in (A). The representative protein expression pattern in one HER-2/neu overexpressing cell line (HER-2/neu+, left lane) and one shCREB HER-2/neu+ (right lane) is shown for metabolic enzymes. The blot represents one of three experiments.
In silico analysis of gene promoters from differentially expressed proteins upon CREB down-regulation revealed that most of the identified proteins were controlled by half CRE sites (TGACG or CGTCA), whereas full CRE sites (TGACGTCA) were merely found in promoters of up-regulated proteins (Tables 4 and 5). Since the promoter of the oncogene HER-2/neu contains no CRE elements, its expression was not affected by CREB down-regulation [11].
Table 4: CRE elements in gene promoter of differential regulated proteins identified after CREB knock down by 2-DE and MS
Symbol |
Gene name |
Accession |
CRE prediction |
CRE flag |
Full site |
Half site |
Conserved CRE |
CRE cluster |
pHMM+Pos |
Chrom. localization |
Strand |
Pos |
|---|---|---|---|---|---|---|---|---|---|---|---|---|
Pkm2 |
“pyruvate kinase, muscle” |
NM_011099 |
Others |
ht h |
|
ht_-1433 h_-2 |
|
|
|
chr9 |
+ |
59830243 |
Pkm2 |
“pyruvate kinase, muscle” |
NM_011099 |
Others |
none |
|
h_506 h_630 |
|
|
|
chr9 |
+ |
59830243 |
Hspca |
“heat shock protein 1, alpha” |
NM_010480 |
Others |
h |
|
ht_-4769 ht_-3435 h_0 ht_830 h_893 |
|
|
|
chr12 |
- |
104744737 |
Tuba1 |
“tubulin, alpha 1” |
NM_011653 |
Others |
ht |
|
ht_-2171 |
|
|
|
chr15 |
- |
99318440 |
Tuba2 |
“tubulin, alpha 2” |
NM_011654 |
Others |
none |
|
|
|
|
|
chr15 |
- |
99299381 |
Tuba6 |
“tubulin, alpha 6” |
NM_009448 |
Others |
h |
|
ht_-3468 h_-497 h_18 ht_575 |
|
|
|
chr15 |
+ |
99396317 |
Tuba7 |
“tubulin, alpha 7” |
NM_009449 |
Others |
ht |
|
ht_95 |
|
|
|
chrUn_random |
+ |
117747169 |
Pgk1 |
phosphoglycerate kinase 1 |
NM_008828 |
Others |
ht |
|
ht_-1021 ht_-707 ht_512 |
|
|
|
chrX |
+ |
91115110 |
Cat |
catalase |
NM_009804 |
Others |
ht |
|
h_-4839 ht_-2392 h_910 |
|
|
|
chr2 |
- |
104935582 |
Eno1 |
“enolase 1, alpha non-neuron” |
NM_023119 |
Others |
none |
|
h_527 |
|
|
|
chr4 |
+ |
146873883 |
Pgam1 |
phosphoglycerate mutase 1 |
NM_023418 |
Others |
none |
|
ht_-4353 ht_-3676 |
|
|
|
chr19 |
+ |
41498057 |
Vim |
vimentin |
NM_011701 |
others |
ht h |
|
ht_-580 h_-226 |
|
|
|
chr2 |
+ |
13567777 |
Tpi |
triose phosphate isomerase |
NM_009415 |
others |
none |
|
h_-3599 |
|
|
|
chr6 |
- |
125622026 |
Prep |
prolyl endopeptidase |
NM_011156 |
others |
ht |
|
ht_-4229 ht_-918 ht_613 |
|
|
|
chr10 |
+ |
44917660 |
Bat1a |
HLA-B-associated transcript 1A |
NM_019693 |
CRE_TATA |
none |
|
ht_-4510 ht_-3773 ht_-3526 h_886 |
|
|
FF_human_1.0_-4904_mouse_1.3_-5083 |
chr17 |
+ |
33858338 |
Psmd13 |
“proteasome (prosome, macropain) 26S subunit, non-ATPase, 13” |
NM_011875 |
others |
ht h |
|
h_-4162 ht_-1835 h_-65 ht_866 |
|
|
|
chr7 |
+ |
129902896 |
Blvrb |
biliverdin reductase B (flavin reductase (NADPH)) |
NM_144923 |
CRE_NoTATA |
H h |
|
ht_-4463 H_-1237 h_-1191 |
H_-1237_635 |
|H_-1237_h_-1191_0 |
|
chr7 |
+ |
19020950 |
Prdx4 |
peroxiredoxin 4 |
NM_016764 |
CRE_TATA |
HT FH h |
FH_-1215 |
HT_-2035 h_-101 |
FH_-1215_378 HT_-2035_177 |
|
|
chrX |
- |
135097408 |
Ddx39 |
DEAD (Asp-Glu-Ala-Asp) box polypeptide 39 |
NM_197982 |
CRE_TATA |
ht |
|
ht_-4185 ht_-669 ht_702 |
|
|
FH_human_2.2_-3409_mouse_1.7_-3491 |
chr8 |
+ |
82993770 |
NE |
neutrophil elastase |
NM_015779 |
others |
none |
|
h_-4246 h_505 |
|
|
|
chr10 |
+ |
79703208 |
Cfl1 |
“cofilin 1, non-muscle” |
NM_007687 |
CRE_TATA |
none |
|
ht_-3170 ht_558 |
|
|
FF_human_1.2_-8876_mouse_1.2_-8835 |
chr19 |
- |
5190328 |
Cfl1 |
“cofilin 1, non-muscle” |
NM_007687 |
CRE_TATA |
none |
|
|
|
|
FF_human_1.2_-8876_mouse_1.2_-8835 |
chr8 |
+ |
41275610 |
Cryab |
“crystallin, alpha B” |
NM_009964 |
others |
ht h |
|
ht_-4617 ht_-3003 ht_-1195 h_-716 |
|
|
|
chr9 |
+ |
50875865 |
Chr: chromosome.
Table 5: CRE elements in gene promoter of differential regulated proteins identified after CREB knock down by qPCR
Symbol |
Gene name |
Accession |
CRE prediction |
CRE flag |
full site |
Half site |
Conserved CRE |
CRE cluster |
pHMM+Pos |
Chrom localization |
Strand |
Pos |
|---|---|---|---|---|---|---|---|---|---|---|---|---|
ERBB2 * (HER-2;HER2;NEU; NGL;TKR1) |
“v-erb-b2 erythroblastic leukemia viral oncogene homolog 2, neuro/glioblastoma derived oncogene homolog (avian)” |
NM_004448 |
others |
none |
|
|
|
|
|
chr17 |
+ |
38231358 |
Cs |
citrate synthase |
NM_026444 |
others |
ht |
|
ht_-2966 ht_-2751 |
|
|
|
chr10 |
+ |
128362478 |
Es10 |
esterase 10 |
NM_016903 |
others |
ht h |
|
h_-2215 ht_151 ht_481 |
|
|
|
chr14 |
+ |
65179735 |
Slc2a1 |
“solute carrier family 2 (facilitated glucose transporter), member 1” |
NM_011400 |
CRE_NoTATA |
ht h |
|
ht_-3367 ht_-1283 h_62 h_91 h_560 |
|
|h_62_h_91_0 |
|
chr4 |
+ |
117243469 |
Gss |
glutathione synthetase |
NM_008180 |
others |
ht h |
|
ht_-2831 h_-2156 h_119 h_732 |
|
|
|
chr2 |
- |
157439425 |
* - Erbb2 expression is unregulated after CREB knock down.
Chr: chromosome.
Association of CREB and hypoxia-induced changes on the cell metabolism of HER-2/neu+ cells
The comparative proteomics profiling of HER-2/neu+ cells and its shCREB derivatives suggests a link between the CREB expression levels/activation status and metabolic changes. In order to determine the functional relevance of this altered expression pattern, intracellular pH values were determined in the model system. Reduced intracellular pH values were detected in HER-2/neu+ cells when compared to NIH3T3 cells, while the intracellular pH values were restored to that of NIH3T3 cells by CREB down-regulation in HER-2/neu+ cells (Figure 2A). As expected treatment of the cells with the proton pump inhibitor Esomeprazole (ESOM), which served as control, strongly decreased the intracellular pH value in CREB down-regulated HER-2/neu+ cells (Figure 2A).
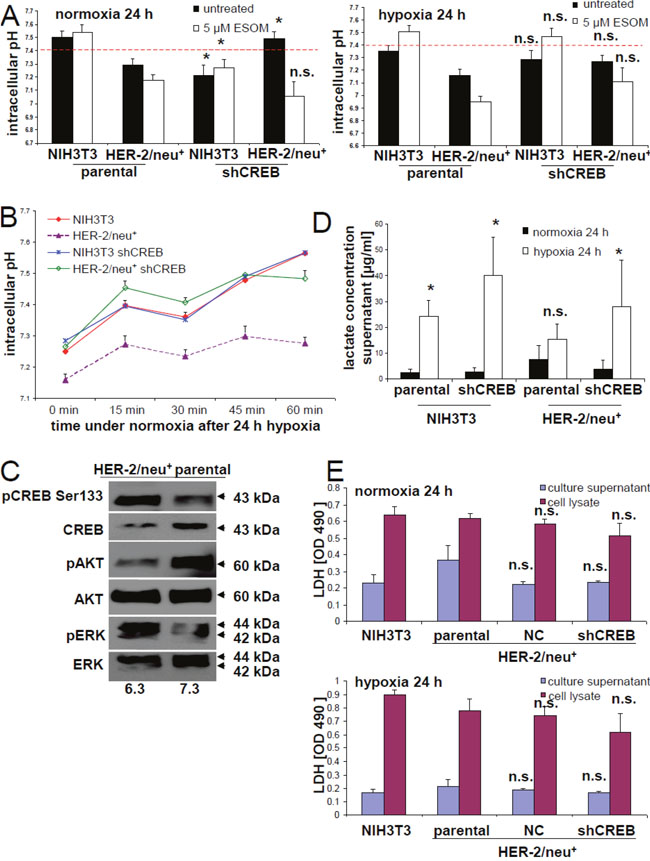
Figure 2: Induction of an altered microenvironment in CREB-reduced cells under hypoxia. (A) Intracellular pH was determined by staining with BCECF-AM under the conditions given in Material and Methods. As a control, cells were treated with the inhibitor ESOM (5 μM/24 h) was used blocking the H+/K+ pump. (B) The intracellular pH was followed during the re-oxygenation phase after cultivation under hypoxic conditions for 24 h. The data represents one of two independently performed experiments. (C) The effects of distinct pH conditions in the culture medium on the phosphorylation of CREB, AKT and ERK was determined by Western blot. The blot represents one of two experiments. (D) Lactate levels in the culture supernatants of NIH3T3 (HER-2/neu-) vs. HER-2/neu+ cells were determined using a commercial kit. Data in the columns represent the average of three different experiments along with the error bars. (E) LDH activity in the supernatant and in the cells was measured with a cytotoxicity assay as described in Materials and Methods. The columns and bars represent the data from three experiments.
Although a correlation between hypoxic conditions and metabolic reprogramming as well as the survival of tumor cells has been demonstrated [35–37], the role of CREB in this process has not yet been analyzed in detail. Therefore, the effect(s) of hypoxia on the energy metabolism of HER-2/neu+ and HER-2/neu+ shCREB as well as HER-2/neu- (NIH3T3) cells was compared by determining the intracellular and extracellular pH values, lactate and lactate dehydrogenase (LDH) concentrations. Under hypoxic conditions the intracellular pH was even further reduced in HER-2/neu+ cells, but also reduced in CREB down-regulated HER-2/neu+ cells (Figure 2A). The hypoxia-mediated decline of the intracellular pH values in HER-2/neu+ cells could be restored over time by culturing these cells under normoxia suggesting that this is a rather reversible process (Figure 2B).
Altered extracellular pH conditions also affected both CREB activity and CREB-relevant signaling pathways as determined by Western blot analysis of HER-2/neu+ cells cultured at pH 6.3 and pH 7.3, respectively (Figure 2C). A shift from slightly acidic towards neutral pH conditions resulted in a decreased pCREBSer133 phosphorylation rate in HER-2/neu+ cells, which was accompanied by a down-regulation of pERK and an up-regulation of pAkt as well as of total CREB.
The modulation of the intracellular pH values was linked to changes of the LDH expression levels and of lactate concentrations as determined in the supernatants of normoxic and hypoxic HER-2/neu+ and CREB down-regulated HER-2/neu+ cells: The lactate concentrations were increased in HER-2/neu+ vs. HER-2/neu+ shCREB and NIH3T3 cells, while hypoxia enhanced lactate concentrations in all cell supernatants tested with the highest increase in supernatants of NIH3T3 cells (Figure 2D). Total LDH concentrations were comparable across all cells under normoxic conditions. Furthermore, culturing the cells under hypoxic conditions caused an up-regulation of total LDH activity in all cell lines to a similar extent (Figure 2E), while CREB knock down had no significant influence.
HIF-1α inhibitor blocks CREB activity and regulates metabolism
Since hypoxia (1% O2) can increase the phosphorylation of CREB at serine residue 133 [32], it was analyzed whether hypoxia-related TFs, like HIF-1α, can influence the CREB activity. Therefore, HER-2/neu+ cells were incubated with the HIF-1α inhibitor 2-methoxyestradiol (2-ME) for 24 h resulting in a decreased HIF-1α protein expression (Figure 3A), which was linked with a down-regulation of CREB phosphorylation at serine 133 in HER-2/neu+ cells. This effect was already visible upon treatment of HER-2/neu+ cells with 1 μM 2-ME and was not further enhanced in the presence of higher 2-ME concentrations (Figure 3B). In contrast, NIH3T3 cells exhibited the highest CREB phosphorylation at 1 μM 2-ME, which was strongly reduced with higher concentrations of this substance. Furthermore, electromobility shift assays (EMSA) revealed that 2-ME inhibited the formation of CREB-CRE complexes by decreasing the phosphorylation of CREB (Figure 3C).
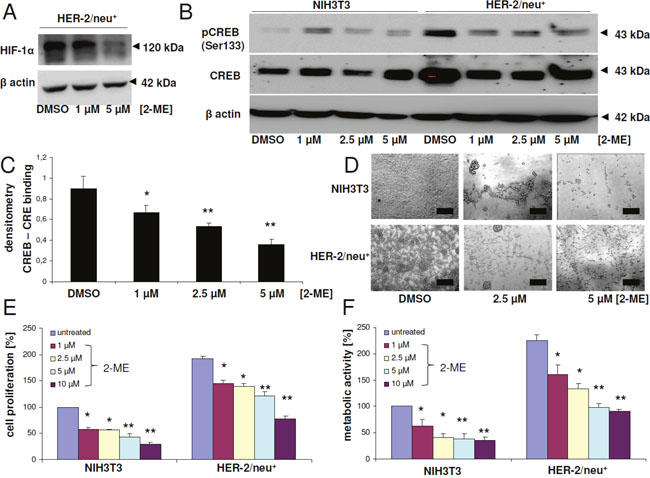
Figure 3: Modulation of CREB activity, proliferation and metabolic activity upon treatment with the HIF-1α inhibitor 2-methoxyestradiol. (A) HER-2/neu+ cells were treated with 2-ME or with DMSO as the solvent control for 24 h with the indicated concentrations and HIF-1α expression was analyzed by Western blot. β actin served as a loading control. The bands represent one of three independent experiments. (B) NIH3T3 cells and HER-2/neu+ cells were cultivated for 24 h with 2-ME or with DMSO before CREB phosphorylation and CREB protein expression was determined by Western blot. 50 μg total protein per lane were used. The blot represents one of two independent experiments. (C) Binding of CREB to the CRE element was determined by EMSA analysis. Nuclear extracts of HER-2/neu+ cells were treated with DMSO or the indicated concentration of 2-ME prior to an EMSA reaction by incubating a biotinylated CRE oligonucleotide with the nuclear extract in reaction buffer. Following gel electrophoresis, the complexes were blotted onto a nylon membrane and DNA was detected with streptavidin-HRP. The diagram represents the densitometry of the shifted CREB-CRE complex obtained from two independent experiments. (D) The morphology of the 2-ME-treated cells was documented. The bar represents 50 μm. (E) Cell proliferation was measured by a BrdU ELISA in 96 well plate formats. Cells were incubated with BrdU and 2-ME or DMSO as the untreated control, respectively, for 24 h and the integrated BrdU was detected with a specific antibody after cell fixation. Columns represent the mean of three independent experiments with two technical replicates. The data were normalized to the DMSO-treated NIH3T3 control, which was set to 100%. (F) Metabolic or mitochondrial activity of the cells was measured by adding XTT reagent for 4 h to the cells after 24 h incubation period with the inhibitors. The absorption was determined with an ELISA reader. Columns represent mean values of three independent experiments with three technical replicates each. The data of all columns were normalized to the DMSO-treated NIH3T3 control, which was set to 100%.
In addition, blocking HIF-1α changed the morphology of NIH3T3 from a fibroblast-like to a foci-like grown pattern, while HER-2/neu+ cells lost their ability to form bigger foci (Figure 3D). It is noteworthy that the treatment of both cell lines with 10 μM 2-ME did not altered the cell vitality significantly (data not show), but decreased concentration-dependent the proliferation (Figure 3E) and the metabolic / glycolytic activity (Figure 3F).
CREB-mediated control of apoptosis in HER-2/neu+ cells
In order to determine whether HER-2/neu+ cells are more resistant to apoptosis compared to shCREB cells, cells were cultured in medium supplemented with different FCS and glucose concentrations. CREB down-regulated HER-2/neu+ cells, but not the parental HER-2/neu+ cells cultured in 0.1 % FCS showed a reduced cell vitality as determined by flow cytometry upon annexin V / PI stainings (Figure 4A). Cultivation of HER-2/neu+ cells with increasing FCS concentrations correlated with higher CREB and pCREB levels, which were further correlated with the higher frequency rates of vital cells (Figure 4B).
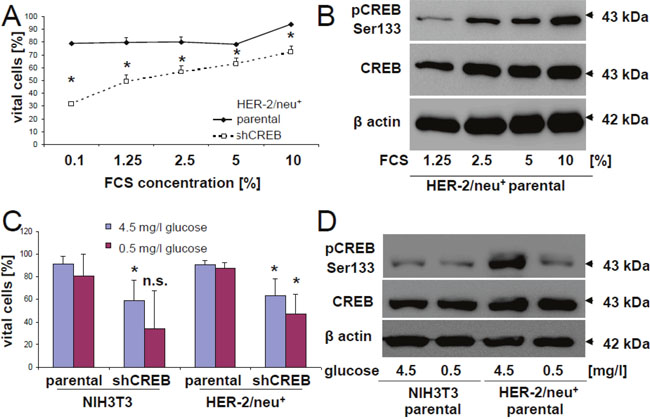
Figure 4: Regulation of the phosphorylation rate of CREB by glucose and FCS. (A) HER-2/neu+ and shCREB derivatives were cultivated in EMEM supplemented with different FCS concentrations, before apoptosis was measured by flow cytometry after annexin V/PI staining as described in Materials and Methods. 5000 cells were measured per histogram and the experiment was independently repeated two additional times. (B) HER-2/neu+ cells were incubated with the indicated concentrations of FCS and the corresponding phosphorylation rate of CREB (upper panel) and of total CREB (middle panel) were determined by immune blotting whereas the detection of β-actin served as loading control. The blot represents one of two experiments. (C) HER-2/neu+ and shCREB derivatives were cultivated in RPMI with high (4.5 g/l) or low (0.5 g/l) glucose concentrations. The glucose content after addition of 10 % FCS was verified by DNSA measurement. The apoptosis rate of the cells after 24 h cultivation was quantified as described in (A). Data are the mean value and error bars from three experiments. (D) NIH3T3 and HER-2/neu+ cells were cultivated under low and high concentrations of glucose, before the corresponding phosphorylation rate of CREB was analyzed by Western blot as described in Materials and Methods. The blot represents one of two experiments.
In addition, glucose deprivation resulted in reduced cell vitalities in particular in CREB down-regulated HER-2/neu+ cells. The increased apoptosis rates were linked to reduced pCREB levels (Figure 4C) suggesting that growth properties, in particular the neoplastic features of HER-2/neu+ cells, are tightly linked with cell vitality. Moreover, supplementation of high glucose concentrations caused a significant induction of the corresponding pCREB levels (Figure 4D).
Influence of altered CREB expression levels on the cellular metabolism
Based on the results of the proteomics profiling and glucose deprivation experiments alterations within the glycolytic pathway in HER-2/neu+ cells vs. CREB down-regulated HER-2/neu+ cells are expected. Therefore, modulations of glycolysis pathways were determined by the extracellular acidification rates (ECAR). CREB down-regulation in HER-2/neu+ cells led to a marked decrease of the ECAR under baseline conditions as well as induction of glycolysis by adding glucose (Figure 5A). The glycolytic capacity of the cells, meaning the highest glycolytic activity under inhibition of the mitochondrial ATPase with oligomycin was lower in CREB knock down cells. This was accompanied with a diminished glycolytic activity observed in these cells (Figure 5B). In line with this observation, a reduced glucose uptake rate was recorded in CREB down-regulated HER-2/neu+ cells (Figure 5C), which was further associated with significantly decreased expression levels of the glucose transporter GLUT1 (Figure 5D) as well as with diminished pyruvate and citrate concentrations (Figure 5E, 5F). Interestingly, the concentrations of both glycolytic metabolites were reduced in the oncogenic HER-2/neu+ cell line after CREB knock down, but not in the parental NIH3T3 after diminishing of CREB by shRNA (Figure 5E, 5F). Under hypoxia the loss of pyruvate was even more pronounced in HER-2/neu+ shCREB cells, while it was unchanged in NIH3T3 shCREB cells.
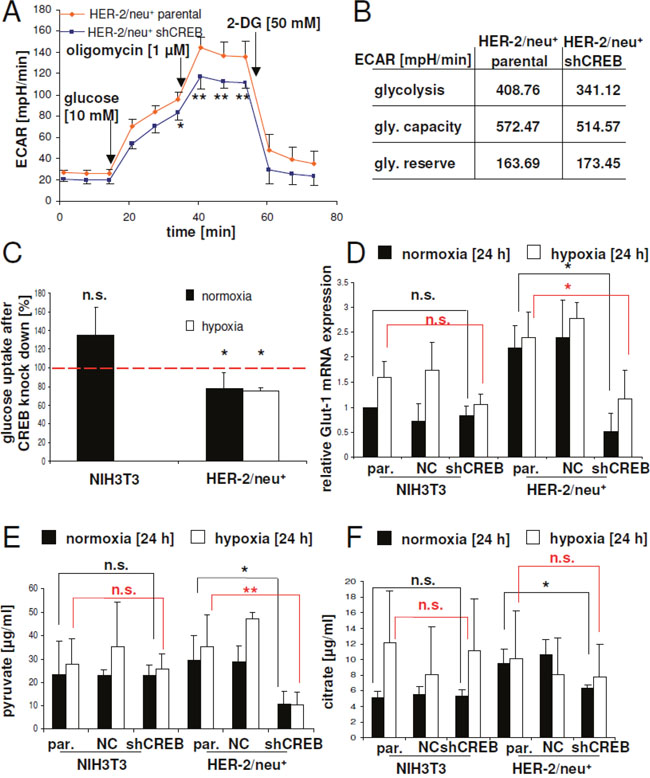
Figure 5: CREB-mediated regulation of glucose uptake by Glut-1 expression and glycolysis. (A) Glycolytic activity was measured by the extracellular acidification rate. At the indicated time points glucose, oligomycin or 2-desoxyglucose (2-DG) was added. Data represents four independent experiments with eight replicates. (B) Glycolytic capacity and reserve were calculated with the data from (A). (C) Glucose uptake in NIH3T3 and HER-2/neu+ cells as well as their shCREB derivatives was analysed under normoxic and hypoxic conditions as described in Materials and Methods. Cells were seeded into 96 well plates with black walls in EMEM and were cultivated for 20 h under normoxic or hypoxic conditions. The cells were washed twice with PBS and 0.1 mM 2-NBDG was added. After 20 min. the cells were washed again with PBS and the plate was measured in a fluorescence ELISA at 485/525 nm. The experiment was repeated two more times. (D) The Glut-1 expression in shCREB transfectants and parental cell lines was determined by qPCR. The results are expressed as bar charts with mean and standard error from three independent experiments. The statistical analysis (between parental and shCREB cell lines) in black is from the normoxic dataset, while the red symbols are from the hypoxic dataset. Expression data were normalized to the cell line NIH3T3, which was set to “1”. (E, F) The concentrations of pyruvate (E) and citrate (F) in cell lysates under normoxia and hypoxia were measured with colorimetrical tests. The results are expressed as bar charts with mean and standard error from four independent experiments with two wells each. The statistical analysis (between parental and shCREB cell lines) in black is from the normoxic dataset, while the red symbols are from the hypoxic dataset.
To validate if the loss of CREB binding activity has an effect on the cellular metabolism, two CREB inhibitors were used: 666-15, a potent inhibitor of CREB-regulated gene transcription [38], which disturbs the interaction of CREB and the CREB binding protein (CBP) resulting also in in vivo anticancer effects, and surfen, affecting the CREB-CRE complex [17, 39]. As determined by EMSA surfen prevented the formation of the CREB-CRE complex, while 666-15 had no effect on this interaction (Supplementary Figure 3A). Furthermore, surfen cannot displace ethidium bromide from the CRE oligonucleotide in a cell-free assay system (Supplementary Figure 3B) indicating that surfen did not bind to the CRE DNA element, but could interact with the basic leucine zipper of CREB. Both inhibitors diminished the proliferation by slowing down the cell cycle transition from the G1 to the S phase (Supplementary Figure 3C). This effect was more pronounced upon treatment with 666-15 than with surfen. Both 666-15 and surfen lowered the metabolic activity of HER-2/neu+ cells, while 666-15 but not surfen diminished the metabolic activity of NIH3T3 cells (Figure 6A).
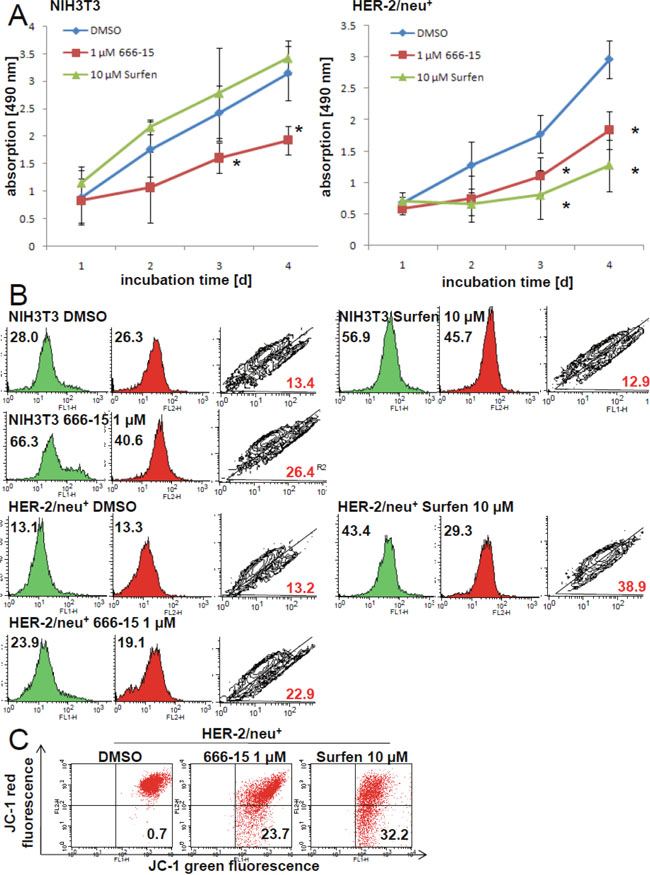
Figure 6: Inhibition of the mitochondrial activity and increased amount of dysfunctional mitochondria by CREB inhibitors 666-15 and surfen. (A) NIH3T3 and HER-2/neu+ cells were incubated with 1 μM 666-15, 10 μM surfen or DMSO up to four days. For each time point XTT reagent was added for four h to the cell culture medium and cells were incubated at 37°C. Absorption was determined in 96 well plates with an ELISA reader. Data represents three independent experiments with three wells each. (B) The effect of the CREB inhibitors on “mitochondrial mass” and the mitochondrial activity was measured by staining the cultivated cells (24 h incubation period with the inhibitors) with 100 nM MitoTracker green and 100 nM MitoTracker red for 30 min following flow cytometrical analysis. 5000 events are displayed in every histogram and the mean fluorescence value is given in the histogram. Green areas are the MitoTracker green signals and the red filled histograms are the MitoTracker red signals. The contour plot shows the cells with dysfunctional mitochondria (R2) and the red number is the percentage of these cells with more mitochondrial “mass” (x axis) than mitochondrial activity (y axis). One out of three independent dataset is shown. (C) HER-2/neu+ cells treated with 666-15 or surfen for 24 h were stained with the dye JC-1 for 20 min at 37°C and the complex formation was analyzed by flow cytometry. CCCP was used as a positive control to set the quadrants. The number in the lower right quadrant is the amount of cells with a decreased mitochondrial potential. Histograms are from one of two independent experiments.
Using specific fluorescence dyes we could show that 666-15 treatment resulted in an accumulation of dysfunctional mitochondria in HER-2/neu+ and NIH3T3 cells, while for surfen treatment this effect was only detectable in the HER-2/neu-transformed cell line (Figure 6B). This accumulation of dysfunctional mitochondria can be explained by the CREB-regulated “master switch for mitochondrial biogenesis” peroxisome proliferator-activated receptor gamma coactivator 1α [32] or by the loss of autophagy-related proteins ATG5 and ATG7 (Supplementary Figure 4A), a mechanism that can prevent mitochondrial dysfunctions in several cell lines [40, 41]. Furthermore, under normoxia and hypoxia an increased intracellular lactate level was determined in HER-2/neu+ shCREB cells (Supplementary Figure 4B). This can be caused by dysfunctional mitochondria and leading to an acidosis. Since pyruvate and citrate levels were decreased upon CREB knock down, we analyzed the levels of the metabolite acetyl-CoA. In both tested cell lines the concentration of acetyl-CoA was was increased when compared to the parental and to the vector control (Supplementary Figure 4C).
Since a loss of mitochondrial membrane potential was detected under treatment with both inhibitors (Figure 6C), the release of cytochrome c and ROS into the cytoplasm is suggested.
Detoxification mechanisms regulated by CREB
One of the CREB-regulated proteins identified to be differentially expressed upon CREB down-regulation was catalase, an enzyme involved in the detoxification of hydrogen peroxide. Since oxidative stress can increase CREB phosphorylation and activity, the effect of different concentrations of H2O2 on HER-2/neu+ cells was determined. While low concentrations (10 μM) increased the CREB phosphorylation rate at Ser133, but not at Ser121 during 4 h, high concentrations of 50 μM H2O2 significantly increased CREB phosphorylation after 30 min. to 4 h (Figure 7A). The phosphorylation rate of AKT was strongly increased in response to exposure to 50 μM H2O2, while the phosphorylation level of ERK reached the maximal signal after a 4 h incubation period.
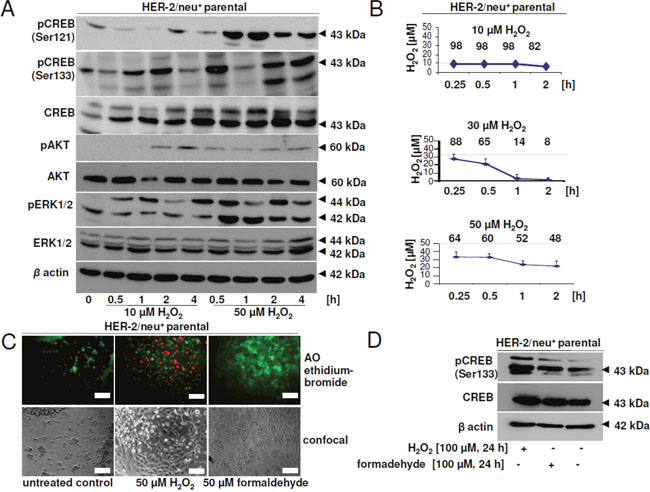
Figure 7: Effect of hydrogen peroxide and formaldehyde on CREB activity and viability. (A) HER-2/neu+ cells were incubated with 10 or 50 μM H2O2 for the indicated time and phosphorylation of CREB, AKT and ERK was detected by Western blotting. Staining with an anti-β-actin mAb served as a loading control. The picture shows one of two independent Western blots. (B) Hydrogen peroxide in the cell culture supernatant was measured with the xylenol orange method and was compared to a standard curve. The red line indicates the starting concentration of H2O2 and the numbers are the remaining % of H2O2 at each time point. Data are the mean values from two independent experiments. (C) 80 % confluent cells were incubated with H2O2 or formaldehyde for 24 h and the dead cells were stained by adding 10 μM acridin orange and 10 μM ethidium bromide after treatment. Cells were visualized with a fluorescence microscope. The bar represents 50 μm. (D) Phosphorylation of CREB protein after long-term incubation with H2O2 or formaldehyde (24 h) was detected by specific antibodies as described in Materials and Methods. The experiment was performed three times and the blot is one representative picture.
The most efficient detoxification of H2O2 was determined in the presence of 30 μM H2O2. Under these conditions almost 90 % of H2O2 was degraded after 2 h, while at higher or lower concentrations more than 50 % of the starting H2O2 levels remained still detectable in the given culture supernatants (Figure 7B). Exposure to 50 μM H2O2 significantly induced necrosis after 24 h (Figure 7C), which was absent at lower H2O2 concentrations (data not shown). Furthermore, incubation with formaldehyde over the same time had no effect on the vitality of the cells. However, long-term intervals (24 h) exposure resulted in increased phosphorylation rates of CREB (Figure 7D) regardless of the type of toxic compound (H2O2, formaldehyde).
Using the ROS sensitive dye 2,7-DCFH an accumulation of ROS in CREB down-regulated cells and in HER-2/neu+ transformants was detected, which was higher than that of parental NIH3T3 cells (Figure 8A). In the presence of the HIF-1α inhibitor 2-ME an accumulation of ROS was also found in HER-2/neu+ cells (Figure 8B). CREB knock down decreased the cell viability in the presence of H2O2 but not of formaldehyde-treated cells up to 60 % when compared to untreated cells (Figure 8C). We therefore analyzed the mRNA expression of three “detoxifying” enzymes important in cellular homeostasis: catalase, esterase D, an enzyme an enzyme involved in the detoxification of formaldehyde and glutathione synthetase, which is an important antioxidant. Only catalase mRNA expression levels were decreased in response to CREB down-regulation, while the mRNA expression levels of esterase D was not altered (Figure 8D). The decreased mRNA expression levels of catalase was accompanied by diminished catalase protein expression (Figure 8E) and consequently by a lower catalase activity (Figure 8F). In addition, glutathione synthetase was 2.1-fold up-regulated in CREB down-regulated HER-2/neu+ cells, but not in the parental NIH3T3 cells. However, free glutathione remained unaltered in all cell lines analyzed (Figure 8G).
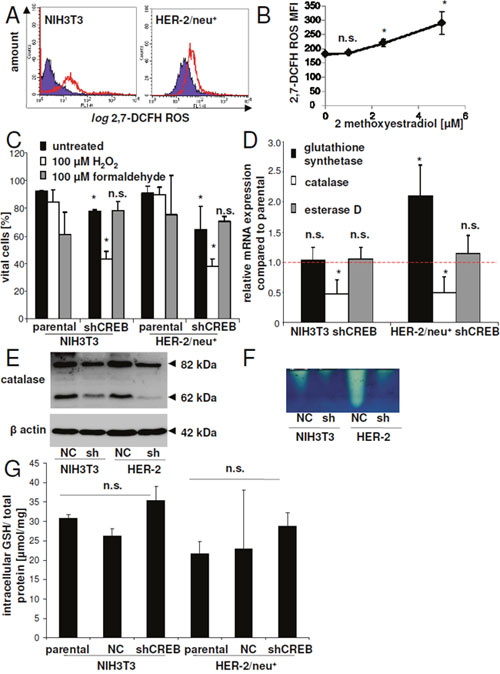
Figure 8: Regulation of detoxification enzymes by CREB. (A) The ROS status/cell was determined by flow cytometry after staining with the ROS sensitive dye 2,7-DCFH. 10,000 cells were measured for one replicate. shCREB cells are within the red bordered area, while parental cells (NIH3T3 or HER-2/neu+ cells) can be found in the violet area. Representative histograms from one of three experiments are shown. (B) The mean 2,7-DCFH fluorescence intensity values of 2-ME treated cells was measured as in (A). The data points represents three independent experiments. (C) Viability of NIH3T3, HER-2/neu+ and their CREB down-regulated counterparts treated with high concentrations of H2O2 or formaldehyde for 2 h was measured with annexin V and PI staining. After staining 10,000 cells were analyzed by flow cytometry and cell viability was compared to that of untreated cells. Columns represens mean values of three independent experiments. (D) mRNA expression of catalase, esterase D and glutathione synthetase was determined in the cell lines. The red dashed line indicates the mRNA expression in the parental cell lines (NIH3T3 or HER-2/neu+), while the columns represent the mRNA expression in the CREB down-regulated cells. (E) Protein expression in NIH3T3 control cells (NC) and CREB down-regulated cells (shCREB) as well as in HER-2/neu+ cells was determined by Western blot using catalase specific antibodies. The Western blot is representative from one out of three experiments. (F) Cell lysates were separated on native gels and catalase activity was visualized by a catalase specific staining. The picture shows one experiment and was repeated thrice. (G) GSH concentrations in the cell lysates were determined using the glutathione assay kit as described in Materials and Methods. The concentration was normalized to the protein concentration. Data represents mean values of three independent experiments with two replicates.
Disturbation of glycolysis and mitochondrial functions by ROS
Next, we tested the effect of H2O2 as a ROS on the glycolysis and the mitochondrial activity. In the culture supernatant of H2O2-treated cells lower concentrations of lactate was detectable than in the DMSO control (Figure 9A). Furthermore, H2O2 reduced the uptake of glucose as determined using the glucose analogue 2-NBDG (Figure 9B). Both mechanisms were concentration dependent. This led to lower metabolic activity (Figure 9C) and reduced ATP production (Figure 9D), which was not only due to a decreased cell proliferation (Supplementary Figure 5). However, higher concentrations of H2O2 decreased mitochondrial membrane potential (Figure 9E), as well as induced the cleavage of caspase-3 (Figure 9F).
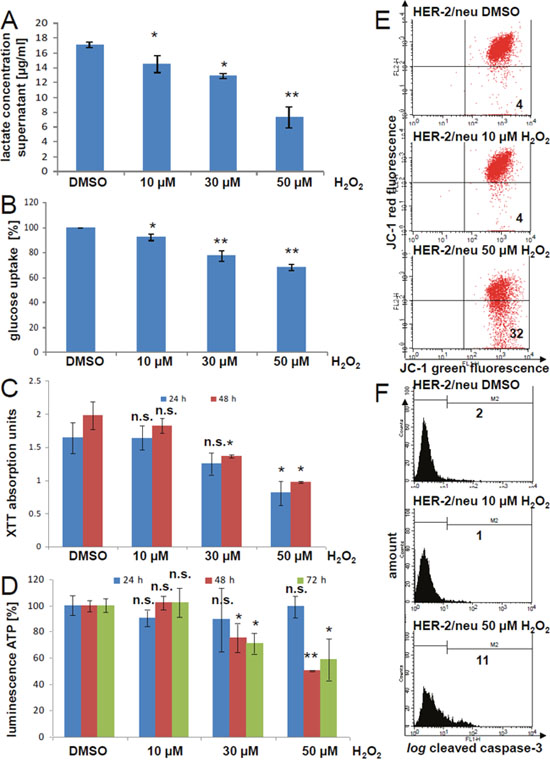
Figure 9: Inhibition of the metabolic and mitochondrial activities by hydrogen peroxide in HER-2/neu+ cells. (A) The lactate concentration in the cell culture supernatant of HER-2/neu+ cells incubated for 24 h with the indicated H2O2 concentration was measured with an enzyme assay kit. A lactate standard was used for the calibration. Data represents two independent experiments with three replicates per run. (B) Glucose uptake was determined fluorimetrically by cultivation of H2O2-treated cells for 15 min with 1 mg/ml 2-NDBG. Fluorescence units were normalized to the DMSO control. Columns represent three replicates with three wells each. (C) HER-2/neu+ cells were incubated with the indicated concentration of H2O2 for 24 or 48 h and the mitochondrial activity was measured with XTT. Data represents two experiments with three replicates. (D) HER-2/neu+ cells were incubated with the indicated concentration of H2O2 for 24, 48 or 72 h and ATP concentrations was analyzed by using the “CellTiter glo” system. Data represents two experiments with three replicates. (E) The effect of 10 and 50 M H2O2 for a 24 h cultivation period on the mitochondrial potential was determined by JC-1 staining and fluorescence analysis. The number in the lower right quadrant is the amount of cells with damaged mitochondrial membranes. 5,000 cells were measured for every dot plot. The histograms show one of three independent experiments. (F) Cleavage of the effector caspase-3 was monitored by flow cytometry by using a cleavage specific antibody. 5,000 cells / sample were determined. The histogram is representative and the experiment was repeated twice. M2 represents the cells with an activated caspase-3 and the percentage is given.
DISCUSSION
Major advances have been made in our understanding of the molecular mechanism of CREB function in malignant transformation and its association with hypoxia [17], but so far there exists only little information about the role of CREB in modulation of the cellular metabolism. Therefore, the aim of this study was to determine the effects of CREB and/or hypoxia-induced pathways on the cellular metabolism. Using 2-DE-based proteomic profiling of HER-2/neu+ versus HER-2/neu+ shCREB cells differentially expressed proteins were identified mainly involved in cell metabolism and localized in the cytoplasm. In particular, the expression of proteins associated with the glycolysis was altered. Validation of the CREB-regulated genes revealed in some cases a coordinated down-regulation of the respective mRNA and protein expression levels, while e.g. PGK 1 transcription remained unchanged upon CREB modulation, but altered at the protein level suggesting a posttranscriptional control. Thus, metabolic changes mediated by CREB seem to occur at both the transcriptional as well as at the posttranscriptional level. In this context it is also noteworthy that hypoxia could lead to posttranslational modifications of CREB [32]. The increased glycolysis of HER-2/neu+ cells was in accordance with the neoplastic properties of these cells. Different phosphorylation of CREB serine residues can affect metabolic enzymes, like PEPCK [42].
The altered metabolism due to HER-2/neu-controlled CREB overexpression modulates the TME. High lactate concentrations and low pH values were found in the supernatant of HER-2/neu+ cells, which might affect the anti-tumoral immune response. Indeed, acidic pH values could negatively interfere with the activity and function of effector T cells, dendritic cells as well as NK cells [43]. Furthermore, the direct influence of CREB on the cellular metabolism was strengthened by altered intra-cellular LDH levels. LDH representing the key enzyme of the glycolytic cascade and converting pyruvate to lactate is a CREB target [44]. Up-regulation of LDH levels led to an increased aerobic glycolysis, while CREB knock down not only reduced LDH levels in our HER-2/neu model system, but also in breast cancer [45]. The activation of the MEK/ERK pathway by HER-2/neu increased the CREB binding to the CREB-binding site (CRE) in the LDH promoter leading to its transcriptional up-regulation [46]. Furthermore, loss or reduced LDH expression abrogated cell proliferation in vitro and tumor formation in vivo in particular in triple negative mammary carcinoma [47], while high levels of LDH expression could be associated with poor patients’ outcome and inhibition of immune surveillance [48].
Comparative analysis of HER-2/neu+ and HER-2/neu+ shCREB cells demonstrated that CREB suppression correlated with an increased respiration and respiratory reserve. Thus, CREB-controlled altered metabolism was also associated with a reduced sensitivity to undergo apoptosis since HER-2/neu+ cells were able to grow under limited serum and glucose concentrations. This could be even further altered under hypoxic conditions leading to pronounced changes of the intracellular lactate dehydrogenase levels, extracellular lactate concentrations as well as extracellular pH values. In silico analysis of the transcriptional profile of chronic myeloid leukemia cells, in which CREB was knocked out demonstrated an upregulation of genes involved in tumor initiation and progression as well as in hypoxic signaling [49]. Since tumors with a higher glycolytic rate were associated with a worse prognosis accompanied by a poor clinical outcome of patients [48, 50], targeting of metabolic pathways might become an attractive therapeutic approach to treat cancer patients.
Increased ROS accumulation could be caused by mitochondrial dysfunction through the endoplasmic reticulum [51]. Furthermore, decreased mitochondrial activity implemented by mitochondrial dysfunction could activate CREB [52], which could in turn promote mitochondrial biogenesis [32]. Therefore, we tested whether oxidative stress like hydrogen peroxide could induce CREB activity in vitro. By upregulation of the AKT pathway the phosphorylation of CREB at Ser 133 was increased. Similar results were reported in a PKA-independent pathway by Pregni and co-authors [53] in neuronal cells, while treatment of melanoma cells with H2O2 increased CREB expression by the cAMP/PKA pathway [54]. Furthermore, H2O2 could stimulate phosphorylation of CREB by AKT thereby promoting mitochondrial respiration and biosynthesis [55], while the expression levels of esterase D (formyl glutathione hydrolase), an enzyme important for formaldehyde detoxification and upregulated by K-Ras mutations in murine fibroblasts [56], were not altered under these conditions.
CREB supports metabolism in several ways: First it can up-regulate the expression of Glut-1, therefore increasing uptake potential of glucose and intracellular glucose levels. Second, it can positive regulates some glycolytic enzymes (PKM2, TPI, alpha-enolase). Third it can enable mitochondrial respiration and biogenesis under stress conditions like hypoxia and ROS, therefore allowing a better survival of tumor and tumor cell (Figure 10).
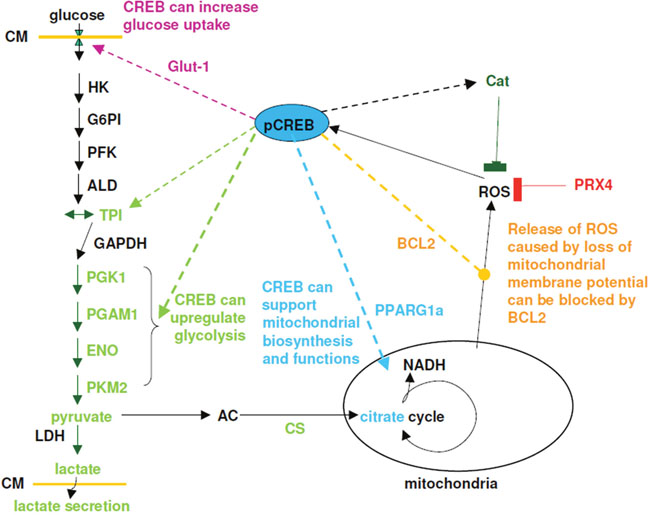
Figure 10: Model for effect of CREB on glycolysis, mitochondrial activity and detoxification mechanisms. Solid lines are reactions or reaction pathways, while dashed lines indicates mechanisms regulated by CREB. Abbreviation used: CM = cytoplasma membrane, Glut1 = glucose transporter, HK = hexokinase, G6PI = glucose-6-phosphosphate isomerase, PFK = phospho-fructokinase, ALD = aldolase, TPI = triosephosphate isomerase, GAPDH = glycerin-3-phosphate dehydrogenase, PGK1 = phospho glycerate kinase, PGAM1 = phosphoglycerate mutase, ENO = enolase, PKM2 = pyruvate dehydrogenase, LDH = lactate dehydrogenase, AC = acetyl-CoA, CS = citrate synthase, PPARG1a = peroxisome proliferator activated receptor gamma, cat = catalase, PRX4 = peroxiredoxin 4, bcl2 = B-cell lymphoma 2.
However, further research is required for better understand the role of TFs, like CREB, in the mitochondria and their effect on the regulation of the cellular metabolism and oxidative stress under physiologic, but also pathophysiologic conditions [57].
MATERIALS AND METHODS
Cell culture, hypoxia, drug treatment and glucose uptake
The generation and culture conditions of HER-2/neu- NIH3T3 cells, their HER-2/neu+ derivative and their respective CREB variants have been recently described [11, 34]. HER-2/neu-overexpressing cells with high levels of pCREB were termed HER-2/neu+ cells, HER-2/neu+ cells, in which CREB was down-regulated by shCREB were termed HER-2/neu+ shCREB cells.
For determination of the impact of FCS and glucose concentrations on the cell growth, cells were cultivated in 1 – 10 % FCS and 0.5 – 4.5 g/l glucose, respectively.
For hypoxia induction, cells were incubated in a 1 % (v/v) O2, 5% (v/v) CO2 atmosphere at 37°C for the indicated time spans [32]. Normoxic controls were cultured using standard conditions.
Cells were treated for 24 – 48 h with different inhibitors (HIF-1α inhibitor 2-methoxyestradiol, CREB-CBP inhibitor 666-15 (Tocris), CREB-CRE inhibitor surfen (Sigma), proton pump inhibitor Esomeprazole) and toxic components (H2O2, formaldehyde). Cytotoxicity of the substances was analyzed by treatment of cells with increasing concentrations of these inhibitors to determine the IC50 value by using the cytoto assay kit (Promega). Glucose uptake was determined as recently described in detail [58].
RNA isolation, cDNA synthesis, qPCR
Total cellular RNA from 5 x 10⁵ cells/sample was extracted and subjected to qPCR analysis as recently described [11]. The specific primer sequences and PCR conditions used were provided in Supplementary Table 1. Relative expression levels were calculated according to the ΔCt method and normalized against β-actin and/or GAPDH as internal controls. Three independent experiments were performed.
Protein isolation, western blot analysis and CREB ELISA
Total protein was isolated from 5 x 10⁶ cells/sample and the resulting lysates subjected to Western blot analysis as recently described [11] using the panel of antibodies listed in Supplementary Table 2. Blot membranes were stripped with 2.5 M glycine (pH 2) for 15 min. and were then re-probed with a new antibody after re-blocking with skim milk. For data analysis, three independent experiments were used.
The loss of CREB phosphorylation and protein was further quantified with a CREB specific ELISA system (Cayman). 10 μg total protein were incubated with the antibody coated plates for 1 h at 25ºC before CREB phosphorylation and CREB protein expression were determined by adding the primary antibody. After three washing steps the samples were incubated with the HRP-linked secondary antibody for 30 min., washed three times and reaction was started by adding TNB substrate. After 30 min. the reaction was stopped with 1 mM acetic acid and absorption was measured af 490 nm. Three biological samples with three reactions were measured with each cell line.
Flow cytometry
Cells were harvested after cultivation for 24 h under normoxia or hypoxia, respectively, and then stained for 20 min. with an anti-HER-2/neu-PE-conjugated (Becton Dickinson) antibody or with the IgG1-PE conjugated isotype control (BD), respectively, as recently described [59]. Fluorescence intensity was determined by flow cytometry on a FACSCalibur (BD). The results were expressed as mean specific fluorescence intensity (MFI) of three independent experiments.
For measuring the mitochondrial mass and the mitochondrial activity per single cell, the fluorescent dyes MitoTracker green (Cell signaling) staining the mitochondrial membrane, and MitoTracker red CFXRos (Invitrogen), which changed to a fluorescent dye under mitochondrial activity, were used. Cell pellets were resuspended in PBS supplemented with 100 nM of both dyes and then stained for 30 min. at 37°C in the dark. Cells were washed with PBS and directly analyzed by flow cytometry. Three biological replicates were used for every condition.
Determination of apoptosis and caspase-3 activation
Annexin V - propidium iodide staining was used for the detection of apoptotic and necrotic cells as previously described [11]. For fluorescence analysis, 10 μM acridine orange and 10 μM ethidium bromide were added to the given cell culture. After a 10 min incubation period the samples were analyzed by fluorescence microscopy using both green / red filter settings. Three biological replicates with three biological replicated each were photographed.
To determine the caspase-3 activation through cleavage, the FITC Active Caspase-3 Apoptosis Kit (BD) was used following the manufacturer’s instruction. Briefly, 2.5 x 10⁶ cells were fixed in 500 μl cytofix/cytoperm at 4°C for 30 min., and then washed once with 1 ml cytowash, before they were stained in 100 μl cytowash and 10 μl anti-active-caspase-3-FITC for 30 min. After one additional washing step, 1x10⁵ cells/sample were analyzed on a FacsCalibur (BD). The experiment was independently repeated twice.
Determination of H2O2 concentrations and enzyme activities
The concentration of H2O2 in the culture media was determined by the xylenol orange-Fe2+ method described by Gay and co-authors [60]. The enzymatic activity of PKM in cell lysates was measured by the method of Tietz and Ochoa [61]. 100 μl cell lysate were incubated with reaction puffer (50 mM Tris HCl pH 7.5, 4 mM MgCl2, 75 mM KCl, 0.2 mM ADP, 1.5 mM PEP, 0.2 mM NADH, 12 U/ml LDH) for 5 min. at room temperature. The reaction was started by addition of pyruvate kinase (end concentration 0.3 U/ml) and the absorbance change at 340 nm was recorded for 5 minutes.
Activity of prolyl endopeptidase was determined fluorometrically by the cleavage of the substrate Z-glycyl-prolyl-4-methylcoumarinyl-7-amide as described by Goossens and co-workers [62] with the following modifications: 100 μl of cell lysate were diluted with 100 μl incubation buffer (100 mM KH2PO4 pH 7.4, 100 μM NaN3, 1 mM DTT, 1 mM EDTA). Next the samples were incubated for 15 min. at 37°C and 10 μl of substrate was added (5 mM in DMSO). After incubation for 2 h in the dark at 37°C 500 μl 1.5 mM acetic acid were added and mixed. Fluorescence was analyzed with an ELISA reader (Tecan) with λex 370 nm and λem 440 nm.
PGAM1 activity was measured following the protocol published by Hallows and co-authors [63].
TPI enzyme activity in cell lysate was analyzed by adding 2 ml reaction buffer (220 mM triethanolamine HCl, pH 7.6, 3 μM DL-glyceraldehyde-3-phosphate, 0.26 μM NADH, 50 mU glycerol-3-phosphate dehydrogenase, 0.2 U/ml triose phosphate isomerase) to 100 μl of cell lysate. The decrease in absorbance at 240 nm was recorded by a spectrometer.
PGK activity was determined by ATP formation: 100 μl cell lysate were mixed with 50 mM potassium phosphate, 5 mM 1,3-bisphosphoglycerate, 1 mM ADP, 5 mM CaCl2. The formation of Ca3(PO4)2 was measured by 340 nm after incubation by 25°C for 15 min.
For determination of the PRX 4 activity the protocol from Nelson and Parsonage [64] was used.
The enzymatic activity was normalizied to the total protein concentration in the cell lysate. All experiments were performed with three cell preparations.
Extracellular flux assays
Bioenergetics of CREB down-regulated and CREB expressing HER-2/neu+ and HER-2/neu- control cells were determined using the XF96e Extracellular Flux analyzer (Seahorse Bioscience) as recently described [65]. Briefly, 2x10⁵ cells/well were reseeded in specialized tissue culture plates (96FX micro well plate) and subsequently immobilized using CELL-TAK (BD Biosciences). One hour prior measurement, cells were incubated at 37°C in a CO2-free atmosphere. First, the basal extracellular acidification rate (ECAR), as an indicator for lactic acid production or glycolysis, was recorded. In the next step ECAR in response to the application of 1 μM oligomycin (XF Cell Mito Glyco Test Kit, Seahorse Bioscience) as well as 10 mM glucose was evaluated. All experiments were performed in four independent experiments with at least hexaplicates.
Determination of lactate, pyruvate, citrate levels, acetyl-CoA and glucose concentrations in cell culture supernatants and cell lysats
The amount of lactate in 100 μl cell culture supernatants was analyzed with a lactate detection kit (Sigma) according to the manufacturer’s instructions in a 96 well plate format. The deproteinated samples were measured at 570 nm in an ELISA reader (Tecan) after enzymatic reaction. Three independent experiments were performed using three technical replicates in each run and the results were expressed as mean ± SD using bar charts.
For the detection of pyruvate and citrate in cell lysates commercial kits (Biovision) were used following the manufacturer’s protocol. Samples and standards were measured with an ELISA reader as described above.
Acetyl-CoA was measured fluorimetrically with an acetyl-CoA assay kit following the manufacturer’s instructions (Sigma).
The amount of glucose in the culture medium was controlled with the DNSA method as described by Miller [66].
Proliferation and cell cycle analysis
Proliferation of treated cells was determined by measuring the DNA synthesis with the cell proliferation ELISA, BrdU (colorimetric) kit (Roche). 5 x 10⁴ cells were seeded per 96/well and were treated with or without H2O2. The inclusion of BrdU was analyzed following the manufacturer’s instructions. Three biological replicates with three biological sample each were analyzed at an ELISA reader (Tecan).
For cell cycle analysis the DNA content per cell was measured as described previously [11]. Briefly, after synchronization of the cells by serum deprivation (0.5% FCS) for 48 h, cells were incubated with media containing inhibitors and 10% FCS for the indicated time span. The cells were fixed after harvesting in 70% ethanol for at least 24 h by 4°C, following the isolation of nucleus by washing once with PBS, 0.5% tween 20 and then PBS, 0,5% tween 20 and 100 mM citrate. RNA was digested with RNase A treatment and DNA was stained with 0.1 mg/ml PI. DNA content was measured with a FacsAria III (BD) with three biological replicates for each condition.
CREB – DNA binding analysis
Binding of CREB to the CRE DNA element was analyzed by an EMSA. Nuclear extracts of HER-2/neu+ cells were incubated with a biotinylated oligonucleotide (TGACGTCA) and the testing substances as described by Bukur and co-authors [59].
Furthermore, the ethidium bromide displacement assay was used to determine whether surfen interacts with the CRE element and therefore prevents binding of CREB or whether surfen binds to the CREB protein. The assay was conducted as published in Rishi and co-workers [67] for three times independently. The following hairpin oligonucleotids were used: TGACGTCAAAAAATGACGTCA (CREB), TGACTCAAAAAATGACTCA (AP1), TTAATTAAAAAA ATTAATTAA (AT rich), GGCCGGCCAAAAAGGCC GGCC (GC rich).
Detection of reactive oxygen species (ROS)
Cells were incubated in 10 μM 2',7'-dichlorodihydrofluorescein diacetate (2,7-DCFH) for 15 min. at room temperature and then were washed twice with PBS. Fluorescence intensity was analysed by flow cytometry (BD) as recently described [68].
Determination of glutathione levels
The glutathione levels were determined using the GSH/oxidized GSH ratio kit (Calbiochem) as previously described [56]. Briefly, 1 x 10⁶ cells were incubated for 48 h, washed twice with PBS, scratched of the plates and resuspended in 100 μl PBS. After cell lysis obtained by 6 cycles of freezing and thawing 900 μl 5 % (w/v) meta phosphoric acid/sample was added. 50 μl of the cell supernatant was analyzed according to the manufacturer’s instructions at 412 nm in a spectrometer (Merck). The amount of glutathione was correlated to the protein concentration determined with the bicinchoninic acid kit (Thermo).
Catalase activity staining
Catalase staining was performed according to Weydert and Cullen [69]. 150 μg non-denaturated total protein lysate was separated with a native 8 % PAGE gel in a cold room (6°C) at ~40 mA for 6 to 8 h. After electrophoresis the gel was washed with aqua dest. and incubated for 10 min by RT in 0.03 % H2O2. After washing twice with aqua dest. the gel was stained in 2 % (w/v) FeCl3 and 2 % (w/v) K3[Fe(CN)6]) until clear bands appeared. Finally, the gels were extensively washed with water and documented with a gel scanner. Four single protein lysates were used for every condition.
Intracellular pH measurement
1 x 10⁶ cells were stained with 0.1 μM BCECF-AM for 30 min. at 4°C and washed twice with culture medium. 1 x 10⁴ cells/well were seeded into a black 96 well plate with a clear bottom and incubated at 37 °C for 24 h under normoxic or hypoxic conditions. The fluorescence intensity/well was determined in a fluorescence reader (Tecan, excitation wavelength 480 nm, emission wavelength 535 nm). For the analysis of pH stability and the regeneration time under normoxia, the fluorescence intensity was monitored for one h. For the standard curve the cells were incubated in buffer with known pH whereas nigericin-KCl (25 μM and 125 mM) was used for permeabilization.
2D gel electrophoresis, spot digestion and mass spectrometry
For determination of the differential protein expression pattern upon CREB down-regulation, 2-DE-based proteome analysis followed by mass spectrometry was performed as recently described [58]. Three biological replicates with four to six technical replicates (gels) were used for proteome analysis. Coomassie stained gels were documented with a gel scanner and gel pictures were compared with the Delta2D software (Decodon). The cut-off for up and down-regulation of protein spot was < 0.5 and > 2.5. Putative CREB-regulated proteins were cut-out with an automatic spot picker (Spothunter, Herolab) and prepared for MALDI TOF/TOF-MS with a α-cyano-hydroxycinnamic acid matrix. MS data were identified with the Mascot database. Protein spots with a score value higher than 55 and found in all three biological replicates were used for further validation processes.
Statistical analysis
Differences between groups were analyzed by Mann-Whitney test, Student’s t test or ANOVA as appropriate. Data are expressed as mean ± SD and the corresponding p values reported are 2-sided. Significance was accepted if p values were ≤ 0.05 (*). The statistical analysis of the graphs and tables compares the CREB diminished cells with their parental cell lines (NIH3T3 or HER-2/neu+) if nothing else is stated in the figure legend. For the analysis of putative CRE regions in the listed gene promoter sequence the CREB target gene database (natural.salk.edu/CREB/) was used [70].
Abbreviations
2-ME, 2-methoxyestradiol; 2-NBDG, 2-[N-(7-nitrobenz-2-oxa-1,3-diazol-4-yl)amino]-2-deoxy-D-glucose; 2-DE, two-dimensional gel electrophoresis; 2,7-DCFH, 2',7'-dichlorodihydrofluorescein diacetate; ATCC, American Tissue Culture Collection; CaMK, calcium activated calmodulin kinase; CBP, CREB binding protein; CRE, cAMP-responsive element; CREB, cAMP-responsive element binding protein; ECAR, extracellular acidification rate; EMSA, electromobility shift assays; ENO, enolase; ERK, extracellular-signal regulated kinase; ESOM, Esomeprazole; FGF, fibroblast growth factor; GLUT, glucose transporter; GSH, glutathione; KID, kinase-inducible domain; KIX, KID-interacting domain; LDH, lactate dehydrogenase; mAb, monoclonal antibody; MALDI-TOF, matrix-assisted laser desorption/ionization time-of-flight; MAPK, mitogen-activated protein kinase; MCT, monocarboxylate transporter; MEK, MAP/ERK kinase; MFI, mean fluorescence intensity; NF, nuclear factor; OCR, oxygen consumption rate; p, p-value; PBS, phosphate-buffered saline; pCREB, phosphorylated CREB; PEP, prolyl endopeptidase; PGK, phosphoglycerate kinase; PGAM, phosphoglycerate mutase; PKA, protein kinase A; PKM, pyruvate kinase; PRX, peroxiredoxin; PTM, post-transcriptional modification; qPCR, quantitative PCR; ROS, reactive oxygen species; RTK, receptor tyrosine kinase; TF, transcription factor; TME, tumor microenvironment; TPI, triose phosphate isomerase; UTR, untranslated region.
ACKNOWLEDGMENTS AND FUNDING
We would like to thank Sylvi Magdeburg for excellent secretarial work.
This work was supported by the Mildred Scheel Foundation (BS).
CONFLICTS OF INTEREST
The authors declare that they have no conflicts of interest.
REFERENCES
1. Johannessen M, Moens U. Multisite phosphorylation of the cAMP response element-binding protein (CREB) by a diversity of protein kinases. Front Biosci. 2007; 12:1814-32.
2. Finkbeiner S. New roles for introns: sites of combinatorial regulation of Ca2+- and cyclic AMP-dependent gene transcription. Sci STKE. 2001; 2001(94):pe1.
3. Mayr B, Montminy M. Transcriptional regulation by the phosphorylation-dependent factor CREB. Nat Rev Mol Cell Biol. 2001; 2:599-609.
4. Melnikova VO, Dobroff AS, Zigler M, Villares GJ, Braeuer RR, Wang H, Huang L, Bar-Eli M. CREB inhibits AP-2alpha expression to regulate the malignant phenotype of melanoma. PLoS One. 2010; 5:e12452.
5. Radhakrishnan I, Pérez-Alvarado GC, Parker D, Dyson HJ, Montminy MR, Wright PE. Solution structure of the KIX domain of CBP bound to the transactivation domain of CREB: a model for activator:coactivator interactions. Cell. 1997; 91:741-52.
6. Rudolph D, Tafuri A, Gass P, Hämmerling GJ, Arnold B, Schütz G. Impaired fetal T cell development and perinatal lethality in mice lacking the cAMP response element binding protein. Proc Natl Acad Sci U S A. 1998; 95:4481-6.
7. Cho EC, Mitton B, Sakamoto KM. CREB and leukemogenesis. Crit Rev Oncog. 2011; 16:37-46.
8. De Giovanni C, Nicoletti G, Quaglino E, Landuzzi L, Palladini A, Ianzano ML, Dall'Ora M, Grosso V, Ranieri D, Laranga R, Croci S, Amici A, Penichet ML, et al. Vaccines against human HER2 prevent mammary carcinoma in mice transgenic for human HER2. Breast Cancer Res. 2014; 16:R10.
9. Stahler A, Heinemann V, Neumann J, Crispin A, Schalhorn A, Stintzing S, Giessen-Jung C, Fischer von Weikersthal L, Vehling-Kaiser U, Stauch M, Quietzsch D, Holch JW, Kruger S, et al. Prevalence and influence on outcome of HER2/neu, HER3 and NRG1 expression in patients with metastatic colorectal cancer. Anticancer Drugs. 2017; 28:717-22.
10. Gutierrez C, Schiff R. HER2: biology, detection, and clinical implications. Arch Pathol Lab Med. 2010; 135:55-62.
11. Steven A, Leisz S, Massa C, Iezzi M, Lattanzio R, Lamolinara A, Bukur J, Müller A, Hiebl B, Holzhausen HJ, Seliger B. HER-2/neu mediates oncogenic transformation via altered CREB expression and function. Mol Cancer Res. 2013; 11:1462-77.
12. Abramovitch R, Tavor E, Jacob-Hirsch J, Zeira E, Amariglio N, Pappo O, Rechavi G, Galun E, Honigman A. A pivotal role of cyclic AMP-responsive element binding protein in tumor progression. Cancer Res. 2004; 64:1338-46.
13. Braeuer RR, Zigler M, Villares GJ, Dobroff AS, Bar-Eli M. Transcriptional control of melanoma metastasis: the importance of the tumor microenvironment. Semin Cancer Biol. 2011; 21:83-8.
14. Chhabra A, Fernando H, Watkins G, Mansel RE, Jiang WG. Expression of transcription factor CREB1 in human breast cancer and its correlation with prognosis. Oncol Rep. 2007; 18:953-8.
15. Fan CF, Mao XY, Wang EH. Elevated p-CREB-2 (ser 245) expression is potentially associated with carcinogenesis and development of breast carcinoma. Mol Med Rep. 2012; 5:357-62.
16. Pigazzi M, Manara E, Bresolin S, Tregnago C, Beghin A, Baron E, Giarin E, Cho EC, Masetti R, Rao DS, Sakamoto KM, Basso G. MicroRNA-34b promoter hypermethylation induces CREB overexpression and contributes to myeloid transformation. Haematologica. 2013; 98:602-10.
17. Steven A, Seliger B. Control of CREB expression in tumors: from molecular mechanisms and signal transduction pathways to therapeutic target. Oncotarget. 2016; 7:35454-65. https://doi.org/10.18632/oncotarget.7721.
18. Wang X, Cui H, Lou Z, Huang S, Ren Y, Wang P, Weng G. Cyclic AMP responsive element-binding protein induces metastatic renal cell carcinoma by mediating the expression of matrix metallopeptidase-2/9 and proteins associated with epithelial-mesenchymal transition. Mol Med Rep. 2017;15:4191-8.
19. Deng X, Liu H, Huang J, Cheng L, Keller ET, Parsons SJ, Hu CD. Ionizing radiation induces prostate cancer neuroendocrine differentiation through interplay of CREB and ATF2: implications for disease progression. Cancer Res. 2008; 68:9663-70.
20. Johannessen CM, Johnson LA, Piccioni F, Townes A, Frederick DT, Donahue MK, Narayan R, Flaherty KT, Wargo JA, Root DE, Garraway LA. A melanocyte lineage program confers resistance to MAP kinase pathway inhibition. Nature. 2013; 504:138-42.
21. Sakamoto KM, Frank DA. CREB in the pathophysiology of cancer: implications for targeting transcription factors for cancer therapy. Clin Cancer Res. 2009; 15:2583-7.
22. Seo HS, Liu DD, Bekele BN, Kim MK, Pisters K, Lippman SM, Wistuba II, Koo JS. Cyclic AMP response element-binding protein overexpression: a feature associated with negative prognosis in never smokers with non-small cell lung cancer. Cancer Res. 2008; 68:6065-73.
23. Hartzell DD, Trinklein ND, Mendez J, Murphy N, Aldred SF, Wood K, Urh M. A functional analysis of the CREB signaling pathway using HaloCHIP-chip and high throughput reporter assays. BMC Genomics. 2009; 10:497.
24. Johannessen M, Delghandi MP, Moens U. What turns CREB on? Cell Signal. 2004; 16:1211-27.
25. Shi Y, Venkataraman SL, Dodson GE, Mabb AM, LeBlanc S, Tibbetts RS. Direct regulation of CREB transcriptional activity by ATM in response to genotoxic stress. Proc Natl Acad Sci U S A. 2004; 101:5898-903.
26. Tan X, Wang S, Yang B, Zhu L, Yin B, Chao T, Zhao J, Yuan J, Qiang B, Peng X. The CREB-miR-9 negative feedback minicircuitry coordinates the migration and proliferation of glioma cells. PLoS One. 2012; 7:e49570.
27. Tan X, Wang S, Zhu L, Wu C, Yin B, Zhao J, Yuan J, Qiang B, Peng X. cAMP response element-binding protein promotes gliomagenesis by modulating the expression of oncogenic microRNA-23a. Proc Natl Acad Sci U S A. 2012; 109:15805-10.
28. Liu YL, Lensing SY, Yan Y, Cooper TM, Loh ML, Emanuel PD. Deficiency of CREB and over expression of miR-183 in juvenile myelomonocytic leukemia. Leukemia. 2010; 27:1585-8.
29. Yang SF, Lee WJ, Tan P, Tang CH, Hsiao M, Hsieh FK, Chien MH. Upregulation of miR-328 and inhibition of CREB-DNA-binding activity are critical for resveratrol-mediated suppression of matrix metalloproteinase-2 and subsequent metastatic ability in human osteosarcomas. Oncotarget. 2015; 6:2736-53. https://doi.org/10.18632/oncotarget.3088.
30. Zhang JQ, Yao QH, Kuang YQ, Ma Y, Yang LB, Huang HD, Cheng JM, Yang T, Liu EY, Liang L, Fan KX, Zhao K, Xia X, Gu JW. Prognostic value of coexistence of abnormal expression of micro-RNA-200b and cyclic adenosine monophosphate-responsive element-binding protein 1 in human astrocytoma. Hum Pathol. 2014; 45:2154-61.
31. Zhang Y, Yang J, Cui X, Chen Y, Zhu VF, Hagan JP, Wang H, Yu X, Hodges SE, Fang J, Chiao PJ, Logsdon CD, Fisher WE, et al. A novel epigenetic CREB-miR-373 axis mediates ZIP4-induced pancreatic cancer growth. EMBO Mol Med. 2013; 5:1322-34.
32. Steven A, Leisz S, Sychra K, Hiebl B, Wickenhauser C, Mougiakakos D, Kiessling R, Denkert C, Seliger B. Hypoxia-mediated alterations and their role in the HER-2/neu-regulated CREB status and localization. Oncotarget. 2016; 7:52061-84. https://doi.org/10.18632/oncotarget.10474.
33. Knutson TP, Daniel AR, Fan D, Silverstein KA, Covington KR, Fuqua SA, Lange CA. Phosphorylated and sumoylation-deficient progesterone receptors drive proliferative gene signatures during breast cancer progression. Breast Cancer Res. 2012; 14:R95.
34. Herrmann F, Lehr HA, Drexler I, Sutter G, Hengstler J, Wollscheid U, Seliger B. HER-2/neu-mediated regulation of components of the MHC class I antigen-processing pathway. Cancer Res. 2004; 64:215-20.
35. Morin A, Letouzé E, Gimenez-Roqueplo AP, Favier J. Oncometabolites-driven tumorigenesis: from genetics to targeted therapy. Int J Cancer. 2014; 135:2237-48.
36. Semenza GL. HIF-1 mediates metabolic responses to intratumoral hypoxia and oncogenic mutations. J Clin Invest. 2013; 123:3664-71.
37. Yang C, Jiang L, Zhang H, Shimoda LA, DeBerardinis RJ, Semenza GL. Analysis of hypoxia-induced metabolic reprogramming. Methods Enzymol. 2014; 542:425-55.
38. Xie F, Li BX, Kassenbrock A, Xue C, Wang X, Qian DZ, Sears RC, Xiao X. Identification of a potent inhibitor of CREB-mediated gene transcription with efficacious in vivo anticancer activity. J Med Chem. 2015; 58:5075-87.
39. Xiao X, Li BX, Mitton B, Ikeda A, Sakamoto KM. Targeting CREB for cancer therapy: friend or foe. Curr Cancer Drug Targets. 2010; 10:384-91.
40. Garcia-Prat L, Martínez-Vicente M, Perdiguero E, Ortet L, Rodríguez-Ubreva J, Rebollo E, Ruiz-Bonilla V, Gutarra S, Ballestar E, Serrano AL, Sandri M, Muñoz-Cánoves P. Autophagy maintains stemness by preventing senescence. Nature. 2016; 529:37-42.
41. Lopez de Figueroa P, Lotz MK, Blanco FJ, Caramés B. Autophagy activation and protection from mitochondrial dysfunction in human chondrocytes. Arthritis Rheumatol. 2015; 67:966-76.
42. Kim SH, Trinh AT, Larsen MC, Mastrocola AS, Jefcoate CR, Bushel PR, Tibbetts RS. Tunable regulation of CREB DNA binding activity couples genotoxic stress response and metabolism. Nucleic Acids Res. 2016; 44:9667-80.
43. Singer K, Kastenberger M, Gottfried E, Hammerschmied CG, Büttner M, Aigner M, Seliger B, Walter B, Schlösser H, Hartmann A, Andreesen R, Mackensen A, Kreutz M. Warburg phenotype in renal cell carcinoma: high expression of glucose-transporter 1 (GLUT-1) correlates with low CD8(+) T-cell infiltration in the tumor. Int J Cancer. 2011; 128:2085-95.
44. Conkright MD, Guzmán E, Flechner L, Su AI, Hogenesch JB, Montminy M. Genome-wide analysis of CREB target genes reveals a core promoter requirement for cAMP responsiveness. Mol Cell. 2003; 11:1101-8.
45. Chang CC, Zhang C, Zhang Q, Sahin O, Wang H, Xu J, Xiao Y, Zhang J, Rehman SK, Li P, Hung MC, Behbod F, Yu D. Upregulation of lactate dehydrogenase a by 14-3-3zeta leads to increased glycolysis critical for breast cancer initiation and progression. Oncotarget. 2016; 7:35270-83. https://doi.org/10.18632/oncotarget.9136.
46. Tang H, Goldberg E. Homo sapiens lactate dehydrogenase c (Ldhc) gene expression in cancer cells is regulated by transcription factor Sp1, CREB, and CpG island methylation. J Androl. 2009; 30:157-67.
47. McCleland ML, Adler AS, Shang Y, Hunsaker T, Truong T, Peterson D, Torres E, Li L, Haley B, Stephan JP, Belvin M, Hatzivassiliou G, Blackwood EM, et al. An integrated genomic screen identifies LDHB as an essential gene for triple-negative breast cancer. Cancer Res. 2012; 72:5812-23.
48. Brand A, Singer K, Koehl GE, Kolitzus M, Schoenhammer G, Thiel A, Matos C, Bruss C, Klobuch S, Peter K, Kastenberger M, Bogdan C, Schleicher U, et al. LDHA-associated lactic acid production blunts tumor immunosurveillance by T and NK cells. Cell Metab. 2016; 24:657-71.
49. Xia H, Gong Z, Lian Y, Zhou J, Wang X. Gene expression profile regulated by CREB in K562 cell line. Transplant Proc. 2016; 48:2221-34.
50. Walenta S, Wetterling M, Lehrke M, Schwickert G, Sundfør K, Rofstad EK, Mueller-Klieser W. High lactate levels predict likelihood of metastases, tumor recurrence, and restricted patient survival in human cervical cancers. Cancer Res. 2000; 60:916-21.
51. Murphy MP. Mitochondrial dysfunction indirectly elevates ROS production by the endoplasmic reticulum. Cell Metab. 2013; 18:145-6.
52. Arnould T, Vankoningsloo S, Renard P, Houbion A, Ninane N, Demazy C, Remacle J, Raes M. CREB activation induced by mitochondrial dysfunction is a new signaling pathway that impairs cell proliferation. EMBO J. 2002; 21:53-63.
53. Pregi N, Belluscio LM, Berardino BG, Castillo DS, Cánepa ET. Oxidative stress-induced CREB upregulation promotes DNA damage repair prior to neuronal cell death protection. Mol Cell Biochem. 2017; 425:9-24.
54. Kim HE, Lee SG. Induction of ATP synthase β by H2O2 induces melanogenesis by activating PAH and cAMP/CREB/MITF signaling in melanoma cells. Int J Biochem Cell Biol. 2013; 45:1217-22.
55. Barbosa MR, Sampaio IH, Teodoro BG, Sousa TA, Zoppi CC, Queiroz AL, Passos MA, Alberici LC, Teixeira FR, Manfiolli AO, Batista TM, Cappelli AP, Reis RI, et al. Hydrogen peroxide production regulates the mitochondrial function in insulin resistant muscle cells: effect of catalase overexpression. Biochim Biophys Acta. 2013; 1832:1591-604.
56. Recktenwald CV, Kellner R, Lichtenfels R, Seliger B. Altered detoxification status and increased resistance to oxidative stress by K-ras transformation. Cancer Res. 2008; 68:10086-93.
57. Sepuri NB, Tammineni P, Mohammed F, Paripati A. Nuclear transcription factors in the mitochondria: a new paradigm in fine-tuning mitochondrial metabolism. Handb Exp Pharmacol. 2017; 240:3-20.
58. Leisz S, Schulz K, Erb S, Oefner P, Dettmer K, Mougiakakos D, Wang E, Marincola FM, Stehle F, Seliger B. Distinct von Hippel-Lindau gene and hypoxia-regulated alterations in gene and protein expression patterns of renal cell carcinoma and their effects on metabolism. Oncotarget. 2015; 6:11395-406. https://doi.org/10.18632/oncotarget.3456.
59. Bukur J, Herrmann F, Handke D, Recktenwald C, Seliger B. Identification of E2F1 as an important transcription factor for the regulation of tapasin expression. J Biol Chem. 2010; 285:30419-26.
60. Gay C, Collins J, Gebicki JM. Hydroperoxide assay with the ferric-xylenol orange complex. Anal Biochem. 1999; 273:149-55.
61. Tietz A, Ochoa S. Fluorokinase and pyruvic kinase. Arch Biochem Biophys. 1958; 78:477-93.
62. Goossens F, De Meester I, Vanhoof G, Scharpé S. A sensitive method for the assay of serum prolyl endopeptidase. Eur J Clin Chem Clin Biochem. 1992; 30:235-8.
63. Hallows WC, Yu W, Denu JM. Regulation of glycolytic enzyme phosphoglycerate mutase-1 by Sirt1 protein-mediated deacetylation. J Biol Chem. 2012; 287:3850-8.
64. Nelson KJ, Parsonage D. Measurement of peroxiredoxin activity. Curr Protoc Toxicol. 2011; Chapter 7:Unit7.10.
65. Jitschin R, Hofmann AD, Bruns H, Giessl A, Bricks J, Berger J, Saul D, Eckart MJ, Mackensen A, Mougiakakos D. Mitochondrial metabolism contributes to oxidative stress and reveals therapeutic targets in chronic lymphocytic leukemia. Blood. 2014; 123:2663-72.
66. Miller GL. Use of dinitrosalicylic acid reagent for determination of reducing augar. Anal Chem. 1959; 31:426-28.
67. Rishi V, Potter T, Laudeman J, Reinhart R, Silvers T, Selby M, Stevenson T, Krosky P, Stephen AG, Acharya A, Moll J, Oh WJ, Scudiero D, et al. A high-throughput fluorescence-anisotropy screen that identifies small molecule inhibitors of the DNA binding of B-ZIP transcription factors. Anal Biochem. 2005; 340:259-71.
68. Chen X, Zhong Z, Xu Z, Chen L, Wang Y. 2',7'-Dichlorodihydrofluorescein as a fluorescent probe for reactive oxygen species measurement: forty years of application and controversy. Free Radic Res. 2010; 44:587-604.
69. Weydert C, Cullen J. Measurement of superoxide dismutase, catalase and glutathione peroxidase in cultured cells and tissue. Nat Protoc. 2010; 5:51-66.
70. Zhang X, Odom DT, Koo SH, Conkright MD, Canettieri G, Best J, Chen H, Jenner R, Herbolsheimer E, Jacobsen E, Kadam S, Ecker JR, Emerson B, et al. Genome-wide analysis of cAMP-response element binding protein occupancy, phosphorylation, and target gene activation in human tissues. Proc Natl Acad Sci U S A. 2004; 102:4459-64.