
INTRODUCTION
Multiple myeloma (MM) is a B cell neoplasia characterized by accumulation of clonal malignant plasma cells (MMC) in bone marrow. In the United States and in Europe, MM affects 20 000 new patients per year [1, 2]. MM is the second most prevalent hematological malignancy and remains an incurable disease in most cases with a median survival of 5-7 years [1]. The treatment of relapsed/refractory patients is challenging. Monoclonal antibodies associated with other agents, such as immunomodulatory drugs or proteasome inhibitors, are showing promising results [3, 4]. However, the long-term clinical outcome of patients with MM is still heterogeneous.
The cluster of differentiation (CD) includes cell surface molecules that are used for cell immunophenotyping. CD19, CD20, CD27, CD28, CD56 and CD117 are usually employed to discriminate normal bone marrow plasma cells (BMPC) from MMC [5]. The expression of these CD markers is not homogeneous in all MMC. Indeed, they are not aberrantly expressed in all patients with MM and their expression level is heterogeneous among patients and MM subclones [6-9]. Higher expression of CD117 and CD56 was identified in patients with hyperdiploidy whereas high CD56 expression and low CD117 expression was associated with t(4;14) MM patients. At the opposite, MAF molecular subgroup was characterized by high CD117 expression and low CD56 expression. CD20 expression is negatively correlated with amplification of chromosome 1q21 [10]. In this study, we analyzed and compared the expression of genes coding for CD antigens in BMPC and primary MMC from newly diagnosed patients using microarrays. We identified new CD genes that are differentially expressed between normal and malignant plasma cells. Furthermore, we found that the expression level of CD24, CD27, CD36 and CD302 has a prognostic value in independent cohorts of newly diagnosed patients with MM. Based on the expression level of CD24, CD27, CD36 and CD302, we then developed a new CD gene risk score that allows the identification of high-risk patients with MM at diagnosis and at relapse.
RESULTS
CD genes differentially expressed in normal BMPC and MMC
A list of 266 probesets representative of genes encoding CD molecules was defined using the Human Cell Differentiation Molecules database (http://www.hcdm.org) (Supplementary Table 1). Comparison of CD gene expression in BMPC from healthy controls and MMC samples from patients with MM (HM cohort) using Significance Analysis of Microarrays (SAM) showed that nine CD genes were significantly overexpressed in MMC compared with BMPC and 16 were significantly downregulated [ratio ≥2; False Discovery Rate (FDR) <0.05; 1000 permutations] (Tables 1 and 2) (Figure 1). Among the CD genes significantly overexpressed in MMC samples, the biological function of CD200, CD1d, CD47, CD59 and CD32 (Fc γRII) in MM has been already investigated [11-20]. On the other hand, CD109, CD2BP2, CD300a and CD320 could represent new potential MMC CD markers (Table 1). Affymetrix gene expression of CD109 and CD300a was validated at protein level using panel of 11 HMCL (Supplementary Figure 1). CD300a overexpression in malignant compared to normal PCs was also confirmed by flow cytometry in a newly diagnosed patient (Supplementary Figure 1). The expression of CD320 and CD2BP2 was also significantly higher in human MM cell lines (HMCL; n=25) [ratio≥ 2, FDR< 0.05; 1000 permutations] compared with MMC, suggesting that they could be involved in MM progression (Figure 1) (Supplementary Table 2A).
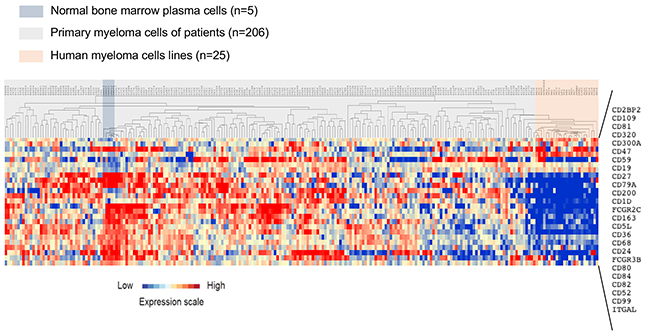
Figure 1: Clustering of CD gene expression in normal BMPC, MMC and HMCL. The expression of 25 genes from 266 probesets was significantly deregulated in MMC of patients with MM (HM cohort) at diagnosis compared with normal BMPC and HMLC. The expression level of each gene is color-coded (red, higher and blue, lower expression than the mean; the color intensity represents the magnitude of deviation from the mean). MMC, normal BMPC and HMCL samples are highlighted in gray, blue and red, respectively.
Table 1: Cluster differentiation genes significantly overexpressed in MMC compared with normal BMPC
Probeset |
Gene |
Ratio |
FDR |
Affymetrix description |
|---|---|---|---|---|
229900_at |
CD109 |
2.33 |
1.34 |
CD109 molecule |
205789_at |
CD1d |
2.12 |
1.83 |
CD1d molecule |
209583_s_at |
CD200 |
5.79 |
0.28 |
CD200 molecule |
202256_at |
CD2BP2 |
2.26 |
0.00 |
CD2 (cytoplasmic tail) binding protein 2 |
217078_s_at |
CD300a |
5.80 |
1.08 |
CD300a molecule |
218529_at |
CD320 |
2.00 |
0.28 |
CD320 molecule |
213857_s_at |
CD47 |
3.70 |
0.00 |
CD47 molecule |
200985_s_at |
CD59 |
2.85 |
0.00 |
CD59 molecule, complement regulatory protein |
211395_x_at |
FCGR2c |
2.62 |
0.28 |
Fc fragment of IgG, low affinity IIc, receptor for (CD32) (gene/pseudogene) |
Gene expression was profiled in MMC samples from the HM cohort (n=206 patients with MM) and BMPC samples (healthy controls; n=7) using Affymetrix U133 plus 2.0 microarrays. Genes that are differentially expressed between malignant and normal cells were identified using SAM supervised unpaired analysis with a 5% false discovery rate.
Table 2: Cluster differentiation genes that are downregulated in MMC compared with normal BMPC
Probeset |
Gene |
Ratio |
FDR |
Affymetrix description |
|---|---|---|---|---|
215049_x_at |
CD163 |
0.16 |
0.00 |
CD163 molecule |
206398_s_at |
CD19 |
0.32 |
0.00 |
CD19 molecule |
216379_x_at |
CD24 |
0.40 |
0.00 |
CD24 molecule |
228766_at |
CD36 |
0.22 |
0.00 |
CD36 molecule (thrombospondin receptor) |
34210_at |
CD52 |
0.28 |
0.00 |
CD52 molecule |
206680_at |
CD5L |
0.25 |
0.00 |
CD5 molecule-like |
203507_at |
CD68 |
0.27 |
0.00 |
CD68 molecule /// small nucleolar RNA, H/ACA box 67 |
205049_s_at |
CD79a |
0.37 |
0.00 |
CD79a molecule, immunoglobulin-associated alpha |
207176_s_at |
CD80 |
0.47 |
0.00 |
CD80 molecule |
200675_at |
CD81 |
0.29 |
0.00 |
CD81 molecule |
203904_x_at |
CD82 |
0.23 |
0.00 |
CD82 molecule |
205988_at |
CD84 |
0.43 |
0.00 |
CD84 molecule |
201029_s_at |
CD99 |
0.37 |
0.00 |
CD99 molecule |
204007_at |
FCGR3b |
0.42 |
0.00 |
Fc fragment of IgG, low affinity IIIb, receptor (CD16b) |
213475_s_at |
ITGAL |
0.47 |
0.00 |
integrin, alpha L (antigen CD11A (p180), lymphocyte function-associated antigen 1; alpha polypeptide) |
206150_at |
TNFRSF7 |
0.25 |
0.00 |
CD27 molecule |
Gene expression was profiled in MMC samples from the HM cohort (n=206 patients with MM) and BMPC samples (healthy controls; n=7) using Affymetrix U133 plus 2.0 microarrays. Genes that are significantly differentially expressed were identified using SAM supervised unpaired analysis with a 5% false discovery rate.
Among the 16 CD genes that were significantly downregulated [ratio ≥2; FDR <0.05; 1000 permutations] in MMC compared with normal BMPC samples (Table 2), CD19 and CD27 are already used to discriminate BMPC from MMC [21-23]. Moreover, 11 of these 16 CD genes were also significantly downregulated in HMCL [ratio≥ 2, FDR< 0.05; 1000 permutations] compared with primary MMC (Figure 1) (Supplementary Table 2B).
Prognostic value of CD gene expression in MM and development of a CD gene risk score
Using the Maxstat R function and the Benjamini Hochberg multiple testing correction [24], high expression of four genes (CD24, CD27, CD36 and CD302), among the 266 CD probesets, was associated with longer overall survival (OS) in both training and validation cohorts (HM cohort: n=206, and TT2 cohort: n=345, respectively) (Figure 2A and 2B).
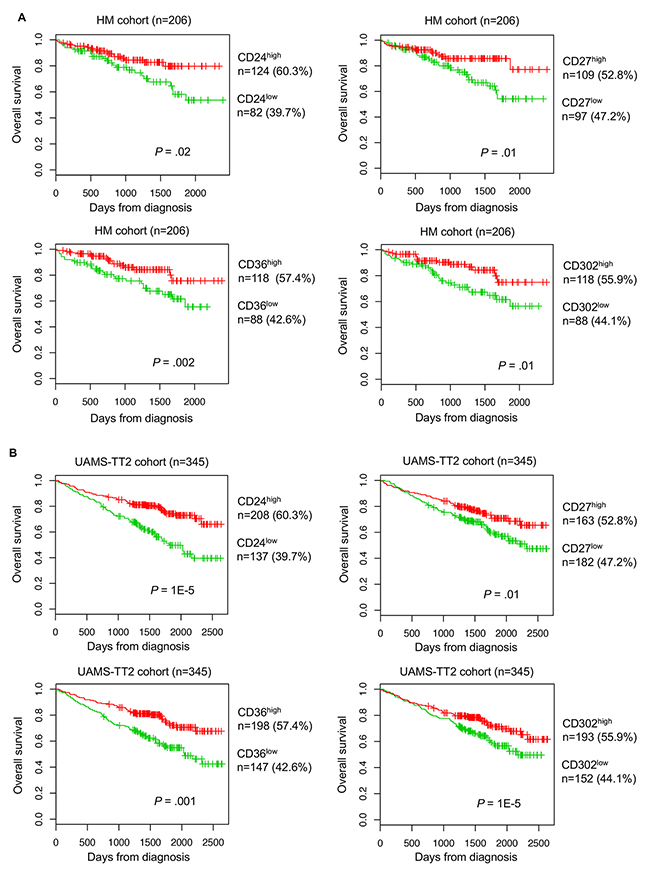
Figure 2: Prognostic value of CD24, CD27, CD36 and CD302 expression level in patients with MM. Overall survivalestimations using Kaplan-Meier curves in patients with MM with high (red) or low (green) expression of CD24, CD27, CD36 and CD302 in two independent cohorts: (A) HM training cohort and (B) TT2 validation cohort. Patients with high expression of CD24, CD27, CD36 and CD302 showed longer overall survival compared with patients with low expression.
Moreover, by classifying patients with MM in different molecular subgroups [25], we found that CD24, CD27 and CD36 were significantly downregulated in MMC samples from patients with MM classified in the proliferation subgroup. CD24 was also significantly downregulated in the hyperdiploid subgroup, whereas CD27 and CD302 were downregulated in the CD1 subgroup. Conversely, in the CD2 subgroup, CD27 was significantly overexpressed. Finally, CD302 was significantly overexpressed in the low bone disease subgroup and downregulated in the MAF and CD1 subgroups (Supplementary Figure 2). We validated the heterogeneous expression of CD24, CD36 and CD302 in MM (Supplementary Figure 8) by real-time RT-PCR and flow cytometry (Supplementary Figures 3 and 4). We also identified a significant correlation between CD27 gene expression and protein expression (P<0.001) using flow cytometry and Affymetrix data collected at diagnosis for 37 patients (Supplementary Figure 5).
These four CD genes were then used to create a CD gene risk score. To combine the prognostic information of CD24, CD27, CD36 and CD302 expression, first a simple staging scoring was built by splitting patients from the HM cohort in five groups according to CD24, CD27, CD36 and CD302 expression in their MMC samples (group 1: low expression of all four genes; group 2: high expression of only one; group 3: high expression of two; group 4: high expression of three of the four genes; group 5: high expression of all four genes). Kaplan Meier analysis of the five different groups (Figure 3A) was performed and when two consecutive groups did not show any significant difference, they were merged. This approach resulted in two groups with different OS. Group 1 (72.8% of all patients) comprised patients with high expression of all or two or three of the four CD genes, whereas group 2 (the remaining 27.2%) included patients with high expression of only one CD gene or low expression of all CD genes (Figure 3B). Group 1 (low risk) had a not reached median OS and group 2 (high risk) had a median OS of 50.6 months (P = 2.06E-6) (Figure 3B).
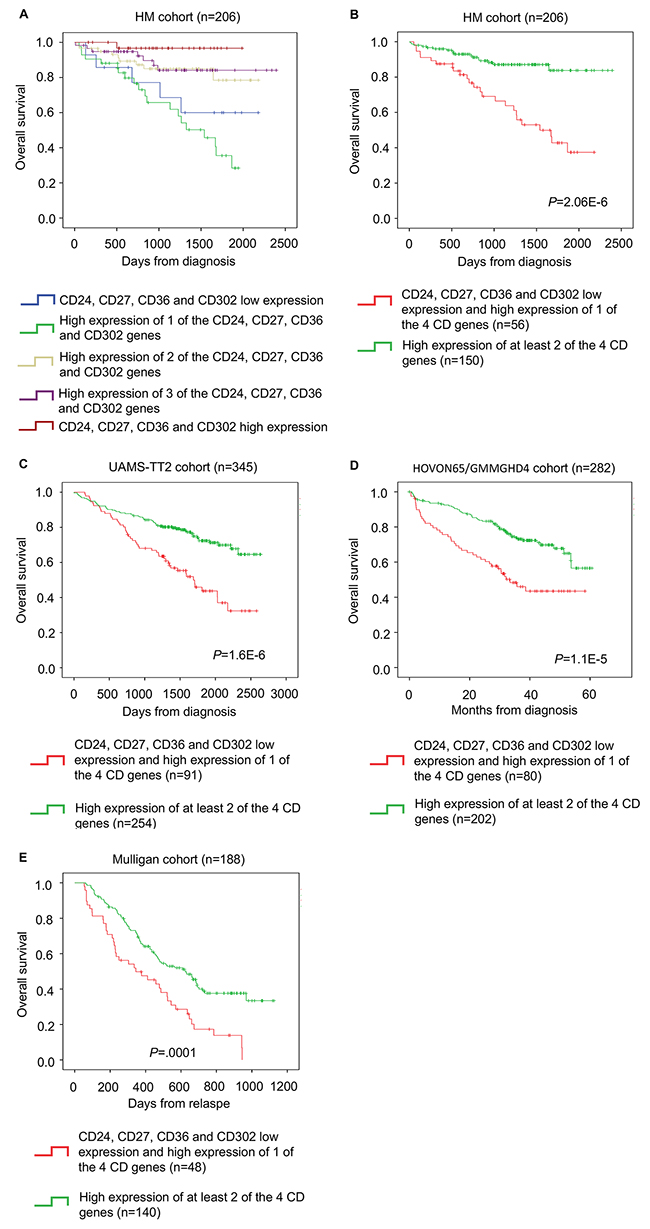
Figure 3: The CD gene risk score predicts overall survival in patients with MM. (A) Kaplan-Meier estimates of the overall survival in patients from the HM cohort with high CD24, CD27, CD36 and CD302 expression (red) or low expression of one (purple), two (yellow), three (green) or all four genes (blue). When two consecutive groups showed no significant difference, they were merged. (B) This process led to the identification of two groups in the HM cohort: low-risk (high expression of at least two of the four genes; green) and high-risk patients (low expression of all four genes or high expression of only one of the four genes; red). The CD gene risk score prognostic value at diagnosis was confirmed in two other independent cohorts, (C) TT2 cohort and (D) HOVON65/GMMGHD4 cohort, as well as (E) in the Mulligan cohort (n=188).
The prognostic value of the CD gene risk score was validated in two independent cohorts of newly diagnosed patients (TT2 cohort; n=345 patients and HOVON65/GMMGHD4 cohort; n=282 patients). Again, in both cohorts, in group 1 (low risk) the median OS was not reached, whereas in group 2 (high risk) the median OS was 55.5 months (P = 1.6E-6) in the TT2 cohort and 33.4 months (P = 1.1E-5) in the HOVON65/GMMGHD4 cohort (Figure 3C and 3D).
The CD gene risk score could also predict the event-free survival (EFS) in the HM cohort (P = 3.3E-5) (Figure 4A). This prognostic value was validated in the TT2 (P =.0001) and HOVON65/GMMGHD4 cohorts (P =.01) (Figure 4B and 4C).
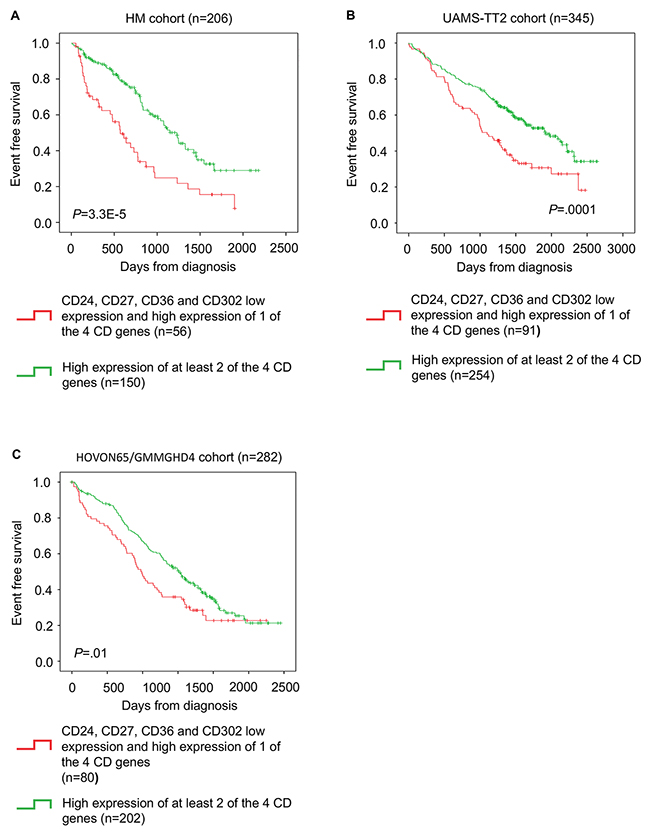
Figure 4: CD gene risk score predicts event-free survival in patients with MM. (A) Kaplan-Meier estimates of event-free survival in patients with high expression of at least two of the four genes (green; low-risk group) or low expression all four genes or high expression of only one (red; high-risk group) in the HM cohort (B) TT2 cohort and (C) HOVON65/GMMGHD4 cohort.
We then investigated whether the CD gene risk-score could have a prognostic value for patients at relapse using a cohort of relapsing patients treated with bortezomib (Mulligan cohort: n=188). The CD gene risk score could separate patients in two groups with significantly different OS (median OS of 11.3 months for the high-risk group and of 23.8 months for the low-risk group; P = 0.0001) (Figure 3E).
COX univariate and multivariate analyses of the CD gene risk score
The CD gene risk score prognostic value was then compared with that of conventional prognostic factors and other gene expression-based risk scores. In univariate COX analyses, the CD gene risk score, International Staging system (ISS) [26], β2-microglobulin (β2M) and albumin levels, t(4;14) translocation, deletion of 17p (del17p), high-risk score (HRS) [27], Intergroupe Francophone du Myelome (IFM) score [28], gene expression-based proliferation index (GPI) [29] and risk stratification (RS) score [30] showed a prognostic value in both the HM and TT2 cohorts (Table 3). In 2 by 2 analyses with ISS, β2M, t(4; 14), HRS, GPI and RS, the CD gene risk score was still independently associated with OS in the HM cohort (Table 3). In the TT2 cohort, it remained significant when tested with t(4;14), HRS, IFM score, GPI and RS score (Table 3). When all parameters were tested together, the prognostic value of the CD gene risk score, β2M, t(4; 14), IFM score and RS score remained significant in the HM cohort. In the TT2 cohort, the CD gene risk score, t(4; 14) and HRS remained independent prognostic factors (Table 3). Furthermore, the CD score remains a prognostic factor in low-risk and high-risk MM patients based on cytogenetics (Figure 5).
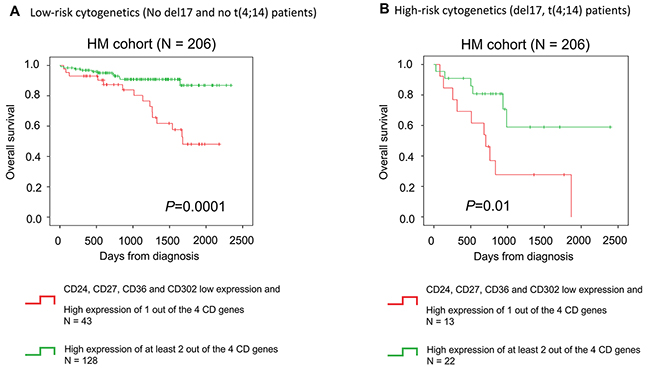
Figure 5: CD gene risk score is a prognostic factor in low-risk and high-risk patients based on cytogenetics. The CD gene risk score predicts overall survival in (A) patients with MM independently of cytogenetics. The CD gene risk score has a (B) prognostic value in low-risk (No del17 and no t(4;14) patients) and high-risk patients based on cytogenetics (del17 and t(4;14) abnormalities).
Table 3: Cox univariate and multivariate analyses to model overall survival (OS) in the HM (n=206 patients with MM) and TT2 (n=345 patients with MM) cohorts relative to the CD gene risk score, conventional prognostic factors and other gene expression-based risk scores
Univariate COX analysis |
HM-cohort |
TT2-cohort |
||
Prognostic variable |
Proportional hazard ratio |
P-value |
Proportional hazard ratio |
P-value |
CD-score |
0.24 |
<0.0001 |
0.41 |
<0.0001 |
ISS |
1.84 |
0.002 |
NA |
NA |
B2m |
1.1 |
<0.0001 |
NA |
NA |
t(4 ;14) |
3.32 |
<0.0001 |
2.21 |
0,001 |
del17p |
3.44 |
0.02 |
NA |
NA |
HRS |
2.37 |
0.01 |
4.67 |
<0.0001 |
IFM score |
2.49 |
0.01 |
1.78 |
0,004 |
GPI |
2.54 |
<0.0001 |
1.75 |
<0.0001 |
RS |
4.16 |
<0.0001 |
1.91 |
<0.0001 |
2 by 2 Multivariate COX analysis |
HM-cohort |
TT2-cohort |
||
Prognostic variable |
Proportional hazard ratio |
P-value |
Proportional hazard ratio |
P-value |
CD-score |
0.27 |
<0.0001 |
NA |
NA |
ISS |
1.63 |
0.01 |
NA |
NA |
CD-score |
0.23 |
<0.0001 |
NA |
NA |
B2m |
1.1 |
<0.0001 |
NA |
NA |
CD-score |
0.27 |
<0.0001 |
0.41 |
<0.0001 |
t(4 ;14) |
2.59 |
0,007 |
2.2 |
<0.0001 |
CD-score |
0.23 |
<0.0001 |
NA |
NA |
del17p |
2.8 |
0.05 |
NA |
NA |
CD-score |
0.23 |
<0.0001 |
0.53 |
0.002 |
HRS |
2.54 |
0.009 |
3.69 |
<0.0001 |
CD-score |
0.26 |
<0.0001 |
0.43 |
<0.0001 |
IFM score |
1.83 |
NS |
1.58 |
0.02 |
CD-score |
0.28 |
<0.0001 |
0.46 |
<0.0001 |
GPI |
2.22 |
0.003 |
1.46 |
0.01 |
CD-score |
0.32 |
0,001 |
0.47 |
<0.0001 |
RS |
3.76 |
<0.0001 |
1.65 |
0.001 |
Multivariate COX analysis |
HM-cohort |
TT2-cohort |
||
Prognostic variable |
Proportional hazard ratio |
P-value |
Proportional hazard ratio |
P-value |
CD-score |
0.24 |
<0.0001 |
0.57 |
0.009 |
ISS |
0.92 |
NS |
NA |
NA |
B2m |
1.1 |
0.001 |
NA |
NA |
t(4 ;14) |
2.91 |
0.02 |
2.13 |
0.003 |
del17p |
1.26 |
NS |
NA |
NA |
Multivariate COX analysis |
HM-cohort |
TT2-cohort |
||
Prognostic variable |
Proportional hazard ratio |
P-value |
Proportional hazard ratio |
P-value |
HRS |
1.52 |
NS |
2.74 |
<0.0001 |
IFM score |
0.24 |
0.02 |
0.95 |
NS |
GPI |
1.38 |
NS |
1.14 |
NS |
RS |
3.15 |
0.005 |
0.95 |
NS |
CD-score: CD gene risk score, ISS: International Staging system, B2M: β2-microglobulin level, t(4;14): t(4;14) translocation, del17p: deletion of 17p, HRS: high-risk score, IFM score: Intergroupe Francophone du Myelome (IFM) score, GPI: gene expression-based proliferation index, RS: risk stratification score.
MMC from low-risk patients according to the CD gene risk score have a mature BMPC gene signature, whereas MMC from high-risk patients are characterized by high proliferation and MYC target gene-related signatures
Finally, the gene expression profiles of MMC samples from patients of the HM cohort classified as high- and low-risk based on their CD gene risk score (n=71 and n=135, respectively) were compared by using Gene Set Enrichment Analysis (GSEA) [31]. Genes related to mature BMPC (TARTE_PLASMA_CELL_VS_PLASMABLAST_UP, P=0.003) and to normal BMPC (ZHAN MULTIPLE MYELOMA DN, P=0.01) were significantly enriched in MMC samples from the low-risk CD gene risk score group (Supplementary Figure 6A). Conversely, MMC samples from the high-risk group were characterized by a significant enrichment of genes related to undifferentiated plasmablasts (MOREAUX MULTIPLE MYELOMA BY TACI DN, P<0.0001), MYC target genes (SCHLOSSER MYC TARGETS REPRESSED BY SERUM, P=0.01) and the myeloma CD1 molecular subgroup (ZHAN MULTIPLE MYELOMA CD1 UP, P=0.01) (Supplementary Figure 6B).
DISCUSSION
In our study, we compared CD antigens expression between normal and malignant plasma cells to identify new potential markers to discriminate normal from malignant plasma cells, new potential therapeutic targets for monoclonal-based treatments and new prognostic factors.
Among the differentially expressed CD genes, CD11a, CD19, CD27, CD52, CD79a, CD81 and CD82 were previously shown to be downregulated in MMC compared to BMPC [32-35]. CD52 expression was shown to be correlated with chromosome 1q21 gain [10]. CD150 and CD86 protein expression was reported to be lower in MM cells compared to normal plasma cells [36]. CD19, CD27 and CD81 are also used to discriminate between normal and abnormal PCs in patients with MM [5]. Moreover, we found a significant downregulation of new surface antigens that could be useful to discriminate MMC from normal BPMC: CD5 protein like (CD5L), CD16, CD24, CD36, CD68, CD80, CD84, CD99 and CD163 (Supplementary Table 3). CD5L is involved in modulating leukocyte migration and the inflammatory response. CD5L in combination with transforming growth factor-beta inhibits B lymphocytes proliferation [37]. CD36 is a scavenger CD5L receptor and the cellular uptake of this protein is decreased in cells that downregulate CD36 [38]. CD16 (Fc γRIII) is a member of the Ig gene superfamily. Different groups did not observe CD16 expression in the B lymphocyte lineage, including in BMPC [39] and MMC [40, 41]. Nevertheless, in MM, the serum level of soluble CD16 is correlated with the disease stage. Specifically, low CD16 expression level is associated with MM or rapidly progressing monoclonal gammopathy of undetermined significance (MGUS) compared with stable MGUS or control serum samples [42, 43]. CD68, a transmembrane glycoprotein, and CD163, a scavenger receptor of hemoglobin-haptoglobin complexes, are mainly expressed by macrophages, are linked to anti-inflammation responses [44] and are associated with poor MM prognosis [45]. CD99 is a cell surface glycoprotein involved in leukocyte migration, adhesion and transmembrane protein transport. The level of CD99 on B-cells decreases with the maturation stage and in advanced B-cell malignancies [46]. The CD24 glycolipid and the CD80 and CD84 glycoproteins are expressed on many B cells [47]. CD24 was reported to be not expressed by HMCL and MM cells from patients at relapse [48, 49]. We identified a significant downregulation of CD24 in HMCL and in patients at relapse compared to newly diagnosed MM patients (Supplementary Figures 8 and 9). CD80 is involved in the regulation of the immune response by activating T-cells [50] and CD84 is a member of the signaling lymphocyte activation molecule (SLAM) family [51]. These downregulated proteins are mainly involved in cell adhesion, migration, proliferation and immune response. Downregulation of these proteins could be involved in MM development and MMC growth, survival and immune system escape. These new markers could be of interest to discriminate MMC from normal BMPC by multi-parametric flow cytometry at diagnosis and for the follow-up of patients with minimal residual disease.
Among the CD genes significantly overexpressed in MMC samples, CD1d, CD32 (Fc γRII), CD47, CD59 and CD200 play a role in MM pathophysiology. These proteins are involved in MMC proliferation, immune response, crosstalk between MMC and bone marrow microenvironment, antitumor cell regulation, drug resistance or bone resorption [5, 11, 13-15, 19, 52-55]. We also found significant overexpression of new potential MM surface antigens: CD2 binding protein 2 (CD2BP2), CD109, CD300a and CD320 (Supplementary Table 3). CD2BP2 interacts with CD2 and is involved in cytokine signaling, such as IL-2, in T-cells [56]. CD109 is an anchored protein with an important role in osteoclastogenesis, proliferation and tumorigenesis [57]. Like for CD47 [15, 53], CD109 targeting with anti-CD109 monoclonal antibodies could help reducing osteoclastogenesis in MM. CD300a is an immunoregulatory molecule from the same family as CD32 with a single V-like Ig domain and four immunoreceptor tyrosine-based inhibitory motifs (ITIMs) involved in immune response regulation [58]. Phosphotidylserines expressed by apoptotic cells are CD300a ligands and upon binding, the uptake of these cells by phagocytic cells is inhibited [59]. Targeting CD300a could be of therapeutic interest to increase NK cell-mediated MMC killing. CD320 (TCblR) is involved in cell metabolism and in cell cycle regulation. CD320 is strongly expressed by proliferating cells [60-62]. Furthermore, anti-CD320 antibodies inhibit the proliferation of the lymphoma cell line L3055 [60]. Monoclonal antibody-targeted therapies have shown promising results in MM [3, 4] and our study provides new potential therapeutic targets.
We then developed a CD gene risk score based on the expression level of CD24, CD27, CD36 and CD302 in MMC that shows a prognostic value in four independent cohorts of patients with MM. MMC from patients in the low-risk CD gene risk score group have a significant enrichment of genes related to normal and mature BMPC. Conversely, MMC from the high-risk CD-score patient group overexpress genes associated with undifferentiated plasmablasts. Accordingly, CD24, CD27, CD36 and CD302 are significantly overexpressed in mature BMPC compared with plasmablasts (Supplementary Figure 7). MMC samples from high-risk CD-score patients are also significantly enriched in genes related to MYC target genes and the myeloma CD1 molecular subgroup. MYC is an oncogene that acts as a transcription factor and is involved in various pathways, including cell cycle progression, apoptosis and cell transformation [62, 63]. In myeloma, MYC activation may be mediated through copy number changes or translocations where B-cell super-enhancers are juxtaposed to MYC, thus resulting in its overexpression [64]. MYC upregulation is associated with disease progression, evolution from MGUS to MM and poor prognosis [64]. MYC is involved in MM progression to the symptomatic stage and MYC abnormalities are detected in 54% of newly diagnosed patients [65]. The validation of this CD gene risk score at the protein level using flow cytometry could lead to a simpler, faster and cheaper prognostic tool for routine MM diagnosis and minimal residual disease follow-up. CD24, CD27, CD36 and CD302 gene expression could also be combined with a flow cytometry approach using the PrimeFlow® RNA Assay to develop a powerful tool for risk stratification and outcome prediction in MM. Furthermore, it will be important to understand the functional role of CD24, CD27, CD36 and CD302 in MM pathogenesis and pathophysiology.
In conclusion, the CD gene risk score allows the identification of high-risk patients with MM based on the expression of four genes that encode CD surface antigens and could represent a powerful tool for simple outcome prediction in MM.
MATERIALS AND METHODS
Clinical samples and gene expression data
Affymetrix data from two independent cohorts of previously untreated patients with MM were used. The training cohort consisted of 206 patients with MM and was called Heidelberg-Montpellier (HM) cohort. This cohort also included five BMPC samples from healthy donors. Samples were obtained after signature of a written informed consent form in accordance with the Declaration of Helsinki and after approval by the Ethics Committees of Montpellier (DC-2008-417) and Heidelberg. After Ficoll-density gradient centrifugation, plasma cells were purified using anti-CD138 MACS microbeads (Miltenyi Biotech, Bergisch Gladbach, Germany) as previously described [66]. These data are publicly available through the ArrayExpress database (E-MTAB-372). The validation cohort (TT2 cohort) included 345 patients with MM from the University of Arkansas for Medical Sciences (UAMS, Little Rock, AR, USA). These data can be accessed at the online Gene Expression Omnibus (GSE2658). The clinical characteristics of the two cohorts have been previously described [29, 67]. Gene expression profile data from a cohort of 282 patients with MM included in the Dutch-Belgian/German HOVON-65/GMMG-HAD trial were also used (GSE19784) (HOVON65/GMMGHD4 cohort) [68]. The clinical characteristics of the this cohort have been previously described [68]. We also used Affymetrix data of 188 relapsed patients with MM subsequently treated with bortezomib (GSE9782) from the study by Mulligan et al. (Mulligan cohort) [69]. The XG1, XG2, XG3, XG4, XG5, XG6, XG7, XG10, XG11, XG12, XG13, XG14, XG16, XG19, XG20 and XG21 HMCLs were obtained as previously described [70]. The AMO-1, LP1, L363, U266, OPM2, and SKMM2 HMCLs were purchased from DSMZ (Braunsweig, Germany) and the RPMI8226 cell line from ATTC (Rockville, MD, USA). HMCLs were authenticated by short tandem repeat profiling and gene expression profiling using Affymetrix U133 plus 2.0 microarrays; data were deposited in the ArrayExpress public database under accession numbers E-TABM-937 and E-TABM-1088 [70].
Gene expression profiling and statistical analyses
Gene expression data were normalized using the MAS5 algorithm and analyzed with GenomicScape (http://www.genomicscape.com) [71]. Gene expression profiles were compared using SAM. Probe sets were selected for prognostic significance using the Maxstat R function and the Benjamini Hochberg multiple testing correction. The statistical significance of differences in OS and EFS between patients’ groups was calculated by using the log-rank test. Multivariate analysis was performed using the Cox proportional hazards model. Survival curves were plotted using the Kaplan-Meier method. All analyses were done with R.2.10.1 and Bioconductor version 2.5.
Gene set enrichment analysis
The gene expression levels of high risk and low risk MM patients according to the CD gene risk score were compared and genes with significantly different expression were identified for GSEA. GSEA was carried out by computing the overlap with canonical pathways and gene ontology annotations obtained from the Broad Institute, Cambridge, USA.
Author contributions
EA performed research and participated in the writing of the paper.
GR, NR, SB participated in the research.
HG, AS, SB and DH participated in clinical data analysis and participated in the writing of the paper.
BK participated in the research and in the writing of the paper.
JM and SR supervised the research and the writing of the paper.
CONFLICTS OF INTEREST
The authors have no conflicts of interest to declare.
FUNDING
This work was supported by grants from French INCA (Institut National du Cancer) Institute (2012-109/087437 and PLBIO15-256), Languedoc Roussillon CRLR (R14026FF), Fondation de France (201400047510), ITMO Cancer (MM&TT), BPI France in the frame of the DataDiag project and SIRIC Montpellier INCa-DGOS-Inserm 6045.
REFERENCES
1. Raab MS, Podar K, Breitkreutz I, Richardson PG, Anderson KC. Multiple myeloma. Lancet. 2009; 374: 324-39. https://doi.org/10.1016/S0140-6736(09)60221-X.
2. Teitelbaum A, Ba-Mancini A, Huang H, Henk HJ. Health care costs and resource utilization, including patient burden, associated with novel-agent-based treatment versus other therapies for multiple myeloma: findings using real-world claims data. Oncologist. 2013; 18: 37-45. https://doi.org/10.1634/theoncologist.2012-0113.
3. Donato F, Gay F, Bringhen S, Troia R, Palumbo A. Monoclonal antibodies currently in Phase II and III trials for multiple myeloma. Expert Opin Biol Ther. 2014; 14: 1127-44. https://doi.org/10.1517/14712598.2014.908848.
4. van de Donk NW, Kamps S, Mutis T, Lokhorst HM. Monoclonal antibody-based therapy as a new treatment strategy in multiple myeloma. Leukemia. 2012; 26: 199-213. https://doi.org/10.1038/leu.2011.214.
5. Rawstron AC, Orfao A, Beksac M, Bezdickova L, Brooimans RA, Bumbea H, Dalva K, Fuhler G, Gratama J, Hose D, Kovarova L, Lioznov M, Mateo G, et al. Report of the European Myeloma Network on multiparametric flow cytometry in multiple myeloma and related disorders. Haematologica. 2008; 93: 431-8. https://doi.org/10.3324/haematol.11080.
6. Gupta R, Bhaskar A, Kumar L, Sharma A, Jain P. Flow cytometric immunophenotyping and minimal residual disease analysis in multiple myeloma. Am J Clin Pathol. 2009; 132: 728-32. https://doi.org/10.1309/AJCP1GYI7EHQYUYK.
7. Raja KR, Kovarova L, Hajek R. Review of phenotypic markers used in flow cytometric analysis of MGUS and MM, and applicability of flow cytometry in other plasma cell disorders. Br J Haematol. 2010; 149: 334-51. https://doi.org/10.1111/j.1365-2141.2010.08121.x.
8. Seegmiller AC, Xu Y, McKenna RW, Karandikar NJ. Immunophenotypic differentiation between neoplastic plasma cells in mature B-cell lymphoma vs plasma cell myeloma. Am J Clin Pathol. 2007; 127: 176-81. https://doi.org/10.1309/5EL22BH45PHUPM8P.
9. Tembhare PR, Yuan CM, Venzon D, Braylan R, Korde N, Manasanch E, Zuchlinsky D, Calvo K, Kurlander R, Bhutani M, Tageja N, Maric I, Mulquin M, et al. Flow cytometric differentiation of abnormal and normal plasma cells in the bone marrow in patients with multiple myeloma and its precursor diseases. Leuk Res. 2014; 38: 371-6. https://doi.org/10.1016/j.leukres.2013.12.007.
10. Salama ME, Du S, Efimova O, Heikal NM, Wendlandt E, Toydemir RM, South S, Perkins SL, Hussong JW, Zhan F. Neoplastic plasma cell aberrant antigen expression patterns and their association with genetic abnormalities. Leuk Lymphoma. 2015; 56: 426-33. https://doi.org/10.3109/10428194.2014.931951.
11. Moreaux J, Hose D, Reme T, Jourdan E, Hundemer M, Legouffe E, Moine P, Bourin P, Moos M, Corre J, Mohler T, De Vos J, Rossi JF, et al. CD200 is a new prognostic factor in multiple myeloma. Blood. 2006; 108: 4194-7.
12. Moreaux J, Veyrune JL, Reme T, De Vos J, Klein B. CD200: a putative therapeutic target in cancer. Biochem Biophys Res Commun. 2008; 366: 117-22. https://doi.org/10.1016/j.bbrc.2007.11.103.
13. Olteanu H, Harrington AM, Kroft SH. CD200 expression in plasma cells of nonmyeloma immunoproliferative disorders: clinicopathologic features and comparison with plasma cell myeloma. Am J Clin Pathol. 2012; 138: 867-76. https://doi.org/10.1309/AJCP3TQR1TFHHGAS.
14. Spanoudakis E, Hu M, Naresh K, Terpos E, Melo V, Reid A, Kotsianidis I, Abdalla S, Rahemtulla A, Karadimitris A. Regulation of multiple myeloma survival and progression by CD1d. Blood. 2009; 113: 2498-507. https://doi.org/10.1182/blood-2008-06-161281.
15. Kim D, Wang J, Willingham SB, Martin R, Wernig G, Weissman IL. Anti-CD47 antibodies promote phagocytosis and inhibit the growth of human myeloma cells. Leukemia. 2012; 26: 2538-45. https://doi.org/10.1038/leu.2012.141.
16. Rendtlew Danielsen JM, Knudsen LM, Dahl IM, Lodahl M, Rasmussen T. Dysregulation of CD47 and the ligands thrombospondin 1 and 2 in multiple myeloma. Br J Haematol. 2007; 138: 756-60. https://doi.org/10.1111/j.1365-2141.2007.06729.x.
17. Alcindor T, Kimlinger T, Witzig TE. High expression of CD59 and CD55 on benign and malignant plasma cells. Leuk Lymphoma. 2006; 47: 919-21. https://doi.org/10.1080/10428190500467784.
18. Xiang Z, Cutler AJ, Brownlie RJ, Fairfax K, Lawlor KE, Severinson E, Walker EU, Manz RA, Tarlinton DM, Smith KG. FcgammaRIIb controls bone marrow plasma cell persistence and apoptosis. Nat Immunol. 2007; 8: 419-29. https://doi.org/10.1038/ni1440.
19. Williams EL, Tutt AL, Beers SA, French RR, Chan CH, Cox KL, Roghanian A, Penfold CA, Butts CL, Boross P, Verbeek JS, Cragg MS, Glennie MJ. Immunotherapy targeting inhibitory Fcgamma receptor IIB (CD32b) in the mouse is limited by monoclonal antibody consumption and receptor internalization. J Immunol. 2013; 191: 4130-40. https://doi.org/10.4049/jimmunol.1301430.
20. Zhou P, Comenzo RL, Olshen AB, Bonvini E, Koenig S, Maslak PG, Fleisher M, Hoffman J, Jhanwar S, Young JW, Nimer SD, Boruchov AM. CD32B is highly expressed on clonal plasma cells from patients with systemic light-chain amyloidosis and provides a target for monoclonal antibody-based therapy. Blood. 2008; 111: 3403-6. https://doi.org/10.1182/blood-2007-11-125526.
21. Rawstron AC, Gregory WM, de Tute RM, Davies FE, Bell SE, Drayson MT, Cook G, Jackson GH, Morgan GJ, Child JA, Owen RG. Minimal residual disease in myeloma by flow cytometry: independent prediction of survival benefit per log reduction. Blood. 2015; 125: 1932-5. https://doi.org/10.1182/blood-2014-07-590166.
22. Robillard N, Wuilleme S, Moreau P, Bene MC. Immunophenotype of normal and myelomatous plasma-cell subsets. Front Immunol. 2014; 5: 137. https://doi.org/10.3389/fimmu.2014.00137.
23. Schmidt-Hieber M, Gutierrez ML, Perez-Andres M, Paiva B, Rasillo A, Tabernero MD, Sayagues JM, Lopez A, Barcena P, Sanchez ML, Gutierrez NC, San Miguel JF, Orfao A. Cytogenetic profiles in multiple myeloma and monoclonal gammopathy of undetermined significance: a study in highly purified aberrant plasma cells. Haematologica. 2013; 98: 279-87. https://doi.org/10.3324/haematol.2011.060632.
24. Kassambara A, Hose D, Moreaux J, Walker BA, Protopopov A, Reme T, Pellestor F, Pantesco V, Jauch A, Morgan G, Goldschmidt H, Klein B. Genes with a spike expression are clustered in chromosome (sub)bands and spike (sub)bands have a powerful prognostic value in patients with multiple myeloma. Haematologica. 2012; 97: 622-30. https://doi.org/10.3324/haematol.2011.046821.
25. Zhan F, Huang Y, Colla S, Stewart JP, Hanamura I, Gupta S, Epstein J, Yaccoby S, Sawyer J, Burington B, Anaissie E, Hollmig K, Pineda-Roman M, et al. The molecular classification of multiple myeloma. Blood. 2006; 108: 2020-8.
26. Greipp PR, San Miguel J, Durie BG, Crowley JJ, Barlogie B, Blade J, Boccadoro M, Child JA, Harousseau JL, Kyle RA, Lahuerta JJ, Ludwig H, Morgan G, et al. International staging system for multiple myeloma. J Clin Oncol. 2005; 23: 3412-20.
27. Shaughnessy JD Jr, Zhan F, Burington BE, Huang Y, Colla S, Hanamura I, Stewart JP, Kordsmeier B, Randolph C, Williams DR, Xiao Y, Xu H, Epstein J, et al. A validated gene expression model of high-risk multiple myeloma is defined by deregulated expression of genes mapping to chromosome 1. Blood. 2007; 109: 2276-84.
28. Decaux O, Lode L, Magrangeas F, Charbonnel C, Gouraud W, Jezequel P, Attal M, Harousseau JL, Moreau P, Bataille R, Campion L, Avet-Loiseau H, Minvielle S. Prediction of survival in multiple myeloma based on gene expression profiles reveals cell cycle and chromosomal instability signatures in high-risk patients and hyperdiploid signatures in low-risk patients: a study of the Intergroupe Francophone du Myelome. J Clin Oncol. 2008; 26: 4798-805. https://doi.org/10.1200/JCO.2007.13.8545.
29. Hose D, Reme T, Hielscher T, Moreaux J, Messner T, Seckinger A, Benner A, Shaughnessy JD Jr, Barlogie B, Zhou Y, Hillengass J, Bertsch U, Neben K, et al. Proliferation is a central independent prognostic factor and target for personalized and risk-adapted treatment in multiple myeloma. Haematologica. 2011; 96: 87-95. https://doi.org/10.3324/haematol.2010.030296.
30. Reme T, Hose D, Theillet C, Klein B. Modeling risk stratification in human cancer. Bioinformatics. 2013; 29: 1149-57. https://doi.org/10.1093/bioinformatics/btt124.
31. Subramanian A, Tamayo P, Mootha VK, Mukherjee S, Ebert BL, Gillette MA, Paulovich A, Pomeroy SL, Golub TR, Lander ES, Mesirov JP. Gene set enrichment analysis: a knowledge-based approach for interpreting genome-wide expression profiles. Proc Natl Acad Sci U S A. 2005; 102: 15545-50. https://doi.org/10.1073/pnas.0506580102.
32. Paiva B, Paino T, Sayagues JM, Garayoa M, San-Segundo L, Martin M, Mota I, Sanchez ML, Barcena P, Aires-Mejia I, Corchete L, Jimenez C, Garcia-Sanz R, et al. Detailed characterization of multiple myeloma circulating tumor cells shows unique phenotypic, cytogenetic, functional, and circadian distribution profile. Blood. 2013; 122: 3591-8. https://doi.org/10.1182/blood-2013-06-510453.
33. Rawstron AC, Laycock-Brown G, Hale G, Davies FE, Morgan GJ, Child JA, Hillmen P, Owen RG. CD52 expression patterns in myeloma and the applicability of alemtuzumab therapy. Haematologica. 2006; 91: 1577-8.
34. Tanaka T, Ichimura K, Sato Y, Takata K, Morito T, Tamura M, Kondo E, Ohara N, Yanai H, Sakai M, Takahashi S, Yoshino T. Frequent downregulation or loss of CD79a expression in plasma cell myelomas: potential clue for diagnosis. Pathol Int. 2009; 59: 804-8. https://doi.org/10.1111/j.1440-1827.2009.02448.x.
35. Tohami T, Drucker L, Shapiro H, Radnay J, Lishner M. Overexpression of tetraspanins affects multiple myeloma cell survival and invasive potential. FASEB J. 2007; 21: 691-9. https://doi.org/10.1096/fj.06-6610com.
36. Muccio VE, Saraci E, Gilestro M, Gattei V, Zucchetto A, Astolfi M, Ruggeri M, Marzanati E, Passera R, Palumbo A, Boccadoro M, Omede P. Multiple myeloma: New surface antigens for the characterization of plasma cells in the era of novel agents. Cytometry B Clin Cytom. 2016; 90: 81-90. https://doi.org/10.1002/cyto.b.21279.
37. Yusa S, Ohnishi S, Onodera T, Miyazaki T. AIM, a murine apoptosis inhibitory factor, induces strong and sustained growth inhibition of B lymphocytes in combination with TGF-beta1. Eur J Immunol. 1999; 29: 1086-93. https://doi.org/10.1002/(SICI)1521-4141(199904)29:04<1086::AID-IMMU1086>3.0.CO;2-X.
38. Sanjurjo L, Aran G, Roher N, Valledor AF, Sarrias MR. AIM/CD5L: a key protein in the control of immune homeostasis and inflammatory disease. J Leukoc Biol. 2015; 98: 173-84. https://doi.org/10.1189/jlb.3RU0215-074R.
39. Terstappen LW, Johnsen S, Segers-Nolten IM, Loken MR. Identification and characterization of plasma cells in normal human bone marrow by high-resolution flow cytometry. Blood. 1990; 76: 1739-47.
40. Van Camp B, Durie BG, Spier C, De Waele M, Van Riet I, Vela E, Frutiger Y, Richter L, Grogan TM. Plasma cells in multiple myeloma express a natural killer cell-associated antigen: CD56 (NKH-1; Leu-19). Blood. 1990; 76: 377-82.
41. Leo R, Boeker M, Peest D, Hein R, Bartl R, Gessner JE, Selbach J, Wacker G, Deicher H. Multiparameter analyses of normal and malignant human plasma cells: CD38++, CD56+, CD54+, cIg+ is the common phenotype of myeloma cells. Ann Hematol. 1992; 64: 132-9.
42. Mathiot C, Teillaud JL, Elmalek M, Mosseri V, Euller-Ziegler L, Daragon A, Grosbois B, Michaux JL, Facon T, Bernard JF, Duclos B, Monconduit M, Fridman WH. Correlation between soluble serum CD16 (sCD16) levels and disease stage in patients with multiple myeloma. J Clin Immunol. 1993; 13: 41-8.
43. Mathiot C, Galon J, Tartour E, Teillaud JL, Facon T, Bataille R, Fridman WH, Sautes C. Soluble CD16 in plasma cell dyscrasias. Leuk Lymphoma. 1999; 32: 467-74. https://doi.org/10.3109/10428199909058404.
44. Suyani E, Sucak GT, Akyurek N, Sahin S, Baysal NA, Yagci M, Haznedar R. Tumor-associated macrophages as a prognostic parameter in multiple myeloma. Ann Hematol. 2013; 92: 669-77. https://doi.org/10.1007/s00277-012-1652-6.
45. Andersen MN, Abildgaard N, Maniecki MB, Moller HJ, Andersen NF. Monocyte/macrophage-derived soluble CD163: a novel biomarker in multiple myeloma. Eur J Haematol. 2014; 93: 41-7. https://doi.org/10.1111/ejh.12296.
46. Husak Z, Dworzak MN. CD99 ligation upregulates HSP70 on acute lymphoblastic leukemia cells and concomitantly increases NK cytotoxicity. Cell Death Dis. 2012; 3: e425. https://doi.org/10.1038/cddis.2012.164.
47. Ayre DC, Christian SL. CD24: a rheostat that modulates cell surface receptor signaling of diverse receptors. Front Cell Dev Biol. 2016; 4: 146. https://doi.org/10.3389/fcell.2016.00146.
48. Duperray C, Bataille R, Boiron JM, Haagen IA, Cantaloube JF, Zhang XG, Boucheix C, Klein B. No expansion of the pre-B and B-cell compartments in the bone marrow of patients with multiple myeloma. Cancer Res. 1991; 51: 3224-8.
49. Duperray C, Klein B, Durie BG, Zhang X, Jourdan M, Poncelet P, Favier F, Vincent C, Brochier J, Lenoir G, Bataille R. Phenotypic analysis of human myeloma cell lines. Blood. 1989; 73: 566-72.
50. Czuczman MS, Leonard JP, Jung S, Johnson JL, Hsi ED, Byrd JC, Cheson BD. Phase II trial of galiximab (anti-CD80 monoclonal antibody) plus rituximab (CALGB 50402): Follicular Lymphoma International Prognostic Index (FLIPI) score is predictive of upfront immunotherapy responsiveness. Ann Oncol. 2012; 23: 2356-62. https://doi.org/10.1093/annonc/mdr620.
51. Binsky-Ehrenreich I, Marom A, Sobotta MC, Shvidel L, Berrebi A, Hazan-Halevy I, Kay S, Aloshin A, Sagi I, Goldenberg DM, Leng L, Bucala R, Herishanu Y, et al. CD84 is a survival receptor for CLL cells. Oncogene. 2014; 33: 1006-16. https://doi.org/10.1038/onc.2013.31.
52. Favreau M, Vanderkerken K, Elewaut D, Venken K, Menu E. Does an NKT-cell-based immunotherapeutic approach have a future in multiple myeloma? Oncotarget. 2016; 7: 23128-40. https://doi.org/10.18632/oncotarget.7440.
53. Kukreja A, Radfar S, Sun BH, Insogna K, Dhodapkar MV. Dominant role of CD47-thrombospondin-1 interactions in myeloma-induced fusion of human dendritic cells: implications for bone disease. Blood. 2009; 114: 3413-21. https://doi.org/10.1182/blood-2009-03-211920.
54. You T, Hu W, Ge X, Shen J, Qin X. Application of a novel inhibitor of human CD59 for the enhancement of complement-dependent cytolysis on cancer cells. Cell Mol Immunol. 2011; 8: 157-63. https://doi.org/10.1038/cmi.2010.35.
55. Zheng X, Abroun S, Otsuyama K, Asaoku H, Kawano MM. Heterogeneous expression of CD32 and CD32-mediated growth suppression in human myeloma cells. Haematologica. 2006; 91: 920-8.
56. Heinze M, Kofler M, Freund C. Investigating the functional role of CD2BP2 in T cells. Int Immunol. 2007; 19: 1313-8. https://doi.org/10.1093/intimm/dxm100.
57. Wang Y, Inger M, Jiang H, Tenenbaum H, Glogauer M. CD109 plays a role in osteoclastogenesis. PLoS One. 2013; 8: e61213. https://doi.org/10.1371/journal.pone.0061213.
58. Clark GJ, Rao M, Ju X, Hart DN. Novel human CD4+ T lymphocyte subpopulations defined by CD300a/c molecule expression. J Leukoc Biol. 2007; 82: 1126-35. https://doi.org/10.1189/jlb.0107035.
59. Lankry D, Rovis TL, Jonjic S, Mandelboim O. The interaction between CD300a and phosphatidylserine inhibits tumor cell killing by NK cells. Eur J Immunol. 2013; 43: 2151-61. https://doi.org/10.1002/eji.201343433.
60. Lai SC, Nakayama Y, Sequeira JM, Quadros EV. Down-regulation of transcobalamin receptor TCblR/CD320 by siRNA inhibits cobalamin uptake and proliferation of cells in culture. Exp Cell Res. 2011; 317: 1603-7. https://doi.org/10.1016/j.yexcr.2011.02.016.
61. Quadros EV, Nakayama Y, Sequeira JM. Saporin conjugated monoclonal antibody to the transcobalamin receptor TCblR/CD320 is effective in targeting and destroying cancer cells. J Cancer Ther. 2013; 4: 1074-81. https://doi.org/10.4236/jct.2013.46122.
62. Quadros EV, Sequeira JM. Cellular uptake of cobalamin: transcobalamin and the TCblR/CD320 receptor. Biochimie. 2013; 95: 1008-18. https://doi.org/10.1016/j.biochi.2013.02.004.
63. Hoffman B, Liebermann DA. Apoptotic signaling by c-MYC. Oncogene. 2008; 27: 6462-72. https://doi.org/10.1038/onc.2008.312.
64. Glitza IC, Lu G, Shah R, Bashir Q, Shah N, Champlin RE, Shah J, Orlowski RZ, Qazilbash MH. Chromosome 8q24.1/c-MYC abnormality: a marker for high-risk myeloma. Leuk Lymphoma. 2015; 56: 602-7. https://doi.org/10.3109/10428194.2014.924116.
65. Tian E, Sawyer J, Stephens OW, Tytarenko R, Thanendrarajan S, Schinke C, Zangari M, van Rhee F, Davies FE, Walker BA, Morgan GJ. Translocations and jumping rearrangements at 8q24 result in over-expression of MYC and are key drivers of disease progression. Blood. 2016; 128: 115.
66. Moreaux J, Cremer FW, Reme T, Raab M, Mahtouk K, Kaukel P, Pantesco V, De Vos J, Jourdan E, Jauch A, Legouffe E, Moos M, Fiol G, et al. The level of TACI gene expression in myeloma cells is associated with a signature of microenvironment dependence versus a plasmablastic signature. Blood. 2005; 106: 1021-30.
67. Moreaux J, Reme T, Leonard W, Veyrune JL, Requirand G, Goldschmidt H, Hose D, Klein B. Development of gene expression-based score to predict sensitivity of multiple myeloma cells to DNA methylation inhibitors. Mol Cancer Ther. 2012; 11: 2685-92. https://doi.org/10.1158/1535-7163.MCT-12-0721.
68. Kuiper R, Broyl A, de Knegt Y, van Vliet MH, van Beers EH, van der Holt B, el Jarari L, Mulligan G, Gregory W, Morgan G, Goldschmidt H, Lokhorst HM, van Duin M, et al. A gene expression signature for high-risk multiple myeloma. Leukemia. 2012; 26: 2406-13. https://doi.org/10.1038/leu.2012.127.
69. Mulligan G, Mitsiades C, Bryant B, Zhan F, Chng WJ, Roels S, Koenig E, Fergus A, Huang Y, Richardson P, Trepicchio WL, Broyl A, Sonneveld P, et al. Gene expression profiling and correlation with outcome in clinical trials of the proteasome inhibitor bortezomib. Blood. 2007; 109: 3177-88. https://doi.org/10.1182/blood-2006-09-044974.
70. Moreaux J, Klein B, Bataille R, Descamps G, Maiga S, Hose D, Goldschmidt H, Jauch A, Reme T, Jourdan M, Amiot M, Pellat-Deceunynck C. A high-risk signature for patients with multiple myeloma established from the molecular classification of human myeloma cell lines. Haematologica. 2011; 96: 574-82. https://doi.org/10.3324/haematol.2010.033456.
71. Kassambara A, Reme T, Jourdan M, Fest T, Hose D, Tarte K, Klein B. GenomicScape: an easy-to-use web tool for gene expression data analysis. Application to investigate the molecular events in the differentiation of B cells into plasma cells. PLoS Comput Biol. 2015; 11: e1004077. https://doi.org/10.1371/journal.pcbi.1004077.