
INTRODUCTION
The skin is the first immune barrier of the body. Spontaneous mutant hairless (HL) mice are used to study hair growth and hair follicle development [1]. It has complex functions and is closely linked to the immune, skin, and pigment systems [2]. In 2007, we found a mouse model with a spontaneous coat mutation (HL mice). The phenotype of this mouse was hairless, and hematoxylin and eosin (H&E) staining showed abnormal hair follicle structure and development cycles. Previously, we analyzed some of the biological characteristics of the mice [3] by obtaining the dorsal skin of female normal and HL mice 42 days after birth and subjecting the samples to RNA sequencing to examine gene-expression patterns in mutant mice [4], in order to determine their usefulness as an animal model.
Listeria monocytogenes is an important food-borne bacterium that has been used in important applications for studying the immune responses of animals to infection. To fight against L. monocytogenes infection, the host would be actively mobilized through both innate and adaptive immunity. Simultaneously, some immune-related genes might also play an important role in fighting infection [5, 6].
In contrast to humans, mice showed apparent tolerance when L. monocytogenes was administered orally to generate the infection model, which raises questions about the use of this animal model. The sensitivity to L. monocytogenes infection differs among different inbred mouse strains. Earlier studies demonstrated that the intravenous (i.v.) and intraperitoneal (i.p.) routes are important for studying L. monocytogenes infection; multiple genes interact with immune responses to infection, for example, the Hc locus on chromosome 2 [7], Trail [8], and Lfa1 [9].
Germ-free mice can be easily recolonized with bacteria by placing a single mouse that has normal flora into a cage with other mice [10]. Since mice have the habit of swallowing feces, the intestinal microbes of mice tend to be consistent after co-housing different strains of mice in the same cage for about 4 weeks [11].
The genetic background and gut microbial composition have complex interactions [12] and no clear gut microbial polymorphisms have been shown to explain the difference in infection severity between NIH normal and NIH HL mice infected with L. monocytogenes. Therefore, we analyzed the innate immunity of NIH HL mice and the impact of gut microbial polymorphisms on L. monocytogenes infection.
RESULTS
HL mice are more susceptible to L. monocytogenes infection than NIH mice
In initial experiments, we analyzed the levels of resistance in four groups of mice (HL, NIH, HL co-housed with NIH, and NIH co-housed with HL) to an i.p. challenge with 2 × 10⁶ colony-forming units (cfu) of L. monocytogenes strain 10403S. HL mice died within 2–3 days of infection, and 16.7% of NIH mice survived till the end of the experiment after infection. After co-housing both kinds of mice, HL mice succumbed to infection within 4 days, and no significant difference was observed in the mortality of NIH mice. (Figure 1A). Similarly, when mice began to die after infection, HL mice lost 20% of their body weight, while NIH mice lost only about 10% of their body weight, and weight loss was not noted after day 5 (Figure 1B). To understand the spread of bacteria in mice, the number of bacteria in two main susceptible organs was measured on day 3 after infection. The results showed that the bacterial burdens in HL mice were more severe than those in NIH mice, but the bacterial burdens in the spleen of co-housed mice were not significantly different (Figure 1C). These results showed that mutant HL mice are more susceptible to L. monocytogenes infection than NIH mice. Co-housing did not have a major impact on mice in terms of weight changes and survival, although the bacterial burden in the spleen of HL and NIH mice was not significantly different after co-housing.
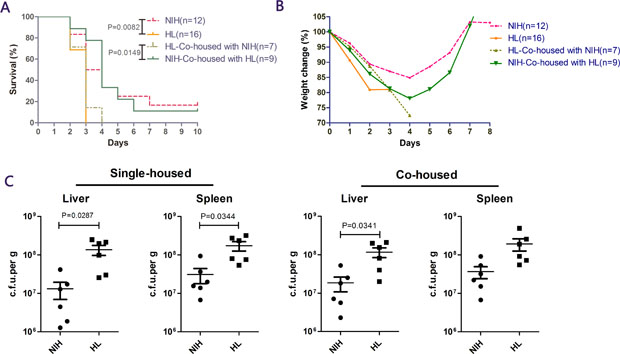
Figure 1: NIH hairless (HL) mice are susceptible to Listeria infection. (A) NIH HL mice, normal (NIH) mice, HL mice co-housed with NIH mice, and NIH mice co-housed with HL mice. Mice were administered L. monocytogenes via i.p. injection, and survival was monitored daily for 10 days. (B) Proportion of weight loss. (C) Bacterial loads in the four groups of mice were determined in the liver and spleen on day 3.
Histopathological lesions were more severe in HL mice than in NIH mice
To examine the pathological damage in organs and infiltration of inflammatory cells, H&E and Masson staining were performed. Consistent with previous results, large areas of inflammatory cells were found in the liver, the spleen tissue was severely damaged, and the boundaries between red and white pulp were blurred in HL mice, compared with those in NIH mice (Figure 2A). Masson staining also confirmed that the collagen fibers in the liver were stained blue due to an inflammatory response, and the bleeding areas in the splenic cord were stained orange red (Figure 2B). In HL-co-housed mice, a certain range of inflammatory cells was observed in the liver, but damage to the spleen was obviously reduced compared to that in HL mice (Figure 2C). In addition, Masson-stained cecum and colon sections of HL mice were found to have inflammatory lesions compared to that in NIH mice (Figure 2D). The negative control of Figure 2 was showed in Supplementary Figure 1. These results showed that histopathological lesions were more severe in HL mice than in NIH mice, and that co-housing can partially relieve spleen injury.
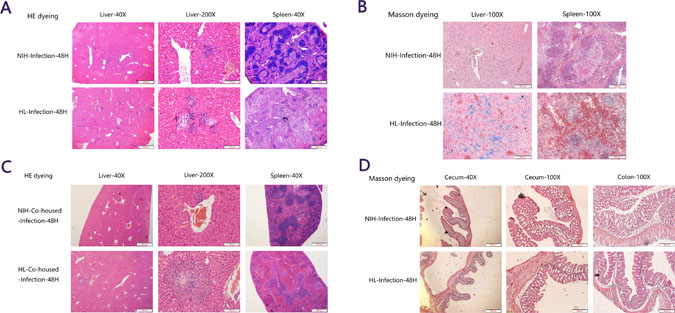
Figure 2: Histopathological lesions were more severe in HL mice than in NIH mice. (A) In HL mice, large areas of inflammatory cells were found in the liver, the spleen tissue was severely damaged, and the boundaries between red and white pulp were blurred, compared to those in NIH mice. (B) Masson staining confirmed that the collagen fibers were stained blue during liver inflammation, and the bleeding areas in the splenic cord were stained orange red. (C) In HL-co-housed mice, a certain range of inflammatory cells was present in the liver, but the damage in the spleen was obviously relieved compared to that in HL mice. (D) Masson-stained cecum and colon sections of HL mice had more inflammatory lesions than did NIH mice.
Reduced monocyte recruitment in infected HL mice
An automated hematology analyzer was used to analyze the quantities and proportions of monocytes and neutrophils. After infection, the weight of HL mice decreased significantly on days 1 and 2 compared to that of NIH mice (Figure 3A). No significant difference in the number of white blood cells was observed (Figure 3B). There was no significant difference in the number of neutrophils; however, in HL mice the proportion of neutrophils in the white blood cells was significantly higher on day 1 after infection than that in NIH mice (Figure 3C, 3D). Before infection, there were no significant differences in either the number of monocytes or their proportion in the white blood cells. However, after two days of infection, both indices were significantly lower in HL mice than in NIH mice (Figure 3E, 3F). These results showed that the monocyte levels were reduced significantly in HL mice at 48 h post-infection.
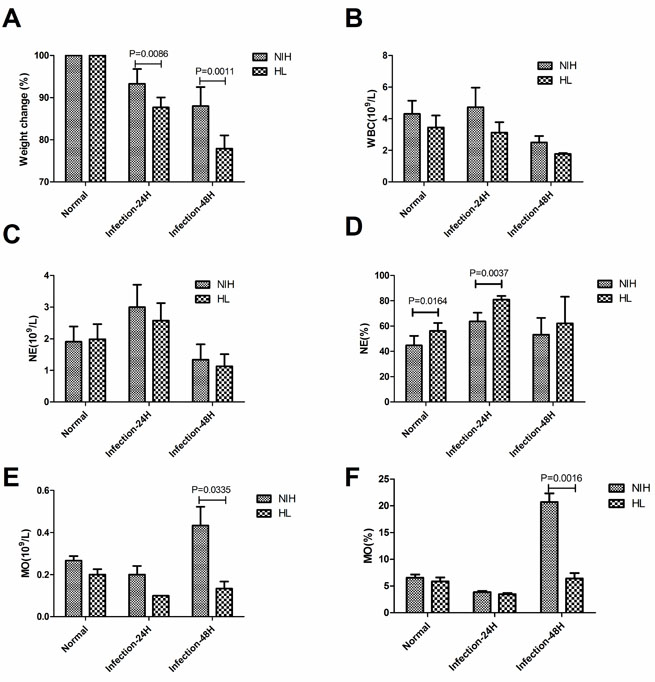
Figure 3: Reduced monocyte recruitment in infected HL mice. (A) Proportion of weight loss after infection. (B) The number of white blood cells in infected HL and NIH mice was assessed using an automated hematology analyzer. (C) The number of neutrophils. (D) The proportion of neutrophils in white blood cells. (E) The number of monocytes. (F) The proportion of monocytes in white blood cells.
Cytokine expression in the liver, spleen, and serum of infected HL and NIH mice
To investigate inflammatory changes in the organism after infection, the levels of inflammatory cytokines in serum, liver, and spleen were measured [13]. Quantitative results showed that in HL mice and HL-co-housed mice, the expression levels of TNF-α, IL-1β, and IL-6 in the liver were significantly higher than those in the liver of NIH mice, and the expression levels of IL-1β and IL-6 in the spleen were significantly higher than those in the spleen of NIH mice (Figure 4A). The enzyme-linked immunosorbent assay (ELISA) results showed that the expression levels of TNF-α and IL-1β in the liver were significantly increased in HL mice, compared to that in NIH mice. In HL-co-housed mice, only TNF-α protein expression levels in the liver were significantly increased, relative to that in NIH-co-housed mice. No other results showed a significant difference (Figure 4B). These results showed that inflammatory cytokines did not play a major role in infection with L. monocytogenes.
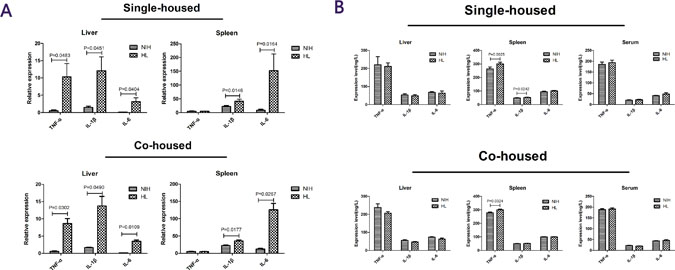
Figure 4: Cytokine levels in the liver, spleen, and serum of infected HL and NIH mice. (A) The expression levels of TNF-α, IL-1β and IL-6 in the liver and spleen in single-housed mice and co-housed mice after infection. (B) The protein-expression levels of TNF-α, IL-1β, and IL-6 in the liver and spleen, in single-housed mice and co-housed mice after infection.
Analysis of microbiome in the four groups of mice
Before and after infection, the intestinal microbiota composition was assessed by sequencing the bacterial 16S rRNA V3 + V4 region [14]. Twelve samples were sequenced, and 960,392 pairs of reads were obtained. Double-end read splicing and filtering resulted in 813,531 clean tags, and each sample produced 80,033 clean tags (Supplementary Table 1). Using QIIME (version 1.8.0) UCLUST software based on 97% sequence similarity, the tags were clustered into operational taxonomic units (OTUs); no significant difference was noted in the number of OTUs between the normal and post-infection groups, while the number of OTUs in HL mice decreased markedly relative to those in NIH mice (Figure 5A). The Venn diagram of OTUs (Figure 5B) [15] and the OTU rank (Figure 5C), rarefaction (Figure 5D), and Shannon (Figure 5E) curves were calculated. Difference analysis between groups were based on the Bray–Curtis algorithm, which mainly included principal coordinates analysis (PCoA), non-metric multi-dimensional scaling (NMDS), and unweighted pair-group method with arithmetic mean (UPGMA). The clustering and PCoA diagrams are shown in Figure 6A–6E.
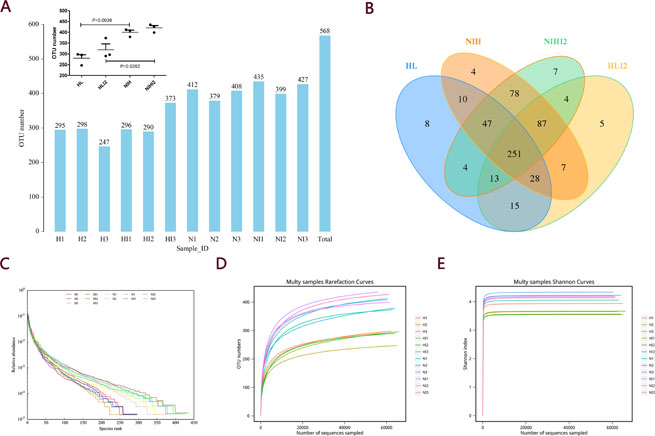
Figure 5: OTU analysis and alpha diversity analysis. (A) OTU number. (B) Venn diagram of OTUs. (C) Curves showing the OTU rank. (D) Rarefaction curves. (E) Shannon index curves.
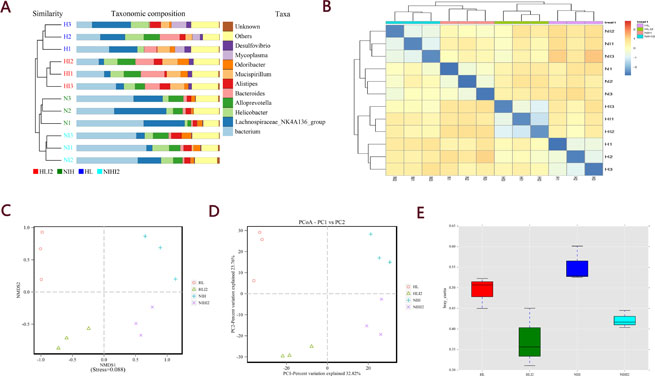
Figure 6: Beta analysis between groups based on the Bray–Curtis algorithm. (A) UPGMA clustering tree and histogram combination drawing. (B) Heatmap. (C) NMDS plot. (D) PCoA plot. (E) Beta diversity box plot.
By comparing the representative sequence of OTUs with the microbial reference database, each OTU can be classified into a species. Simultaneously, the community composition of each sample was calculated at various taxonomic levels (phylum, class, order, family, genus, and species), and species-abundance tables at different classification levels were generated using QIIME software. The community structure of samples under different taxonomic levels was drawn using R language tools. As shown in Figure 7A–7B, the phylum-level analysis demonstrated that mice infected with L. monocytogenes showed a significantly decreased relative abundance of bacteria belonging to the Firmicutes phylum and an increased relative abundance of bacteria belonging to the Bacteroidetes phylum. Family-level analysis was performed to further study differences among each sample. As shown in Figure 7D–7E, the relative abundances of bacteria belonging to the Lachnospiraceae family decreased after infection, and the relative abundance of bacteria belonging to the Bacteroidales order decreased in HL mice (including HL normal and infected mice), as compared with that in NIH mice. Clustering of three samples in each group was consistent (Figure 7C, 7F).
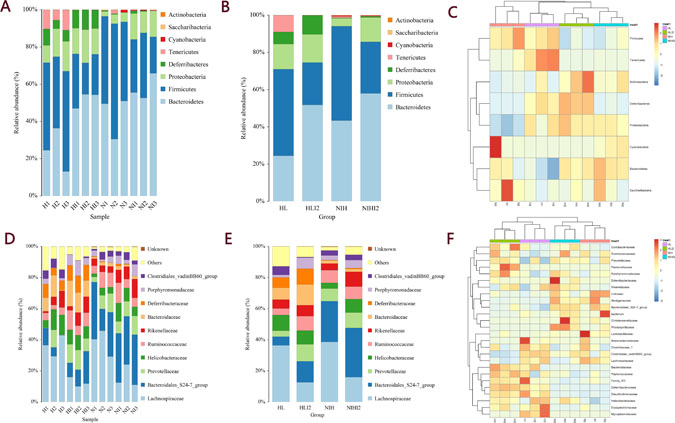
Figure 7: The community composition of each sample was calculated at various levels. (A) Species-distribution histogram of different samples in a phylum. (B) Species-distribution histogram of different groups in a phylum. (C) The species abundance-clustering image in a phylum. (D) Species-distribution histogram of different samples in a family. (E) Species-distribution histogram of different groups in a family. (F) Species-abundance clustering image at the family level.
The line discriminant analysis (LDA) effect size method was used to identify high-dimensional biomarkers in the intestinal microbiota among each group. The LDA score was set at 4.0, and different species for which the LDA score was >4 were considered significant biomarkers. The LDA value results were showed in Supplementary Table 2. The cladogram is shown in Figure 8A and LDA score distribution map is shown in Figure 8B. As shown in Figure 8C–8F, mice infected with L. monocytogenes showed an increase in the number of bacteria belonging to the Rikenellaceae family and Gammaproteobacteria class, and a decrease in bacteria belonging to the Clostridiales class and Lachnospiraceae family. Bacteria belonging to the Mucispirillum and Desulfovibrio genera were more highly abundant in HL mice (including HL normal and infected mice) than in NIH mice (Figure 8G, 8H). The Mycoplasma genus was present only in HL mice (Figure 8I), while the Pasteurella genus was present only in HL-infected mice (Figure 8J). Collectively, these results indicated that mice infected with L. monocytogenes can undergo changes in the intestinal microbiota composition. Changes in the abundance of these bacteria may alter lesion damages in the viscera. Raw data of our research was showed in Supplementary Table 3.
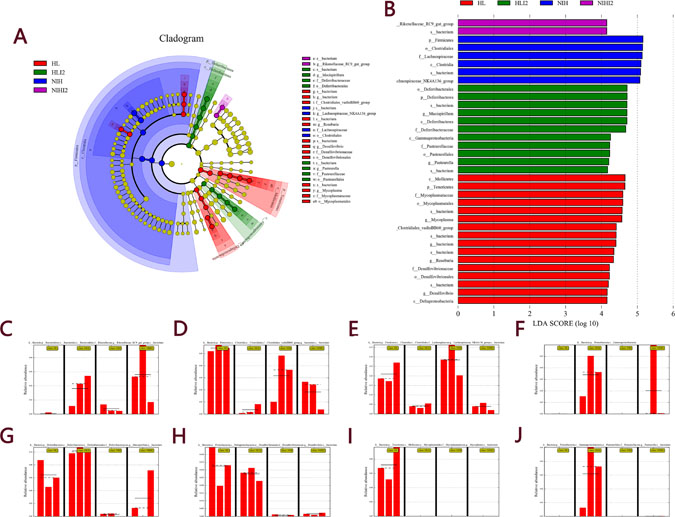
Figure 8: LEfSe analysis of the four groups. (A) Cladogram of the four groups. (B) LDA score histogram. The relative abundance of (C) Rikenellaceae, (D) Clostridiales, (E) Lachnospiraceae, (F) Gammaproteobacteria, (G) Mucispirillum, (H) Desulfovibrio, (I) Mycoplasma, and (J) Pasteurella. Solid and dashed lines indicate mean and median, respectively.
DISCUSSION
Abnormalities in hair growth and hair follicle development in mutant mice are often accompanied by modulations in immunity [16, 17]. In this study, we used an L. monocytogenes infection model to evaluate the innate immunity of mutant mice. Previous data have shown that, compared to oral administration, the i.v. or i.p. administration of mice with a lethal dose of L. monocytogenes is 10–100 times more effective in causing infection [18]. Showing a marked tolerance, the situation with L. monocytogenes infection in humans is significantly different [5]. Studies have shown that fecal transplantation does not transfer either susceptibility or resistance to food-borne listeriosis in C57BL/6 and BALB/c/By mice [19]. Thus, depending on the habit of mice of eating excrement, the gut microbiota of two types of mice should converge after feeding in the same cage for 3–4 weeks [10, 11]. The four groups of mice were infected with L. monocytogenes at a density of 2 × 10⁶ cfu. The innate immunity of NIH HL mice and the impact of gut microbial polymorphisms on L. monocytogenes infection were analyzed based on bacterial loads, histopathological lesions, and cytokine-expression levels.
The results showed that mutant HL mice are more susceptible to L. monocytogenes infection than NIH mice. Co-housing did not have a major impact on mice in terms of weight changes and survival. The liver and spleen are susceptible to L. monocytogenes infection. To investigate the infiltration of inflammatory cells, H&E- and Masson-stained liver and spleen sections of mice from all four groups were assessed. Consistent with previous results, inflammatory infiltration was obvious in the livers of HL mice compared to that in the livers of NIH mice, and the spleen tissues were severely damaged. Because the severity of infection in HL mice at the 2 × 10⁶ cfu challenge dose confounded our ability to quantify the bacterial burden, and previous studies have shown that a peak bacillary burden is noted in the spleen and liver 3 days after infection [20], the density of microbial inoculum was decreased to 1 × 10⁶ cfu to study the bacterial load. Our results showed that the bacterial burden in the spleen of HL and NIH mice was not significantly different after co-housing. Through analyses of bacterial loads and histopathological lesions, we found that changes in the gut microbiota after co-housing can partially relieve the spleen injury.
Monocytes and neutrophils play important roles in early host defense responses against microbial pathogens [11, 21–23]. We used an automated hematology analyzer to analyze the quantity and proportion of monocytes and neutrophils. In normal mice, the levels of both cell types were similar. However, after two days of infection, the number of monocytes and their proportion in white blood cells were significantly lower in HL mice than in NIH mice. This finding suggests that the decrease in monocytes may lead to increased susceptibility of HL mice to L. monocytogenes infection, compared to NIH mice. That the proportion of neutrophils in white blood cells increased may be due to the decrease in white blood cells. Gene mutations in HL mice (for example, mutations in the Hc gene) may block mRNA translation, resulting in inconsistent expression of inflammatory cytokines and proteins [5]. Further studies are required to confirm this possibility.
Mice infected with L. monocytogenes showed induction in bacteria belonging to the Rikenellaceae family and Gammaproteobacteria class, and decreased bacteria belonging to the Clostridiales class and Lachnospiraceae family. Studies have shown that bacteria belonging to the Rikenellaceae family increase in mice with acute liver failure [24]. Bacteria belonging to the Gammaproteobacteria class are dominant in aquatic environments, closely related to glucose metabolism and body health, but are not present in HL and NIH normal mice [25, 26]. The Lachnospiraceae family is related to glucose metabolism and its occurrence is decreased in obese mice [27]. The Clostridiales class can inhibit L. monocytogenes infection [28]. Reduced levels of uncultured Clostridiales are considered a signature of a compromised gut [29, 30]. Substantial reduction of Clostridiales in HL-infected mice may cause a serious infection. These findings indicate that changes in relative abundances of these bacteria not only result from L. monocytogenes infection, but were also the major cause of severe infection and death in infected mice.
In conclusion, our results showed that HL mice are more susceptible to L. monocytogenes than NIH mice. Mice infected with L. monocytogenes showed changes in the intestinal microbiota composition. The change in abundance of these bacteria may alter lesion damage in the viscera. In addition, we found that the Mycoplasma genus is a biomarker of HL mice, and the Mucispirillum and Desulfovibrio genera were more abundant in HL mice than in NIH mice.
MATERIALS AND METHODS
Ethics statement
Investigation has been conducted in accordance with the ethical standards according to national and international guidelines and has been approved by the authors’ institutional review board. Specifically, the animal experiments were performed in accordance with the requirements of the Experimental Animal Ethics and Welfare guidelines (Permit Number: 20160205).
Animals and bacterial strains
Specific pathogen free-grade female NIH HL mice and normal NIH mice (2 or 6 weeks old) were provided by the Changchun Institute of Biological Products Co. Ltd. (SCXK-2016-0008). Two-week-old female NIH HL mice were co-housed with 2-week-old female NIH normal mice for 4 weeks. The bacterial strain used in this study was L. monocytogenes 10403S (serotype 1/2a). L. monocytogenes was cultured in brain heart infusion medium (Oxoid, Hampshire, England) and incubated in a shaker incubator at 37°C and 200 rpm.
In vivo infection experiments
Animals were divided into four groups (HL, NIH, HL-co-housed with NIH, and NIH-co-housed with HL). Mice were infected (i.p.) with L. monocytogenes at a dose of 2 × 10⁶ cfu, and the animals were weighed and monitored daily for mortality for up to 10 days. Survival was monitored daily for 10 days [11]. Mice were infected with L. monocytogenes at a dose of 1 × 10⁶ cfu (i.p.). Bacterial loads in the liver and spleen were determined on day 3 after infection [31]. The density of bacteria used in subsequent infection experiments was 2 × 10⁶ cfu.
Histopathology
At 72 h post-infection, the liver, spleen, cecum, and colon were collected (n = 3), and paraffin sections were prepared and subjected to H&E and Masson staining. Images were acquired using an optical microscope (Olympus, Tokyo, Japan).
Routine blood examination
At 0, 24, and 48 h post-infection, blood was collected from the orbital venous plexus using a capillary. Peripheral blood (20 μL) was diluted into 1 mL aliquots, which were analyzed with an automated hematology analyzer.
Real-time PCR and ELISA
At 48 h post-infection, the liver and spleen were collected (n = 5). Detailed methods for RNA extraction and gene quantification are available in previous reports [4]. The primer pairs used for q-PCR amplification were listed in Table 1.
Table 1: Sequences of primers used in qPCR
Primer |
Sequence (5′ to 3′) |
Size (bp) |
NCBI Entrez accession number |
|---|---|---|---|
TNF-αF |
CTTCTGTCTACTGAACTTCGGG |
106 bp |
NM_013693 |
TNF-αR |
TGATCTGAGTGTGAGGGTCTG |
||
IL-1βF |
CGGACCCATATGAGCTGAAAG |
135 bp |
NM_008361 |
IL-1βR |
TCTTTCCTTTGAGGCCCAAG |
||
IL-6F |
CAAAGCCAGAGTCCTTCAGAG |
150 bp |
NM_031168 |
IL-6R |
GTCCTTAGCCACTCCTTCTG |
||
Actb (beta-actin)F |
GTGGGAATGGGTCAGAAGG |
149 bp |
NM_007393.4 |
Actb (beta-actin)R |
AGCTCATTGTAGAAGGTGTGG |
The liver and spleen were homogenized with PBS (4 mL/g), and lysates were centrifuged at 4500 × g for 30 min to collect the supernatant. Serum was also collected. ELISAs (Haling Biological, Shanghai, China) were performed to measure the protein-expression levels of inflammatory cytokines.
Gut microbiota analysis
At 48 h post-infection, the cecum content was collected for the gut microbial analysis, and the samples were divided into four groups, namely, NIH normal mice (NIH), HL normal mice (HL), NIH-infected mice (NIHI2), and HL-infected mice (HLI2). Bacterial genomic DNA was extracted from frozen samples stored at −80°C. The V3 and V4 regions of the 16S rRNA gene comprising were amplified by PCR using specific bacterial primers (Table 2). High-throughput pyrosequencing of the PCR products was performed on an Illumina MiSeq platform at Biomarker Technologies Co. Ltd. (China). The raw paired-end reads from the original DNA fragments were merged using FLASH32 and assigned to each sample, according to the unique barcodes. QIIME [32] (version 1.8.0) UCLUST [33] software was used based on 97% sequence similarity. The tags were clustered into OTUs. The alpha diversity index was evaluated using Mothur software (version, v.1.30). To compare the diversity index among samples, the number of sequences contained in each sample was standardized. Analysis treasure included OTU rank, rarefaction, and Shannon curves, and the Shannon, Chao1, Simpson, and ACE indexes were calculated. For beta diversity analysis, heatmaps of RDA-identified key OTUs, PCoA [34], NMDS [35], and UPGMA were obtained using QIIME. The LDA-effect size (LEfSe) method was used for the quantitative analysis of biomarkers in each group. Briefly, LEfSe analysis, an LDA threshold >4, the non-parametric factorial Kruskal–Wallis sum-rank test, and the unpaired Wilcoxon rank-sum test were performed to identify the most differently abundant taxa [36, 37].
Table 2: Sequences of 16S rRNA (V3 + V4) primers
16S rRNA (V3 + V4) primers |
Sequence (5′ to 3′) |
|---|---|
F |
ACTCCTACGGGAGGCAGCA |
R |
GGACTACHVGGGTWTCTAAT |
Statistical analysis
All data are shown as the mean ± SEM. Differences in the survival rates of animals were calculated by the log-rank Mantel–Cox test using GraphPad Prism software. In all other experiments, p values were calculated by the two-tailed Student’s t-test using GraphPad Prism software [11]. When F > 0.05, p values were calculated using the unpaired t-test with Welch’s correction.
Author contributions
W.Z.R. and B.Y. were responsible for the main conception and design of the study; Z.H.J, Y.H, and W.G. performed the experiments; Z.H.J, J.C., J.P.H., and F.S.Q. analyzed the data and contributed reagents; Z.H.J., W.G., B.Y., and W.Z.R. wrote the manuscript; and all authors approved of the final version.
CONFLICTS OF INTEREST
None.
FUNDING
This study was supported by the Key Technology R&D Program (grant numbers 2015BAI07B02 and 20170623032TC).
REFERENCES
1. Herbert Pratt C, Potter CS, Fairfield H, Reinholdt LG, Bergstrom DE, Harris BS, Greenstein I, Dadras SS, Liang BT, Schofield PN, Sundberg JP. Dsp rul: a spontaneous mouse mutation in desmoplakin as a model of Carvajal-Huerta syndrome. Exp Mol Pathol. 2015; 98:164–72.
2. Morifuji M, Oba C, Ichikawa S, Ito K, Kawahata K, Asami Y, Ikegami S, Itoh H, Sugawara T. A novel mechanism for improvement of dry skin by dietary milk phospholipids: effect on epidermal covalently bound ceramides and skin inflammation in hairless mice. J Dermatol Sci. 2015; 78:224–31.
3. Chen J, Yuan B, Zhu T, Cai Y, Hu JP, Gao Y, Gao W, Jiang H, Ren WZ, Zhang JB. Reproductive performance and histological characteristics of select organs in NIH hairless mice. Int J Clin Exp Med. 2016; 9:8925–33.
4. Ji ZH, Chen J, Gao W, Zhang JY, Quan FS, Hu JP, Yuan B, Ren WZ. Cutaneous transcriptome analysis in NIH hairless mice. PLoS One. 2017; 12:e0182463.
5. Lecuit M, Vandormael-Pournin S, Lefort J, Huerre M, Gounon P, Dupuy C, Babinet C, Cossart P. A transgenic model for listeriosis: role of internalin in crossing the intestinal barrier. Science. 2001; 292:1722–25.
6. Garifulin O, Boyartchuk V. Listeria monocytogenes as a probe of immune function. Brief Funct Genomics Proteomics. 2005; 4:258–69.
7. Gervais F, Stevenson M, Skamene E. Genetic control of resistance to Listeria monocytogenes: regulation of leukocyte inflammatory responses by the Hc locus. J Immunol. 1984; 132:2078–83.
8. Zheng SJ, Wang P, Tsabary G, Chen YH. Critical roles of TRAIL in hepatic cell death and hepatic inflammation. J Clin Invest. 2004; 113:58–64.
9. Miyamoto M, Emoto M, Emoto Y, Brinkmann V, Yoshizawa I, Seiler P, Aichele P, Kita E, Kaufmann SH. Neutrophilia in LFA-1-deficient mice confers resistance to listeriosis: possible contribution of granulocyte-colony-stimulating factor and IL-17. J Immunol. 2003; 170:5228–34.
10. Macpherson AJ, Harris NL. Interactions between commensal intestinal bacteria and the immune system. Nat Rev Immunol. 2004; 4:478–85.
11. Anand PK, Malireddi RKS, Lukens JR, Vogel P, Bertin J, Lamkanfi M, Kanneganti TD. NLRP6 negatively regulates innate immunity and host defence against bacterial pathogens. Nature. 2012; 488:389–93.
12. Vaahtovuo J, Toivanen P, Eerola E. Bacterial composition of murine fecal microflora is indigenous and genetically guided. FEMS Microbiol Ecol. 2003; 44:131–36.
13. Skelly DT, Hennessy E, Dansereau MA, Cunningham C. A systematic analysis of the peripheral and CNS effects of systemic LPS, IL-1β, [corrected] TNF-α and IL-6 challenges in C57BL/6 mice. PLoS One. 2013; 8:e69123.
14. Quereda JJ, Dussurget O, Nahori MA, Ghozlane A, Volant S, Dillies MA, Regnault B, Kennedy S, Mondot S, Villoing B, Cossart P, Pizarro-Cerda J. Bacteriocin from epidemic Listeria strains alters the host intestinal microbiota to favor infection. Proc Natl Acad Sci USA. 2016; 113:5706–11.
15. Chen H, Boutros PC. VennDiagram: a package for the generation of highly-customizable Venn and Euler diagrams in R. BMC Bioinformatics. 2011; 12:35.
16. Guillermo RF, Zhang X, Kaushik RS, Zeman D, Ahmed SA, Khalifa S, Fahmy H, Dwivedi C. Dose-response on the chemopreventive effects of sarcophine-diol on UVB-induced skin tumor development in SKH-1 hairless mice. Mar Drugs. 2012; 10:2111–25.
17. Araujo VC, Fukutani KF, Oshiro ET, Rodrigues PO, Rizk YS, Carollo CA, Arruda CC. Hairless mice as an experimental model of infection with Leishmania (Leishmania) amazonensis. Exp Parasitol. 2015; 157:138–44.
18. Czuprynski CJ, Faith NG, Steinberg H. A/J mice are susceptible and C57BL/6 mice are resistant to Listeria monocytogenes infection by intragastric inoculation. Infect Immun. 2003; 71:682–89.
19. Myers-Morales T, Bussell KM, D’Orazio SE. Fecal transplantation does not transfer either susceptibility or resistance to food borne listeriosis in C57BL/6 and BALB/c/By mice. F1000Res. 2013; 2:177.
20. Czuprynski CJ, Faith NG, Steinberg H. Ability of the Listeria monocytogenes strain Scott A to cause systemic infection in mice infected by the intragastric route. Appl Environ Microbiol. 2002; 68:2893–900.
21. Lee SM, Rosen S, Weinstein P, van Rooijen N, Noble-Haeusslein LJ. Prevention of both neutrophil and monocyte recruitment promotes recovery after spinal cord injury. J Neurotrauma. 2011; 28:1893–907.
22. Alard JE, Ortega-Gomez A, Wichapong K, Bongiovanni D, Horckmans M, Megens RT, Leoni G, Ferraro B, Rossaint J, Paulin N, Ng J, Ippel H, Suylen D, et al. Recruitment of classical monocytes can be inhibited by disturbing heteromers of neutrophil HNP1 and platelet CCL5. Sci Transl Med. 2015; 7:317ra196.
23. Bohn AB, Brems-Eskildsen AS, Møller BK, Horsman MR. Uniform Combretastatin-induced Effect on Monocytes and Neutrophils in Peripheral Blood but Not in Tumors. Anticancer Res. 2015; 35:2559–64.
24. Hu YX, Yu L, Liu HJ, Cheng ML. [Changes in the composition of intestinal microbiota in mice with acute liver failure induced by D-galactosamine]. [Article in Chinese]. Zhonghua Gan Zang Bing Za Zhi. 2017; 25:291–296.
25. Leyn SA, Maezato Y, Romine MF, Rodionov DA, and Genomic Reconstruction of Carbohydrate Utilization Capacities in Microbial-Mat Derived Consortia. Genomic Reconstruction of Carbohydrate Utilization Capacities in Microbial-Mat Derived Consortia. Front Microbiol. 2017; 8:1304.
26. Zheng Y, Yu M, Liu J, Qiao Y, Wang L, Li Z, Zhang XH, Yu M. Bacterial Community Associated with Healthy and Diseased Pacific White Shrimp (Litopenaeus vannamei) Larvae and Rearing Water across Different Growth Stages. Front Microbiol. 2017; 8:1362.
27. Horie M, Miura T, Hirakata S, Hosoyama A, Sugino S, Umeno A, Murotomi K, Yoshida Y, Koike T. Comparative analysis of the intestinal flora in type 2 diabetes and nondiabetic mice. Exp Anim. 2017; 66:405–16.
28. Becattini S, Littmann ER, Carter RA, Kim SG, Morjaria SM, Ling L, Gyaltshen Y, Fontana E, Taur Y, Leiner IM, Pamer EG. Commensal microbes provide first line defense against Listeria monocytogenes infection. J Exp Med. 2017; 214:1973–89.
29. Rossen NG, Fuentes S, Boonstra K, D’Haens GR, Heilig HG, Zoetendal EG, de Vos WM, Ponsioen CY. The mucosa-associated microbiota of PSC patients is characterized by low diversity and low abundance of uncultured Clostridiales II. J Crohn’s Colitis. 2015; 9:342–48.
30. Wlodarska M, Willing BP, Bravo DM, Finlay BB. Phytonutrient diet supplementation promotes beneficial Clostridia species and intestinal mucus secretion resulting in protection against enteric infection. Sci Rep. 2015; 5:9253.
31. Anand PK, Tait SW, Lamkanfi M, Amer AO, Nunez G, Pagès G, Pouysségur J, McGargill MA, Green DR, Kanneganti TD. TLR2 and RIP2 pathways mediate autophagy of Listeria monocytogenes via extracellular signal-regulated kinase (ERK) activation. J Biol Chem. 2011; 286:42981–91.
32. Caporaso JG, Kuczynski J, Stombaugh J, Bittinger K, Bushman FD, Costello EK, Fierer N, Peña AG, Goodrich JK, Gordon JI, Huttley GA, Kelley ST, Knights D, et al. QIIME allows analysis of high-throughput community sequencing data. Nat Methods. 2010; 7:335–36.
33. Edgar RC. Search and clustering orders of magnitude faster than BLAST. Bioinformatics. 2010; 26:2460–61.
34. Sakaki T, Takeshima T, Tominaga M, Hashimoto H, Kawaguchi S. Recurrence of ICA-PCoA aneurysms after neck clipping. J Neurosurg. 1994; 80:58–63.
35. Looft T, Johnson TA, Allen HK, Bayles DO, Alt DP, Stedtfeld RD, Sul WJ, Stedtfeld TM, Chai B, Cole JR, Hashsham SA, Tiedje JM, Stanton TB. In-feed antibiotic effects on the swine intestinal microbiome. Proc Natl Acad Sci USA. 2012; 109:1691–96.
36. Segata N, Izard J, Waldron L, Gevers D, Miropolsky L, Garrett WS, Huttenhower C. Metagenomic biomarker discovery and explanation. Genome Biol. 2011; 12:R60.
37. Parks DH, Tyson GW, Hugenholtz P, Beiko RG. STAMP: statistical analysis of taxonomic and functional profiles. Bioinformatics. 2014; 30:3123–24.