
INTRODUCTION
Phosphatase and tensin homolog (PTEN) is also known as mutated in multiple advanced cancers 1 (MMAC1) or TGF-β regulated and epithelial cell-enriched phosphatase 1 (TEP1) and is a tumor suppressor gene [1-3]. It is located on human chromosome 10q23 and encodes a 403 amino acid protein that is associated with lipid and protein associated phosphoinositide 3-phosphatase activity. PTEN is generally cytosolic and regulates phosphatidylinositol 3,4,5-trisphosphate (PIP3) levels; small fraction of PTEN is recruited to the plasma membrane [4]. PTEN reduces PIP3 levels [5], which decreases mTOR/AKT signaling pathway that is critical for cancer cell growth, survival and progression [6, 7].
Single-nucleotide polymorphisms (SNPs) are the most common type of genetic variations that involve change in a single nucleotide in a gene or associated genetic elements, which affect gene expression [8]. A number of SNPs have been implicated in various human diseases [9-13] and are clinically relevant as factors that determine cancer susceptibility, prognosis of survival, and treatment response [8]. A number of SNPs, mutations and deletions in PTEN have been reported in many human cancers including glioblastoma [14-19].
The relationship between cancer risk and two PTEN SNPs, rs701848 and rs2735343 is controversial. The rs701848 SNP is associated with increased risk of breast cancer (BC) [20], renal cell cancer (RCC) [21], colorectal cancer (CRC) [22], and esophageal squamous cell cancer (ESCC) [23]. However, there are contradictory reports that show no correlation between rs701848 and the risk of ESCC [24] and hepatocellular carcinoma (HCC) [25]. Moreover, rs2735343 is associated with increased breast cancer risk in early onset and familial cases [26]. Subjects with rs2735343 (GG) are associated with elevated risk of ESCC [23]. However, there is no association between rs2735343 (G/C) and the risk of endometrial cancer [27]. In this meta-analysis, we estimated the association between cancer susceptibility and the PTEN SNPs, rs701848 and rs2735343.
RESULTS
Literature search and eligibility criteria
We searched the PubMed, EMBASE, Cochrane library and the national knowledge infrastructure of China (CNKI) databases and identified 1230 articles. After removing the duplicate articles, 892 articles still remained for further evaluation. Then, we reviewed article titles and abstracts and excluded 839 reports that were not related to cancer risk and PTEN SNPs. We then assessed the remaining 53 reports in greater detail and excluded 35 articles that did not satisfy the eligibility criteria. Finally, 18 eligible case-control studies were included in our meta-analysis [20-37] (Figure 1, Table 1). Moreover, we analyzed the data of each SNP independently in studies that investigated both rs701848 and rs2735343 SNPs [23, 24, 32, 33]. Overall, we analyzed 5458 cases and 6003 controls for rs701848 in 14 studies as well as 5490 cases and 6209 controls for rs2735343 in 8 studies.
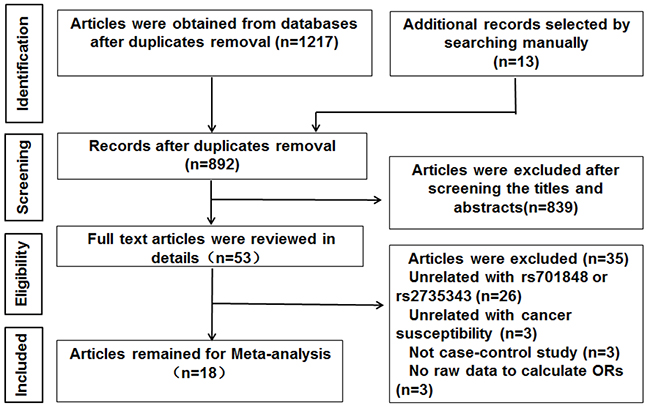
Figure 1: Flow diagram of study selection process.
Table 1: Characteristics of studies on the associations between rs701848(C/T) and rs2735343(C/G) polymorphisms in PTEN and cancer
Author |
Year |
Country |
Ethnicity |
Cancer type |
Genotyping method |
Source of controls |
P value for HWE q |
Case/control |
Frequency distributions of the genotypes |
|||||
|---|---|---|---|---|---|---|---|---|---|---|---|---|---|---|
Case (n) |
Control (n) |
|||||||||||||
rs701848 |
TT |
TC |
CC |
TT |
TC |
CC |
||||||||
Li |
2017 |
China |
Asian |
BC c |
TaqMan l |
HB ° |
0.22559 |
880/910 |
215 |
468 |
197 |
273 |
474 |
163 |
Lin |
2015 |
China |
Asian |
CRC d |
TaqMan |
HB |
0.32525 |
780/764 |
186 |
421 |
173 |
229 |
397 |
138 |
Xu |
2015 |
China |
Asian |
ESCC e |
TaqMan |
PB p |
0.19999 |
425/446 |
205 |
182 |
38 |
243 |
182 |
21 |
Jing |
2014 |
China |
Asian |
CRC |
SNPscan m |
PB |
0.26281 |
519/537 |
190 |
253 |
94 |
162 |
272 |
85 |
Jang |
2013 |
China |
Asian |
ESCC |
PCR-RFLP n |
PB |
0.0306 |
304/413 |
91 |
155 |
58 |
183 |
165 |
65 |
Ma |
2012 |
China |
Asian |
ESCC |
PCR-RFLP |
PB |
0.20173 |
226/226 |
70 |
121 |
35 |
103 |
90 |
33 |
Cao |
2012 |
China |
Asian |
RCC f |
TaqMan |
HB |
0.52099 |
710/760 |
222 |
338 |
150 |
277 |
351 |
132 |
Chen |
2012 |
China |
Asian |
PC g |
TaqMan |
HB |
0.81281 |
666/708 |
212 |
329 |
125 |
235 |
353 |
120 |
Ding |
2011 |
China |
Asian |
HCC h |
PCR-RFLP |
PB |
0.32694 |
131/215 |
43 |
67 |
21 |
65 |
116 |
34 |
Hiroshi |
2009 |
Japan |
Asian |
PC |
PCR-RFLP |
HB |
0.51513 |
140/167 |
51 |
58 |
31 |
47 |
90 |
30 |
Song |
2009 |
China |
Asian |
LC i |
PCR-RFLP |
HB |
0.92453 |
149/104 |
46 |
74 |
29 |
26 |
54 |
24 |
Liu |
2009 |
China |
Asian |
GC j |
PCR-RFLP |
HB |
0.92453 |
58/104 |
17 |
35 |
6 |
24 |
54 |
26 |
Liu |
2008 |
China |
Asian |
LC |
PCR-RFLP |
HB |
0.92453 |
91/104 |
29 |
45 |
17 |
26 |
54 |
24 |
Rajaraman |
2007 |
American |
Mixed-race a |
Glioma |
TaqMan |
HB |
0.98643 |
379/545 |
138 |
184 |
57 |
190 |
262 |
93 |
rs2735343 |
GG |
GC |
CC |
GG |
GC |
CC |
||||||||
Chen |
2016 |
China |
Asian |
BC |
SNPscan |
HB |
0.53023 |
728/669 |
190 |
360 |
178 |
142 |
348 |
179 |
Jang |
2013 |
China |
Asian |
ESCC |
PCR-RFLP |
PB |
0.07336 |
304/413 |
108 |
151 |
45 |
93 |
181 |
139 |
Ma |
2012 |
China |
Asian |
ESCC |
PCR-RFLP |
PB |
0.38422 |
226/226 |
71 |
117 |
38 |
45 |
100 |
81 |
Slattery |
2012 |
Mexico American |
Mixed race b |
BC |
multiplexed bead array assay |
PB |
- |
3590/4183 |
1398 |
2192* |
- |
1491 |
2692* |
- |
Lacey |
2011 |
Poland |
Caucasian |
EC k |
Infinium assay |
PB |
0.47144 |
416/406 |
211 |
163 |
42 |
215 |
154 |
37 |
Song |
2009 |
China |
Asian |
GC |
PCR-RFLP |
HB |
0.51145 |
58/104 |
4 |
33 |
21 |
30 |
57 |
17 |
Shi |
2009 |
China |
Asian |
Lung cancer |
PCR-RFLP |
HB |
0.54184 |
77/104 |
32 |
37 |
8 |
29 |
57 |
18 |
Liu |
2008 |
China |
Asian |
LC |
PCR-RFLP |
HB |
0.54184 |
91/104 |
29 |
46 |
16 |
18 |
57 |
29 |
a Mixed-race consists of White, non-Hispanic, Hispanic, and Black; b Mixed-race consists of Hispanic, native American, and NHW (non-Hispanic white) women; c BC, breast cancer; d CRC, colorectal cancer; e ESCC, esophageal squamous cell carcinoma; f RCC, renal cell carcinoma; g PC, prostate carcinoma; h HCC, hepatocellular carcinoma; i LC, laryngocarcinoma; j GC, gastric cancer; k EC, endometrial cancer ; l TaqMan, TaqMan SNP Genotyping Assays; m SNPscan, SNPscanGenotyping system; n PCR-RFLP, Polymerase chain reaction (PCR)–restriction fragment length polymorphism assays; ° HB, hospital-based; p PB, population-based; q HWE, Hardy-Weinberg equilibrium; * The number of GC/CC is 2192 in cases, 2692 in controls.
Study characteristics
Table 1 summarizes the main characteristics of the included studies such as first author, published year, country of origin where the study was conducted, ethnicity, cancer type, genotyping method, source of controls, and frequency distributions of the genotypes for cases and controls (Table 1). Among the 18 studies, 14 were conducted in China and 1 each in Japan, USA, Poland, and Mexico/USA. Overall, 15 out of 18 studies enrolled Asian subjects, 1 study enrolled Caucasian individuals, and 2 studies enrolled subjects from mixed races. The cancer types that were analyzed in these studies included colorectal cancer (CRC), esophageal squamous cell carcinoma (ESCC), hepatocellular carcinoma (HCC), renal cell carcinoma (RCC), prostate carcinoma (PC), laryngocarcinoma (LC), gastric cancer (GC), breast cancer (BC), glioma, and endometrial cancer (EC). PTEN genotyping was performed by Taqman (6 studies), Polymerase chain reaction–restriction fragment length polymorphism (PCR-RFLP; 8 studies), SNPscan (2 studies), Infinium assay (1 study) and multiplexed bead arrays (1study). Among the 18 studies, 10 were hospital-based (HB) and 8 were public-based (PB). In 16 out of 18 eligible studies, genotype distributions of rs701848 and rs2735343 in the controls were in agreement with Hardy-Weinberg equilibrium (HWE). The P value for Jang’s study [23] was less than 0.05, whereas there was no available data to calculate P value for HWE in Slattery’s study [28]. The genomic DNA was isolated from blood samples in 17 out of 18 included studies, whereas in Slattery’s study [28] whole blood or mouthwash samples were used for isolating genomic DNA. The quality scores according to Newcastle-Ottawa quality assessment scale varied 6 to 9 in the 18 studies (Figure 2, Supplementary Table 1).
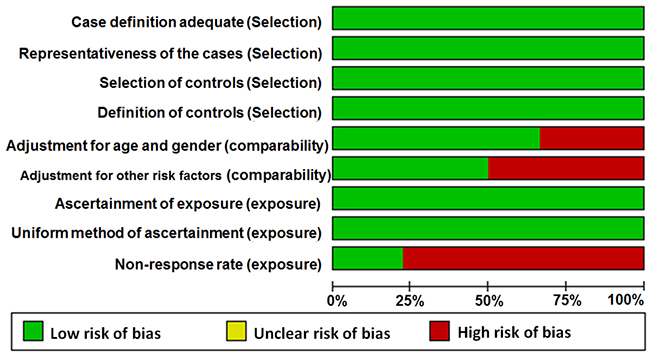
Figure 2: Quality assessment scale of eligible studies.
Association between PTEN SNPs and cancer risk
We analyzed the association between the PTEN SNPs and cancer risk using dominant, recessive, heterozygous, homozygous, and additive models. The rs701848 CC genotype was associated with 1.169-fold increased cancer risk in recessive model (OR = 1.169, 95% CI: 1.061-1.288, Table 2, Figure 3D). However, it was not associated with cancer risk in heterozygous (OR = 1.099, 95% CI: 0.943 - 1.280), homozygous (OR = 1.190, 95% CI: 0.990 - 1.432), dominant (OR = 1.115, 95% CI: 0.959 - 1.297) and additive (OR = 1.088, 95% CI: 0.990 - 1.196) models (Table 2, Figure 3A-3C, 3E). The rs2735343 GG genotype showed increased cancer risk in the dominant model (OR = 0.758, 95% CI: 0.590 - 0.972, Table 2, Figure 4C). The rs2735343 GG polymorphism was not associated with cancer risk in heterozygous (OR = 0.821, 95% CI: 0.625 - 1.079), homozygous (OR = 0.642, 95% CI: 0.349 - 1.180), recessive (OR = 0.711, 95% CI: 0.437 - 1.156), and additive (OR = 0.802, 95% CI: 0.594 - 1.083) models (Table 2, Figure 3A, 3B, 3D, 3E).
Table 2: ORs and 95% CI for cancers and rs701848 or rs2735343 polymorphism in PTEN under different genetic models
Genetic models |
n |
OR (95% CI) |
P (OR) |
Model (method) |
I-square (%) |
P (H) |
P (Begg) |
P (Egger) |
|---|---|---|---|---|---|---|---|---|
rs701848 |
||||||||
Heterozygous model (TC vs TT) |
14 |
1.099(0.943,1.280) |
0.226 |
R |
65.5 |
0.000 |
0.228 |
0.305 |
Homozygous model (CC vs TT) |
14 |
1.190(0.990,1.432) |
0.064 |
R |
57.5 |
0.004 |
0.037 |
0.054 |
Dominant model (TC+CC vs TT) |
14 |
1.115(0.959,1.297) |
0.157 |
R |
68.4 |
0.000 |
0.274 |
0.154 |
Recessive model (CC vs CT+TT) |
14 |
1.169(1.061,1.288) |
0.002 |
F |
29.5 |
0.141 |
0.012 |
0.060 |
Additive (C vs T) |
14 |
1.088(0.990,1.196) |
0.080 |
R |
63.5 |
0.001 |
0.101 |
0.066 |
rs2735343 |
||||||||
Heterozygous model (GC vs GG) |
7 |
0.821(0.625,1.079) |
0.157 |
R |
61.6 |
0.016 |
0.764 |
0.800 |
Homozygous model (CC vs GG) |
7 |
0.642(0.349,1.180) |
0.154 |
R |
87.8 |
0.000 |
0.368 |
0.796 |
Dominant model (GC+CC vs GG) |
8 |
0.758(0.590, 0.972) |
0.029 |
R |
78.5 |
0.000 |
1.000 |
0.614 |
Recessive model (CC vs GC+GG) |
7 |
0.711(0.437,1.156) |
0.169 |
R |
86.6 |
0.000 |
0.548 |
0.974 |
Additive (C vs G) |
7 |
0.802(0.594,1.083) |
0.150 |
R |
89.1 |
0.000 |
0.368 |
0.909 |
OR, odds ratio; CI, confidence intervals; P (OR), P for heterogeneity; P (H), P for heterogeneity; n, number of included studies; R, random-effect model; F, fixed-effect method.
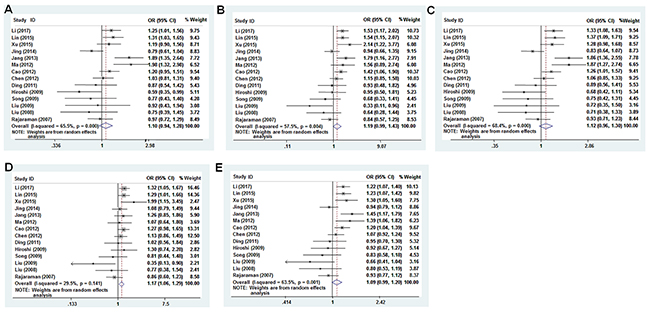
Figure 3: Forest plot of cancer risk associated with rs701848 (T>C) models. (A) heterozygous model; (B) homozygous model; (C) dominant model; (D) recessive model; (E) additive model.
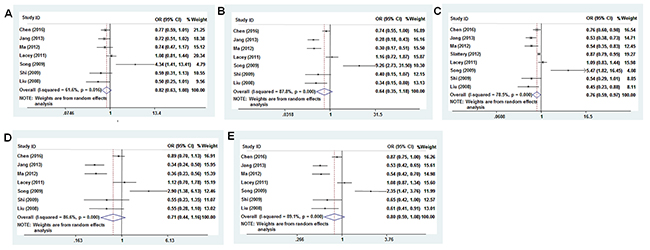
Figure 4: Forest plot of cancer risk associated with rs2735343 (G>C) models. (A) heterozygous model; (B) homozygous model; (C) dominant model; (D) recessive model; (E) additive model.
The pooled odds ratio (OR) for rs701848 polymorphism in recessive model was analyzed by fixed-effects model. Since data was heterogeneous, random effects model was used to analyze the significance of pooled OR for rs701848 in homozygous, heterozygous, dominant, and recessive models and in all models for rs2735343 (Table 2).
Subgroup analysis
We performed subgroup analysis based on ethnicity, cancer type, source of controls, genotyping methods, quality score (at the median cut-off point of 8), and sample size, respectively. We observed that Asian individuals with rs701848 C allele were associated with 1.105-fold increased cancer risk than the non-Asian population (C vs T, OR = 1.105, 95% CI: 1.003 - 1.217, Table 3). The CC genotype showed 1.234-fold and 1.185-fold higher cancer risk respectively in homozygous (CC vs TT, OR = 1.234, 95% CI: 1.024 - 1.488) and recessive (CC vs CT+TT, OR = 1.185, 95% CI: 1.049 - 1.338, Table 3) models in the Asian population. Asian individuals with rs2735343 GG genotype were also associated with increased risk of cancer (Table 4). Regarding cancer types, the rs701848 CC genotype showed 1.813-fold increased ESCC risk than the rs701848 TT genotype (CC vs. TT, OR = 1.813, 95% CI: 1.352 - 2.433, Table 3). There was no association between PTEN SNPs and cancer risk in all models of rs701848 in regard to hospital or public based studies (Table 3).
Table 3: Subgroup analyses of rs701848 polymorphism in PTEN with cancer risk
Subgroups |
TC vs TT |
CC vs TT |
TC+CC vs TT |
CC vs CT+TT |
C vs T |
|||||||||||
|---|---|---|---|---|---|---|---|---|---|---|---|---|---|---|---|---|
N |
OR (95% CI) |
P (OR) |
N |
OR (95% CI) |
P (OR) |
N |
OR (95% CI) |
P (OR) |
N |
OR (95% CI) |
P (OR) |
N |
OR (95% CI) |
P (OR) |
||
Ethnicity |
Asian |
13 |
1.110 (0.942, 1.308) |
0.214 |
13 |
1.234 (1.024, 1.488) |
0.027 |
13 |
1.132 (0.965, 1.329) |
0.128 |
13 |
1.185 (1.049, 1.338) |
0.006 |
13 |
1.105 (1.003, 1.217) |
0.043 |
Non-Asian |
1 |
0.967 (0.724, 1.291) |
0.820 |
1 |
0.844 (0.568, 1.254) |
0.401 |
1 |
0.935 (0.711, 1.229) |
0.628 |
1 |
0.860 (0.601, 1.232) |
0.412 |
1 |
0.928 (0.768, 1.122) |
0.441 |
|
Cancer type |
ESCC |
3 |
1.609 (1.140, 2.272) |
0.007 |
3 |
1.813 (1.352, 2.433) |
0.000 |
3 |
1.612 (1.240, 2.096) |
0.000 |
3 |
1.358 (0.982, 1.880) |
0.065 |
3 |
1.375 (1.206, 1.567) |
0.000 |
Other |
11 |
1.004 (0.874, 1.154) |
0.952 |
11 |
1.077 (0.881, 1.315) |
0.471 |
11 |
1.014 (0.874, 1.176) |
0.855 |
11 |
1.113 (0.972, 1.274) |
0.120 |
11 |
1.026 (0.930, 1.133) |
0.606 |
|
Source of control |
PB |
5 |
1.249 (0.863, 1.808) |
0.238 |
5 |
1.387 (0.983, 1.959) |
0.063 |
5 |
1.270 (0.902, 1.788) |
0.171 |
5 |
1.207 (0.988, 1.476) |
0.066 |
5 |
1.187 (0.979, 1.438) |
0.081 |
HB |
9 |
1.060 (0.919, 1.222) |
0.425 |
9 |
1.097 (0.870, 1.383) |
0.433 |
9 |
1.060 (0.905, 1.242) |
0.470 |
9 |
1.106 (0.938, 1.304) |
0.229 |
9 |
1.043 (0.933, 1.166) |
0.461 |
|
Genotyping |
mic-Array |
7 |
1.103 (0.972, 1.252) |
0.129 |
7 |
1.293 (1.061, 1.576) |
0.011 |
7 |
1.144 (0.997, 1.314) |
0.056 |
7 |
1.214 (1.065, 1.384) |
0.004 |
7 |
1.123 (1.023, 1.232) |
0.015 |
PCR-RFLP |
7 |
1.040 (0.698, 1.552) |
0.846 |
7 |
0.964 (0.648, 1.435) |
0.857 |
7 |
1.013 (0.691, 1.484) |
0.948 |
7 |
0.986 (0.766, 1.270) |
0.913 |
7 |
0.996 (0.795, 1.248) |
0.973 |
|
Sample size |
<500 |
6 |
0.924 (0.614, 1.391) |
0.706 |
6 |
0.852 (0.583, 1.246) |
0.409 |
6 |
0.900 (0.617, 1.314) |
0.586 |
6 |
0.912 (0.683, 1.218) |
0.532 |
6 |
0.928 (0.751, 1.148) |
0.493 |
≥500 |
8 |
1.161 (0.996, 1.354) |
0.057 |
8 |
1.337 (1.109, 1.613) |
0.002 |
8 |
1.202 (1.029, 1.403) |
0.020 |
8 |
1.219 (1.085, 1.369) |
0.001 |
8 |
1.151 (1.046, 1.267) |
0.004 |
|
Quality score |
<8 |
6 |
0.920 (0.720, 1.176) |
0.506 |
6 |
0.851 (0.565, 1.281) |
0.439 |
6 |
0.897 (0.687, 1.171) |
0.425 |
6 |
0.936 (0.684, 1.280) |
0.678 |
6 |
0.923 (0.762, 1.117) |
0.410 |
≥8 |
8 |
1.213 (0.996, 1.478) |
0.054 |
8 |
1.367 (1.142, 1.636) |
0.001 |
8 |
1.248 (1.038, 1.501) |
0.018 |
8 |
1.225 (1.087, 1.380) |
0.001 |
8 |
1.175 (1.061, 1.300) |
0.002 |
|
Table 4: Subgroup analyses of rs2735343 polymorphism in PTEN with cancer risk
Subgroups |
GC vs GG |
CC vs GG |
GC+CC vs GG |
CC vs GC+GG |
C vs G |
|||||||||||
|---|---|---|---|---|---|---|---|---|---|---|---|---|---|---|---|---|
N |
OR (95% CI) |
P (OR) |
N |
OR (95% CI) |
P (OR) |
N |
OR (95% CI) |
P (OR) |
N |
OR (95% CI) |
P (OR) |
N |
OR (95% CI) |
P (OR) |
||
Ethnicity |
Asian |
6 |
0.765 (0.565, 1.036) |
0.083 |
6 |
0.577 (0.292, 1.139) |
0.113 |
6 |
0.684 (0.468, 1.001) |
0.050 |
6 |
0.658 (0.379, 1.141) |
0.136 |
6 |
0.760 (0.543, 1.064) |
0.110 |
Non-Asian |
1 |
1.079 (0.806, 1.443) |
0.611 |
1 |
1.157 (0.715, 1.871) |
0.553 |
2 |
0.939 (0.758, 1.162) |
0.562 |
1 |
1.120 (0.704, 1.782) |
0.633 |
1 |
1.081 (0.874,1.339) |
0.472 |
|
Source of control |
PB |
3 |
0.855 (0.645, 1.134) |
0.278 |
3 |
0.458 (0.183, 1.148) |
0.096 |
4 |
0.749 (0.559, 1.005) |
0.054 |
3 |
0.514 (0.248, 1.063) |
0.072 |
3 |
0.676 (0.417, 1.095) |
0.112 |
HB |
4 |
0.853 (0.470, 1.550) |
0.603 |
4 |
0.902 (0.325, 2.507) |
0.843 |
4 |
0.868 (0.439, 1.714) |
0.683 |
4 |
0.944 (0.510, 1.748) |
0.855 |
4 |
0.932 (0.586, 1.481) |
0.765 |
|
Genotyping |
mic-Array |
2 |
0.908 (0.655, 1.257) |
0.560 |
2 |
0.889 (0.581, 1.362) |
0.590 |
3 |
0.884 (0.758, 1.030) |
0.115 |
2 |
0.931 (0.752, 1.153) |
0.511 |
2 |
0.955 (0.769, 1.185) |
0.673 |
PCR-RFLP |
5 |
0.788 (0.508, 1.222) |
0.287 |
5 |
0.561 (0.235, 1.336) |
0.192 |
5 |
0.691 (0.412, 1.158) |
0.161 |
5 |
0.617 (0.314, 1.212) |
0.161 |
5 |
0.744 (0.482, 1.147) |
0.181 |
|
Sample size |
<500 |
4 |
0.861 (0.443, 1.677) |
0.661 |
4 |
0.724 (0.203, 2.580) |
0.619 |
4 |
0.808 (0.372, 1.758) |
0.591 |
4 |
0.739 (0.297, 1.836) |
0.515 |
4 |
0.827 (0.453, 1.510) |
0.537 |
≥500 |
3 |
0.849 (0.666, 1.083) |
0.187 |
3 |
0.620 (0.294, 1.308) |
0.210 |
4 |
0.804 (0.643, 1.005) |
0.055 |
3 |
0.696 (0.358, 1.353) |
0.285 |
3 |
0.791 (0.542, 1.154) |
0.224 |
|
Quality score |
<8 |
4 |
0.853 (0.470, 1.550) |
0.603 |
4 |
0.902 (0.325, 2.507) |
0.843 |
4 |
0.868 (0.439, 1.714) |
0.683 |
4 |
0.944 (0.510, 1.748) |
0.855 |
4 |
0.932 (0.586, 1.481) |
0.765 |
≥8 |
3 |
0.855 (0.645, 1.134) |
0.278 |
3 |
0.458 (0.183, 1.148) |
0.096 |
4 |
0.749 (0.559, 1.005) |
0.054 |
3 |
0.514 (0.248, 1.063) |
0.072 |
3 |
0.676 (0.417, 1.095) |
0.112 |
|
Among the different methods that were used to genotype samples, the mic-array results showed that CC genotype or C allele of rs701848 was associated with increased cancer risk (Table 3). For sample sizes ≥ 500, individuals carrying CC, or combined TC/CC genotypes, or C allele in the rs701848 SNP were associated with increased cancer risk (Table 3). In studies with quality score ≥ 8, we observed association between rs701848 SNP and cancer risk in all models except heterozygous model (Table 3). The results of subgroup analyses by genotyping and sample size showed no significant association between rs2735343 polymorphism in PTEN with cancer risk (Table 4).
Meta-regression analysis
We conducted meta-regression analysis based on ethnicity, cancer type, source of controls, genotyping methods, quality score (at the median cut-off point of 8), and sample size parameters to determine the factors that are critical for association of the PTEN SNPs with cancer risk. The data showed that cancer type determined the association between rs701848 and cancer risk (P < 0.05), indicating that there exists genetic heterogeneity between different cancer types.
Publication bias and sensitivity analysis
We performed Egger’s (Table 2) and Begg’s (Table 2, Figure 5) tests to evaluate potential publication bias. The analysis showed no evidence of publication bias for all genetic models except homozygous and recessive models for rs701848. We conducted sensitivity analysis by Duval and Tweedie trim and fill method, which further confirmed that the results of this meta-analysis were statistically robust (Figure 5).
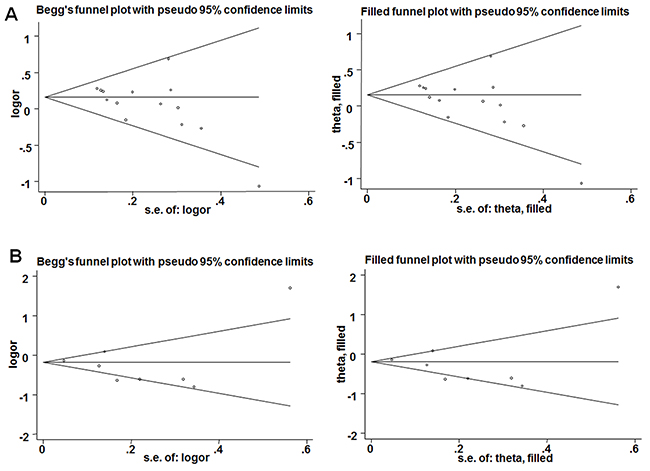
Figure 5: Results of Begg’s tests. (A) Begg’s funnel plots (left) and filled funnel (right) plots for recessive model of rs701848; (B) A. Begg’s funnel plots (left) and filled funnel (right) plots for dominant model of rs2735343.
DISCUSSION
PTEN exerts its tumor suppressor function by acting as a negative regulator of the mTOR/Akt signaling pathway [38]. Mutations in PTEN have been reported as prognostic factors in several cancers [14-17, 19, 39, 40]. Patients with homozygous intron 4 deletion in the PTEN gene are associated with increased risk of digestive tract cancer [41]. PTEN SNPs also play important roles in tumorigenesis. The PTEN rs11202586 SNP is associated with increased risk of testicular germ cell tumor [42]. Han et al showed that the PTEN rs3830675 SNP was associated with colorectal cancer in patients that consumed alcohol and smoked [43]. In this study, we systematically analyzed if rs701848 and rs2735343 SNPs increased cancer susceptibility. Our results indicated that CC genotype or C allele of rs701848 and GG genotype of rs2735343 increased the risk of cancer in Asian subjects.
Both rs701848 and rs2735343 SNPs are located in the intron and non-coding region of PTEN gene and increase cancer risk by probably influencing splicing, protein expression and cell cycle [44]. The rs701848 polymorphism influences cancer susceptibility by altering PTEN expression and reducing PTEN mRNA stability [29]. Although these functional genetic polymorphisms of PTEN were known to participate in tumorigenesis, their relationship with cancer risk was unknown [1-3, 45, 46]. Jang et al [23] and Xu et al [29] showed that C allele of rs701848 was more susceptible than the T allele in developing ESCC. In our study, we investigated 5458 cancer cases and 6003 controls and showed that the CC and CT genotypes or C allele of PTEN rs701848 SNP contributed to ESCC risk, especially, the individuals carrying CC genotype in PTEN rs701848 have a 1.813-fold increased cancer risk of ESCC. Our conclusion was different from Ma’s study that investigated 206 ESCC cases and controls each and concluded that the rs701848 CC genotype was not associated with ESCC risk [24]. We performed subgroup analysis and did not find correlation between rs701848 and increased risk of other cancers [20, 21, 25, 33, 35]. Our results also showed that rs2735343 GG genotype was associated with increased cancer risk supporting Jang’s [23] and Ma’s [24] findings.
Cancer is a genetic disease because the underlying causes include somatic mutations, chromosome translocations, gene amplification, and epigenetic changes [47-49]. A single nucleotide polymorphism (SNP) can be a driver mutation in some cancer types. The accumulation of driver gene mutations are not synchronous and result in cellular heterogeneity within individual tumors [50]. Therefore, genetic heterogeneity is a distinguishing criterion for many cancer types. We comprehensively explored possible origins of heterogeneity by both sub-group and meta-regression analyses and demonstrated that in most genetic models our overall analyses was robust and consistent.
The major drawback of our meta-analysis was that it limited to individuals of Asian descent. Therefore, the effects of rs701848 and rs2735343 on non-Asian populations need to be studied in well-designed and large scale case-control studies. In conclusion, we demonstrate that the C allele of rs701848 and G allele of rs2735343 in PTEN gene increases cancer risk in Asian populations.
MATERIALS AND METHODS
Literature search strategy
This meta-analysis was performed according to the protocols of the Observational Studies in Epidemiology (MOOSE) group [51]. Two researchers, SDD and ZQ, independently searched the PubMed, EMBASE, Cochrane library, and Chinese National Knowledge Infrastructure (CNKI) databases for potentially eligible studies until March 31, 2017 without any language restrictions. The following combination of subjects and words were used for the searches: (“rs701848” or “rs2735343” or “polymorphism” or “variants” or “SNP”) and (“PTEN” or “phosphatase and tensin homolog”) and (“cancer carcinoma” or “tumor” or “tumour” or “cancer” or “cancer neoplasms” or “malignancy”). We excluded articles not meeting our eligibility criteria by screening titles and abstracts. Then, we screened the full text articles manually to identify all published studies that analyzed the relationship of PTEN rs701848 or rs2735343 with cancer risk.
Inclusion criteria
The inclusion criteria for eligible articles were as follows: (1) the articles assessed the association between rs701848 or rs2735343 and cancer risk; (2) it was a case-control study; (3) study subjects diagnosed with malignant tumors were histologically confirmed; (4) sufficient data was available to calculate OR and the corresponding 95% CI. When the data in the articles was insufficient, we attempted to obtain the missing data from the first or corresponding authors via email.
Data extraction and quality assessment
As mentioned above, two reviewers, SDD and LJH independently searched articles, extracted data and assessed the quality. If there was a controversy, a third researcher, ZQ, was involved to resolve the issue by discussion. The extracted data included first author, published year, country of origin, ethnicity, cancer type, genotyping method, characteristics of cases and controls, source of controls, and P value for HWE. The quality of studies was assessed by the Newcastle-Ottawa quality assessment scale for observational studies. The assessment scale had three categories, namely, selection, comparability, and exposure, which altogether contained eight items. A study was awarded a maximum of one point for each parameter within the selection and exposure categories. A maximum of two points were awarded for comparability. The maximum obtainable score was nine.
Statistical analysis
The control group was analyzed by chi-square test and P > 0.05 was in accordance to HWE [52]. The relationship between rs701848 or rs2735343 and cancer risk was analyzed by ORs with 95% CIs in recessive (CC vs. CT+TT), dominant (TC+CC vs. TT), homozygous (CC vs TT), heterozygous (TC vs TT), and additive (C vs. T) models for rs701848 and homozygous (CC vs. GG), heterozygous (GC vs. GG), dominant (GC+CC vs. GG), recessive (CC vs. GC+GG) and additive (C vs G) models for rs2735343, respectively. Raw genotype frequency data was used to calculate the study-specific estimates of the OR without adjustments. The significance of the differences between cancer and study subjects was determined by performing Z test of pooled ORs, and P < 0.05 was considered significant. Heterogeneity analysis was tested among studies using I2 test. A I2 > 50% suggested heterogeneity [53]. A random-effects model was used if there was significant heterogeneity; otherwise, fixed-effect model was chosen for analysis. When there was significant heterogeneity, meta-regression and subgroup analyses were performed according to ethnicity, cancer type, source of controls, genotyping methods, quality score (at the median cut-off point of 8), and sample size [54]. The Taqman, SNPscan, multiplexed bead array, and Infinium methods of genotyping were classified as mic-Array for subgroup-analysis. Sensitivity analysis was assessed by trim and fill method to evaluate the reliability and stability of the meta-analysis results [18]. Publication bias was assessed qualitatively by funnel plots and quantitatively by Begg’s [55] and Egger’s [56] tests, respectively. A P< 0.05 for Begg’s and Egger’s tests indicated significant publication bias. Data were analyzed using STATA 12.0 (Stata Corporation: College Station, TX, USA) and Review Manager 5.3 (Copenhagen: Nordic Cochrane Centre, the Cochrane Collaboration, 2014) software.
CONFLICTS OF INTEREST
The authors declare no conflicts of interest.
FUNDING
This study was supported by the National Natural Science Foundation of China Grant (Nos. 31371321, 81772281), the Shandong Science and Technology Committee (Nos. ZR2016CL09, 2015GSF118073, ZR2014HL056, 2017GSF221011) and Shandong province Taishan Scholar Program.
REFERENCES
1. Li J, Yen C, Liaw D, Podsypanina K, Bose S, Wang SI, Puc J, Miliaresis C, Rodgers L, McCombie R, Bigner SH, Giovanella BC, Ittmann M, et al. PTEN, a putative protein tyrosine phosphatase gene mutated in human brain, breast, and prostate cancer. Science. 1997; 275:1943-1947.
2. Steck PA, Pershouse MA, Jasser SA, Yung WK, Lin H, Ligon AH, Langford LA, Baumgard ML, Hattier T, Davis T, Frye C, Hu R, Swedlund B, et al. Identification of a candidate tumour suppressor gene, MMAC1, at chromosome 10q23.3 that is mutated in multiple advanced cancers. Nat Genet. 1997; 15:356-362.
3. Li DM, Sun H. TEP1, encoded by a candidate tumor suppressor locus, is a novel protein tyrosine phosphatase regulated by transforming growth factor β. Cancer Res. 1997; 57:2124-2129.
4. Yang JM, Schiapparelli P, Nguyen HN, Igarashi A, Zhang Q, Abbadi S, Amzel LM, Sesaki H, Quinones-Hinojosa A, Iijima M. Characterization of PTEN mutations in brain cancer reveals that pten mono-ubiquitination promotes protein stability and nuclear localization. Oncogene. 2017; 36:3673-3685.
5. Worby CA, Dixon JE. Pten. Annu Rev Biochem. 2014; 83:641-669.
6. Chalhoub N, Baker SJ. PTEN and the PI3-kinase pathway in cancer. Annu Rev Pathol. 2009; 4:127-150.
7. Millan-Ucles A, Zuluaga S, Marques M, Vallejo-Diaz J, Sanz L, Cariaga-Martinez AE, Real FX, Carrera AC. E-cadherin downregulation sensitizes PTEN-mutant tumors to PI3Kbeta silencing. Oncotarget. 2016; 7:84054-84071. https://doi.org/10.18632/oncotarget.13414.
8. Srinivasan S, Clements JA, Batra J. Single nucleotide polymorphisms in clinics: fantasy or reality for cancer? Crit Rev Clin Lab Sci. 2016; 53:29-39.
9. Liu LJ, Zhu C, Tian HJ, Zheng TS, Ye MJ, Li H. Correlations of PTEN genetic polymorphisms with the risk of depression and depressive symptoms in a Chinese population. Gene. 2016; 595:77-82.
10. Tang RN, Wu P, An L. NADPH oxidase p22phox C242T polymorphism is associated with macroalbuminuria in diabetic patients: a meta-analysis. J Diabetes Complications. 2017; 31:1207-1211.
11. Hosgood HD 3rd, Menashe I, He X, Chanock S, Lan Q. PTEN identified as important risk factor of chronic obstructive pulmonary disease. Respir Med. 2009; 103:1866-1870.
12. Gharahkhani P, Fitzgerald RC, Vaughan TL, Palles C, Gockel I, Tomlinson I, Buas MF, May A, Gerges C, Anders M, Becker J, Kreuser N, Noder T, et al. Genome-wide association studies in oesophageal adenocarcinoma and Barrett’s oesophagus: a large-scale meta-analysis. Lancet Oncol. 2016; 17:1363-1373.
13. Santos-Reboucas CB, Goncalves AP, Dos Santos JM, Abdala BB, Motta LB, Laks J, de Borges MB, de Rosso AL, Pereira JS, Nicaretta DH, Pimentel MM. rs3851179 polymorphism at 5’ to the PICALM Gene is associated with alzheimer and parkinson diseases in brazilian population. Neuromolecular Med. 2017.
14. Aghi MK, Batchelor TT, Louis DN, Barker FG 2nd, Curry WT Jr. Decreased rate of infection in glioblastoma patients with allelic loss of chromosome 10q. J Neurooncol. 2009; 93:115-120.
15. Abou-Kheir WG, Hynes PG, Martin PL, Pierce R, Kelly K. Characterizing the contribution of stem/progenitor cells to tumorigenesis in the Pten-/-TP53-/- prostate cancer model. Stem Cells. 2010; 28:2129-2140.
16. Bussaglia E, del Rio E, Matias-Guiu X, Prat J. PTEN mutations in endometrial carcinomas: a molecular and clinicopathologic analysis of 38 cases. Hum Pathol. 2000; 31:312-317.
17. Baig RM, Mahjabeen I, Sabir M, Masood N, Hafeez S, Malik FA, Kayani MA. Genetic changes in the PTEN gene and their association with breast cancer in Pakistan. Asian Pac J Cancer Prev. 2011; 12:2773-2778.
18. Duval S, Tweedie R. Trim and fill: a simple funnel-plot-based method of testing and adjusting for publication bias in meta-analysis. Biometrics. 2000; 56:455-463.
19. Cordes I, Kluth M, Zygis D, Rink M, Chun F, Eichelberg C, Dahlem R, Fisch M, Hoppner W, Wagner W, Doh O, Terracciano L, Simon R, et al. PTEN deletions are related to disease progression and unfavourable prognosis in early bladder cancer. Histopathology. 2013; 63:670-677.
20. Li X, Zhang R, Liu Z, Li S, Xu H. The genetic variants in the PTEN/PI3K/AKT pathway predict susceptibility and CE(A)F chemotherapy response to breast cancer and clinical outcomes. Oncotarget. 2017; 8:20252-20265. https://doi.org/10.18632/oncotarget.15690.
21. Cao Q, Ju X, Li P, Meng X, Shao P, Cai H, Wang M, Zhang Z, Qin C, Yin C. A functional variant in the MTOR promoter modulates its expression and is associated with renal cell cancer risk. PLoS One. 2012; 7:e50302.
22. Lin L, Zhang Z, Zhang W, Wang L, Wang J. Roles of genetic variants in the PI3K/PTEN pathways in susceptibility to colorectal carcinoma and clinical outcomes treated with FOLFOX regimen. Int J Clin Exp Pathol. 2015; 8:13314-13322.
23. Jang Y, Lu SA, Chen ZP, Ma J, Xu CQ, Zhang CZ, Wang JJ. Genetic polymorphisms of CCND1 and PTEN in progression of esophageal squamous carcinoma. Genet Mol Res. 2013; 12:6685-6691.
24. Ma J, Zhang J, Ning T, Chen Z, Xu C. Association of genetic polymorphisms in MDM2, PTEN and P53 with risk of esophageal squamous cell carcinoma. J Hum Genet. 2012; 57:261-264.
25. Ding J, Gao Y, Liu R, Xu F, Liu H. Association of PTEN polymorphisms with susceptibility to hepatocellular carcinoma in a Han Chinese population. DNA Cell Biol. 2011; 30:229-234.
26. Chen F, Tang L, Huang J. Association analysis of single-nucleotide polymorphisms in FANCD2-DNA damage repair pathway genes with breast cancer risk. Cancer Research. 2016; 76.
27. Lacey JV Jr, Yang H, Gaudet MM, Dunning A, Lissowska J, Sherman ME, Peplonska B, Brinton LA, Healey CS, Ahmed S, Pharoah P, Easton D, Chanock S, et al. Endometrial cancer and genetic variation in PTEN, PIK3CA, AKT1, MLH1, and MSH2 within a population-based case-control study. Gynecol Oncol. 2011; 120:167-173.
28. Slattery ML, John EM, Torres-Mejia G, Lundgreen A, Herrick JS, Baumgartner KB, Hines LM, Stern MC, Wolff RK. Genetic variation in genes involved in hormones, inflammation and energetic factors and breast cancer risk in an admixed population. Carcinogenesis. 2012; 33:1512-1521.
29. Xu X, Chen G, Wu L, Liu L. Association of genetic polymorphisms in PTEN and additional gene–gene interaction with risk of esophageal squamous cell carcinoma in Chinese Han population. Dis Esophagus. 2016; 29:944-949.
30. Jing F, Mao Y, Zhang Z, Li Y, Cai S, Li Q, Ma X, Jin M, Chen K. The association of phosphatase and tensin homolog deleted on chromosome 10 polymorphisms and lifestyle habits with colorectal cancer risk in a Chinese population. Tumour Biol. 2014; 35:9233-9240.
31. Hirata H, Hinoda Y, Kikuno N, Suehiro Y, Shahryari V, Ahmad AE, Tabatabai ZL, Igawa M, Dahiya R. Bcl2 -938C/A polymorphism carries increased risk of biochemical recurrence after radical prostatectomy. J Urol. 2009; 181:1907-1912.
32. Liu B, Liu Y, Zou JF, Gong HZ, Zhu W. Correlation analysis of PTEN gene single nucleotide polymorphism in laryngocarcinoma. Chin J Cancer Prev Treat. 2008; 15:1695-1697.
33. Song ZX, Liu B, Zhao J, Liu J. Analysis of association between PTEN gene single nucleotide polymorphism and stomach neoplasms. J Jilin Univ Med Ed. 2009; 35:694-697.
34. Song ZX, Zhu W, Li P, Liu B. Association between anti-oncogene PTEN single nucleotide polymorphism and laryngocarcinoma. J Jilin Univ Med Ed. 2009; 35:918-922.
35. Rajaraman P, Wang SS, Rothman N, Brown MM, Black PM, Fine HA, Loeffler JS, Selker RG, Shapiro WR, Chanock SJ, Inskip PD. Polymorphisms in apoptosis and cell cycle control genes and risk of brain tumors in adults. Cancer Epidemiol Biomarkers Prev. 2007; 16:1655-1661.
36. Chen J, Shao P, Cao Q, Li P, Li J, Cai H, Zhu J, Wang M, Zhang Z, Qin C, Yin C. Genetic variations in a PTEN/AKT/mTOR axis and prostate cancer risk in a Chinese population. PLoS One. 2012; 7:e40817.
37. Shi GL, Qing HY, Chen Q. The association between lung cancer and the single nucleotide polymorphisms of PTEN gene. J Mod Oncol. 2009; 5:851-853.
38. Colakoglu T, Yildirim S, Kayaselcuk F, Nursal TZ, Ezer A, Noyan T, Karakayali H, Haberal M. Clinicopathological significance of PTEN loss and the phosphoinositide 3-kinase/Akt pathway in sporadic colorectal neoplasms: is PTEN loss predictor of local recurrence? Am J Surg. 2008; 195:719-725.
39. Ettl T, Baader K, Stiegler C, Muller M, Agaimy A, Zenk J, Kuhnel T, Gosau M, Zeitler K, Schwarz S, Brockhoff G. Loss of PTEN is associated with elevated EGFR and HER2 expression and worse prognosis in salivary gland cancer. Br J Cancer. 2012; 106:719-726.
40. Garcia-Carracedo D, Turk AT, Fine SA, Akhavan N, Tweel BC, Parsons R, Chabot JA, Allendorf JD, Genkinger JM, Remotti HE, Su GH. Loss of PTEN expression is associated with poor prognosis in patients with intraductal papillary mucinous neoplasms of the pancreas. Clin Cancer Res. 2013; 19:6830-6841.
41. Wang Y, Yang H, Luo JI, Ge J. Impact of PTEN IVS4 polymorphism (rs3830675) on cancer susceptibility: an updated meta-analysis. Cancer Genomics Proteomics. 2015; 12:263-269.
42. Andreassen KE, Kristiansen W, Karlsson R, Aschim EL, Dahl O, Fossa SD, Adami HO, Wiklund F, Haugen TB, Grotmol T. Genetic variation in AKT1, PTEN and the 8q24 locus, and the risk of testicular germ cell tumor. Hum Reprod. 2013; 28:1995-2002.
43. Han M, Wu G, Sun P, Nie J, Zhang J, Li Y. Association of genetic polymorphisms in PTEN and additional interaction with alcohol consumption and smoking on colorectal cancer in Chinese population. Int J Clin Exp Med. 2015; 8:21629-21634.
44. George Priya Doss C, Rajith B. A new insight into structural and functional impact of single-nucleotide polymorphisms in PTEN gene. Cell Biochem Biophys. 2013; 66:249-263.
45. Jiang BH, Liu LZ. PI3K/PTEN signaling in angiogenesis and tumorigenesis. Adv Cancer Res. 2009; 102:19-65.
46. Ortega-Molina A, Serrano M. PTEN in cancer, metabolism, and aging. Trends Endocrinol Metab. 2013; 24:184-189.
47. Eden A, Gaudet F, Waghmare A, Jaenisch R. Chromosomal instability and tumors promoted by DNA hypomethylation. Science. 2003; 300:455.
48. Varley JM, McGown G, Thorncroft M, Santibanez-Koref MF, Kelsey AM, Tricker KJ, Evans DG, Birch JM. Germ-line mutations of TP53 in Li-Fraumeni families: an extended study of 39 families. Cancer Res. 1997; 57:3245-3252.
49. Wilson G, Frost L, Goodeve A, Vandenberghe E, Peake I, Reilly J. BCR-ABL transcript with an e19a2 (c3a2) junction in classical chronic myeloid leukemia. Blood. 1997; 89:3064.
50. Stratton MR, Campbell PJ, Futreal PA. The cancer genome. Nature. 2009; 458:719-724.
51. Stroup DF, Berlin JA, Morton SC, Olkin I, Williamson GD, Rennie D, Moher D, Becker BJ, Sipe TA, Thacker SB. Meta-analysis of observational studies in epidemiology: a proposal for reporting. Meta-analysis Of Observational Studies in Epidemiology (MOOSE) group. JAMA. 2000; 283:2008-2012.
52. Rodriguez S, Gaunt TR, Day IN. Hardy-Weinberg equilibrium testing of biological ascertainment for Mendelian randomization studies. Am J Epidemiol. 2009; 169:505-514.
53. Higgins JP, Thompson SG. Quantifying heterogeneity in a meta-analysis. Stat Med. 2002; 21:1539-1558.
54. Li Q, Guan R, Qiao Y, Liu C, He N, Zhang X, Jia X, Sun H, Yu J, Xu L. Association between the BRCA2 rs144848 polymorphism and cancer susceptibility: a meta-analysis. Oncotarget. 2017; 8:39818-39832. https://doi.org/10.18632/oncotarget.16242.
55. Begg CB, Mazumdar M. Operating characteristics of a rank correlation test for publication bias. Biometrics. 1994; 50:1088-1101.
56. Egger M, Davey Smith G, Schneider M, Minder C. Bias in meta-analysis detected by a simple, graphical test. BMJ. 1997; 315:629-634.