
INTRODUCTION
Renal cell carcinoma (RCC) is among the top 10 common cancers diagnosis in both men and women, which involve a heterogeneous group of cancers derived from renal tubular epithelial cells [1]. Approximately 295,000 new cases of RCC were diagnosed worldwide each year, with approximately 134,000 deaths [2, 3]. In the USA, there are approximately 63,000 new cases and approximately 14,000 deaths occur every year [4], with about 84,000 new cases and approximately 35,000 deaths in Europe [5]. There are several treatments available for local RCC, and the most effective method is surgery, followed by chemotherapy and radiotherapy. Nearly half of patients with RCC experienced disease recurrence after radical nephrectomy [6], and 30% of patients with RCC have metastases at the time of the initial diagnosis. Metastatic RCC (mRCC) is a treatment-resistant disease, usually treated with molecular-targeted agents or immune checkpoint blockade, but with limited efficacy [7]. Therefore, it is necessary to find a reliable prognostic biomarkers to distinguish high-risk patients with RCC, and improve the overall clinical outcome of patients.
p53, also known as tumor protein p53, cellular tumor antigen p53, or tumor suppressor p53, functions as a tumor suppressor [8]. p53 plays a role in apoptosis, genomic stability, and anti-angiogenesis. More than half of human tumors contain a mutation in the p53 gene, and p53 has become one of the most studied molecules in science [9, 10]. The degradation of the p53 protein is associated with binding of murine double minute 2 (MDM2). In a negative feedback loop, MDM2 itself is induced by the p53 protein, whereas the mutant p53 protein often fails to induce MDM2, resulting in the accumulation of p53 protein at very high levels. Moreover, the mutant p53 protein itself can inhibit normal p53 protein levels. In some cases, a single missense in p53 has been shown to disrupt the stability and function of p53 [11]. The p53 gene encodes a protein that binds to DNA, which in turn stimulates the expression of p21 protein and interacts with cell division-stimulating protein When p21 is complexed with cell division-stimulating protein, the cell stops the cell division process. Mutant p53 cannot be effectively bound to DNA , and the p21 protein cannot act as the “stop signal” for cell division, which results in tumors formation [12, 13]. It is reported that p53 expression predicts prognosis in various multiple cancer types including breast cancer [14], gastric cancer [15], multiple myeloma [16], colorectal cancer [17], cervical cancer [18], and oral cancer [19]. Many studies have investigated the prognostic role of p53 expression in RCC, but the results are conflicting [20–41]. Therefore, we conducted a comprehensive analysis to evaluate the prognostic and clinicalpathological value of p53 expression in patients with RCC.
RESULTS
Features of included studies
A total of 888 potentially relevant studies were identified through systematic literature searches. After title and/or abstracts screening, 47 articles remained for full-text assessment. Then 25 articles were excluded (lacked key information). Finally, 22 studies [20–41] published from 1994 to 2015 with 2,013 patients that met our inclusion criteria were included in the meta-analysis (Figure 1). All studies were retrospective study design and detected p53 expression using IHC. The sample size ranged from 43 to 160. Eleven studies [20, 22, 25, 26, 29, 30, 32, 34–36, 38] were from western countries and eleven other studies [21, 23, 24, 27, 28, 31, 33, 37, 39–41] were from Asia countries. For the prognostic indicator of p53 expression in RCC, 2 articles reported both overall survival (OS) and cancer-specific survival (CSS), 13 articles reported OS, and seven articles reported CSS. Summary characteristics of these studies are shown in Supplementary Table 1.
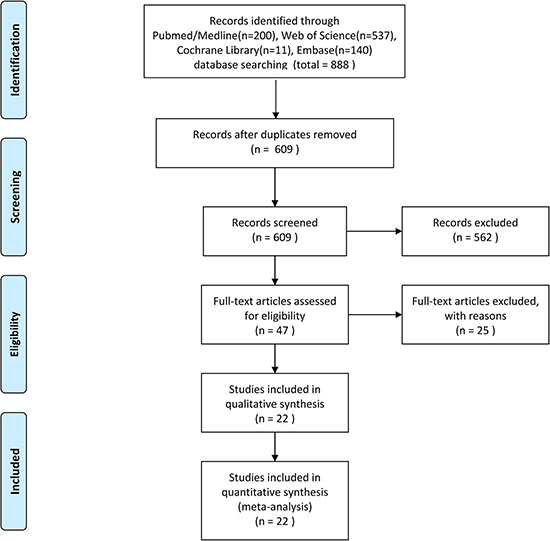
Figure 1: Flow diagram of the study selection process.
Prognostic value of p53 expression for OS and CSS
The association between p53 expression and prognosis for OS and CSS in patients with RCC were estimated, the results of pooled hazard ratio (HR) and 95% confidence interval (CI) are shown in Table 1 and Figure 2.Fifteen studies evaluated the relationship between p53 expression and OS in patients with RCC. p53 positive expression was significantly associated with poor OS (HR = 2.17, 95% CI: 1.51–3.13, p < 0.001; I2 = 42.2%, Pheterogeneity = 0.042, Table 1, Figure 2). Subgroup analysis were performed according to HR estimate, nation and pathological types (Table 1). In subgroup analysis, the pooled HRs obtained from Kaplan–Meier curves (n = 6, HR = 2.04, 95% CI: 1.00–4.19, p = 0.052; I2 = 53.6%, Pheterogeneity = 0.056) and extracted directly from studies (n = 8, HR = 2.80, 95% CI: 1.18–6.66, p < 0.001; I2 = 44.6%, Pheterogeneity = 0.081) demonstrating that p53 positive expression was significantly associated with poor OS. With regard to nation, p53 positive expression was significantly correlated with poor OS (n = 5, HR = 4.08, 95% CI: 2.32–7.15, p < 0.001; I2 = 0.0%, Pheterogeneity = 0.042) in Asian patients compared with non-Asian patients (n = 10, HR = 1.68, 95% CI: 1.12–2.52, p = 0.012; I2 = 40%, Pheterogeneity = 0.091).
Table 1: p53 pooled HRs and 95%CIs in meta-analysis for OS and CSS
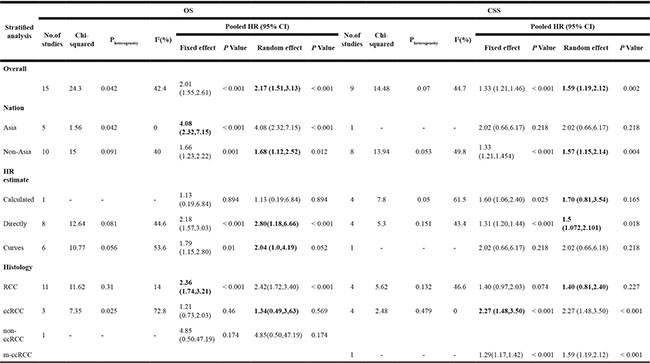
OS: overall survival; CSS: cancer specific survival; HR: hazard ratios; 95%CI: 95% confidence interval.
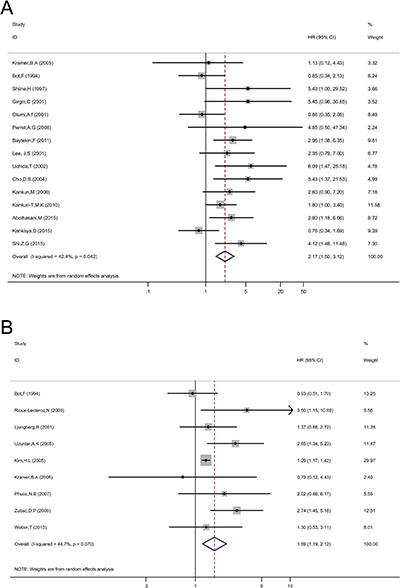
Figure 2: Forest plot HR for the correlation between p53 expression and OS (A) or CSS (B) in a patient with RCC.
Nine studies evaluated the relationship between p53 expression and CSS of patients with RCC. Pooled HR (1.59, 95% CI: 1.19–2.12, p = 0.002; I2 = 44.7%, Pheterogeneity = 0.007, Table 1, Figure 2) showed that p53 positive expression was also associated with poor CSS. p53 expression was also associated with poor CSS (HR = 1.59, 95% CI: 1.19–2.12, p = 0.002; I2 = 44.7%, Pheterogeneity = 0.007, Table 1, Figure 2). In subgroup analysis, the pooled HRs extracted directly from studies (n = 4, HR = 1.50, 95% CI: 1.07–2.10, p = 0.018; I2 = 43.4%, Pheterogeneity = 0.151) and calculated from demographic data (n = 4, HR = 1.70, 95% CI: 0.81–3.54, p = 0.165; I2 = 61.5%, Pheterogeneity = 0.05) demonstrating that p53 expression was significantly associated with poor CSS.
Evaluation of p53 expression and clinicopathological characteristics
To explore the significance of p53 in pathologic diagnosis, we evaluated the correlation between p53 expression and clinicopathological features. The data of primary tumor stage, lymph node metastasis, distant metastasis, tumor node metastasis (TNM) stage, Fuhrman grade, and sex were extracted from the studies, and then the pooled OR and 95% CI were calculated.
As shown in Figure 3 and Table 2. p53 expression was significantly associated with TNM stage (n = 3, III/IV vs. I/II, OR = 2.51, 95% CI: 1.05–6.00), Fuhrman grade (n = 11, 3/4 vs. 1/2, OR = 1.80, 95% CI: 1.24–2.63), and distant metastasis (n = 4, M1 vs. M0, OR = 1.70, 95% CI: 1.16–2.49). However, p53 positive expression was not associated with lymph node metastasis (n = 2, N1 vs. N0, OR = 1.32, 95% CI: 0.80–2.18), primary tumor stage (n = 7, pT3/4 vs. pT1/2, OR = 1.16, 95% CI: 0.88–1.53), and sex (n = 2, male vs. female, OR = 1.09, 95% CI: 0.70–1.68). The results indicated that p53 positive expression in patients with RCC could be considered as a biomarker to diagnose RCC in patients with higher grade, advanced stage, or distant metastasis.
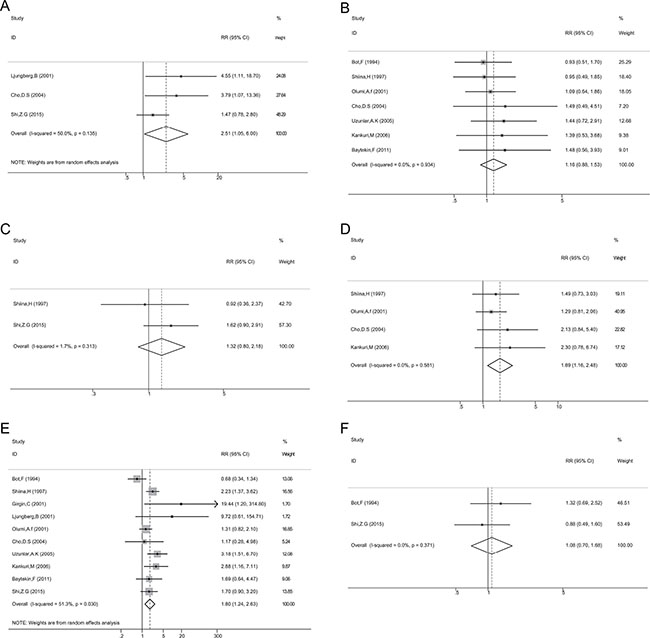
Figure 3: Association between p53 expression and TNM stage (A); primary tumor stage (B); lymph node metastasis (C); distant metastasis (D); Grade (E); Sex (F).
Table 2: Meta analysis of p53 expression and clinicopathological features in renal cell carcinoma
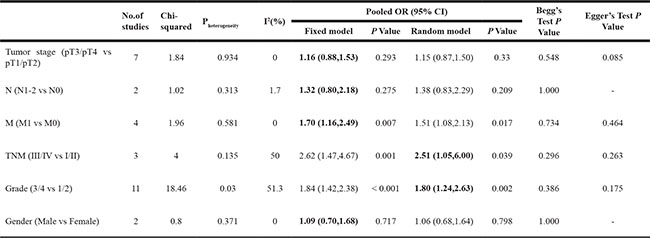
Tumor stage:primary tumor stage; N:lymph node involvement; M:distant metastasis; TNM:TNM stage; 0R:odds ratio; 95%CI:confidence interval.
Publication bias
Begg’s funnel plots and Egger’s test were used to assess the publication bias in this meta-analysis. Funnel plots for meta-analysis of p53 expression and OS and CSS are shown in Figure 4. Both the Begg’s funnel plot test (OS: p = 0.235, CSS: p = 0.917; Figure 4) and the Egger’s test (OS: p = 0.095, CSS: p = 0.203) verified the absence of any obvious publication bias. The funnel plots for clinical features also indicated no obvious publication bias (Table 2).
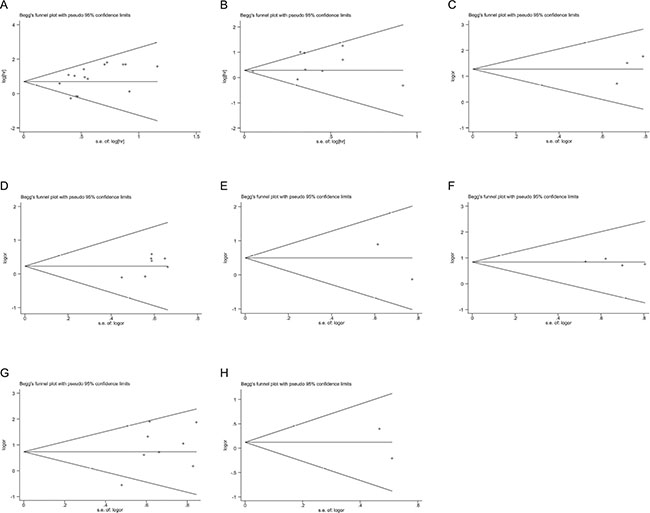
Figure 4: Funnel plots evaluating possible publication bias for OS (A); CSS (B); TNM stage (C); primary tumor stage (D); lymph node involvement (E); distant metastasis (F); grade (G); and sex (H).
Sensitivity analysis
A sensitivity analysis was performed to evaluate the stability of results, and to reduce the effect of the individual studies on final conclusions. The test suggested that for OS, the pooled result did not tend to exhibit alterations when an individual study was excluded (Figure 5). However, for CSS, the study by Kim (2005) had an obvious influence on the pooled result [29]. A more convincing pooled HR and 95% CI (HR = 1.72, 95% CI: 1.30–2.28, Figure 6A) was obtained when these data were excluded. The heterogeneity was decreased slightly (I2 = 35.7%, Pheterogeneity = 0.144). In addition, the results of sensitivity analysis and publication bias no longer changed (Figure 6b, 6C).
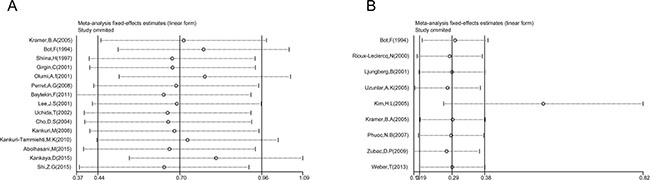
Figure 5: Sensitivity analysis in this meta-analysis. (A) Sensitivity analysis for the p53 expression with OS. (B) Sensitivity analysis for the p53 expression with CSS.
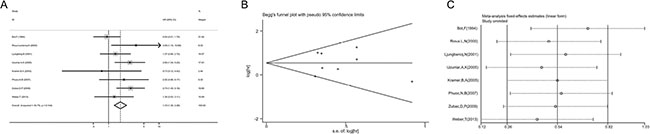
Figure 6: Meta-analysis of CSS following exclusion of data from Kim (2005). (A) Forest plot analysis of CSS. (B) Sensitivity analysis to confirmation of results’ stability. (C) Publication bias to the evaluation of studies’ symmetry.
DISCUSSION
p53 normally functions as a tumor suppressor [8], and p53 mutations exist in more than 50% of human tumors [9, 10]. Mutant p53 proteins usually causes the accumulation of p53 protein at a very high levels, and the mutant p53 protein itself can inhibit normal p53 protein levels [11]. In recent years, several reports have shown that p53 expression can serve as a promising biomarker for predicting various tumors [14–19]. Many studies have also reported the prognostic value of p53 expression in RCC, but the results were still conflicting [20–41]. Therefore, we performed this meta-analysis to explore the association between p53 expression and prognostic value in patients with RCC.
Our analysis mainly reports the prognostic role of p53 expression in RCC. Studies from different countries are included in the meta-analysis. Fixed-effect model and random-effect model were conducted according to the existence of heterogeneity. In this study, we focused on validating p53 immunohistochemical expression and evaluated the prognostic values of p53 expression in RCC. Based on results from 22 studies with 2,003 participants, we concluded that p53 positive expression predicted poor prognostic for patients with RCC. Those RCC patients with p53 positive expression exhibited poor OS and CSS. Subgroup analysis showed that the pooled HRs results obtained from Kaplan–Meier curves and extracted directly from studies demonstrated that p53 expression was significantly associated with poor OS and CSS. The relationship between p53 expression and clinicopathological features was also evaluated. The result suggested that patients with RCC and positive expression of p53 expression were significantly associated with nuclear grade, TNM stage, and distant metastases, but not with lymph node metastasis, primary tumor stage, and sex. To the best of our knowledge, this study is the first comprehensive analysis of the associations between p53 expression and prognostic significance in patients with RCC..
p53 plays a major role in human cancer by regulating the transcription of its downstream target genes [12, 13]. Mutations in p53 genes occur mainly in the DNA-binding domain, and dysfunctional p53 protein is accumulated in tumors [42]. Mutant p53 maybe a drug target for cancer therapy. Small molecule compounds which specifically target mutant p53 have been developed, including compounds that restore wildtype p53 transcriptional activity and reduce mutant p53 levels, which indicate that target mutant p53 may be an effective strategy for cancer therapy [43].
Our results suggested that p53 positive expression was an unfavorable predictor for prognosis in RCC, which was in accordance with conclusions determined from other solid cancer types, such as breast [14], gastric [15], colorectal [17], cervical [18], and oral [19].
We also analyzed the association between p53 expression and clinical factors in RCC, and the results suggested that p53 positive expression was closely related to higher tumor stage and grade, as well as distant metastases, which indicated that p53 had potential to be a dichotomous biomarker.
mRCC is a treatment-resistant malignant tumor, though targeted agents and immune checkpoint blockade have been used for mRCC, but with limited efficacy [7]. The therapeutic strategy of mRCC with p53 positive expression may target mutant p53 to improve clinical outcomes.
There are several limitations should be acknowledged. First, all included studies in this meta-analysis measured p53 expression by immunohistochemistry, but the cut-off criteria to determine the positive or negative expression of p53 and the primary antibodies used for detected p53 expression were inconsistent in different studies, which may potentially contribute to heterogeneity. Therefore, a more unified standard should be defined in the future. Second, the number of patients included in the most eligible studies was relatively small. Therefore, large scale studies are needed to conceive more reliable results. Third, relatively few studies were extracted in some subgroup analyses, which might render premature results. Finally, research with positive results is potentially more likely to be submitted and published than work with negative results, which could cause publication bias, although this bias was not detected in the present analysis [44].
In conclusion, our meta-analysis suggests that p53 expression predicted a poor OS and CSS in patients with RCC. The results also indicate p53 expression was associated with more aggressive clinical features in patients with RCC. More prospective and large scale studies are needed to clarify our results.
MATERIALS AND METHODS
Search strategy and selection criteria
We did this meta-analysis using a predefined protocol in accordance with PRISMA [45]. We searched PubMed, Embase, Web of Science, and the Cochrane electronic databases for studies published before April 14, 2017. The computer-based searches combined terms related to “renal cell carcinoma” or “renal cell cancer” or “renal cell adenocarcinoma” or “kidney tumor” and “p53” and “prognosis” or “survival” or “outcome” in humans; the language of publications was restricted to English.
Two reviewers (WZ and LSG) independently screened the titles and abstracts of all initially identified studies according to the selection criteria. Full-text articles of studies that met all selection criteria were retrieved.
The eligible studies must meet the follow criteria: (1) all patients received a diagnosis of histologically confirmed RCC; (2) the prognostic value of p53 expression for OS and/or CSS were reported; (3) HRs and their 95% CIs for survival analysis were reported in the text or could be computed from given data; (4) the expression of p53 was measured by immunohistochemistry; The exclusion criteria were as follows: abstract, review, case report or comment letter; animal studies; duplicate publications; published not in English.
Data extraction and quality
Two authors (WZ and PSH) independently extracted data and a consensus was reached in case of any inconsistency with the involvement of a third author (CQL). We used a predesigned data extraction form to obtain relevant information. The data extracted from the eligible studies, included the following items: first author, year of publication, country of origin, number of patients, histopathological stage, detection method, cut-off value, antibody for p53 staining, number of positive p53 expression, HR for survival (OS and/or CSS), and follow-up time. For articles that only provided survival data in a Kaplan–Meier curve, software designed by Jayne F Tierney and Matthew R Sydes was used to digitize and extract the OR and its 95% CI [46].
Statistical analysis
Data were analyzed using Stata SE12.0 (Stata Corp LP, College Station, TX, USA). The associations between clinical factors and p53 expression were presented by OR and 95% CI. HR with a 95% CI was computed to reveal the correlation between p53 expression and prognosis (OS and CSS). Interstudy heterogeneity was evaluated using the chi-square test and I2 statistic (100% x [(Q-df)/Q]) [47, 48], the value of Pheterogeneity < 0.1 and I2 > 50% represents significant heterogeneity, and the value of Pheterogeneity > 0.05 and I2 < 25% represents low heterogeneity. A fixed effects model was used when the value of Pheterogeneity > 0.05 and I2 < 25%; otherwise, a random-effects model was applied. Subgroup analysis was performed for OS and CSS analysis. Begg funnel plot and Egger linear regression tests evaluated the potential for publication bias. Two-tailed value of p < 0.05 was considered statistically significant.
CONFLICTS OF INTEREST
No conflicts of interest exist for any authors.
FUNDING
This meta-analysis has been financially supported by the National Natural Science Foundation of China (No. 81472682 and No. 81572538).
REFERENCES
1. Rini BI, Campbell SC, Escudier B. Renal cell carcinoma. Lancet. 2009; 373:1119–32.
2. Torre LA, Bray F, Siegel RL, Ferlay J, Lortet-Tieulent J, Jemal A. Global cancer statistics, 2012. CA Cancer J Clin. 2015; 65:87–108.
3. Fitzmaurice C, Dicker D, Pain A, Hamavid H, Moradi-Lakeh M, MacIntyre MF, Allen C, Hansen G, Woodbrook R, Wolfe C, Hamadeh RR, Moore A, Werdecker A, et al, and Global Burden of Disease Cancer Collaboration. The Global Burden of Cancer 2013. JAMA Oncol. 2015; 1:505–27.
4. Siegel RL, Miller KD, Jemal A. Cancer statistics, 2016. CA Cancer J Clin. 2016; 66:7–30.
5. Ferlay J, Steliarova-Foucher E, Lortet-Tieulent J, Rosso S, Coebergh JW, Comber H, Forman D, Bray F. Cancer incidence and mortality patterns in Europe: estimates for 40 countries in 2012. Eur J Cancer. 2013; 49:1374–403.
6. Janzen NK, Kim HL, Figlin RA, Belldegrun AS. Surveillance after radical or partial nephrectomy for localized renal cell carcinoma and management of recurrent disease. Urol Clin North Am. 2003; 30:843–52.
7. Meskawi M, Sun M, Trinh QD, Bianchi M, Hansen J, Tian Z, Rink M, Ismail S, Shariat SF, Montorsi F, Perrotte P, Karakiewicz PI. A review of integrated staging systems for renal cell carcinoma. Eur Urol. 2012; 62:303–14.
8. Surget S, Khoury MP, Bourdon JC. Uncovering the role of p53 splice variants in human malignancy: a clinical perspective. Onco Targets Ther. 2013; 7:57–68.
9. Hollstein M, Rice K, Greenblatt MS, Soussi T, Fuchs R, Sørlie T, Hovig E, Smith-Sørensen B, Montesano R, Harris CC. Database of p53 gene somatic mutations in human tumors and cell lines. Nucleic Acids Res. 1994; 22:3551–55.
10. Hollstein M, Sidransky D, Vogelstein B, Harris CC. p53 mutations in human cancers. Science. 1991; 253:49–53.
11. Bullock AN, Henckel J, DeDecker BS, Johnson CM, Nikolova PV, Proctor MR, Lane DP, Fersht AR. Thermodynamic stability of wild-type and mutant p53 core domain. Proc Natl Acad Sci USA. 1997; 94:14338–42.
12. National Center for Biotechnology Information (US). Genes and Disease. Bethesda (MD): National Center for Biotechnology Information (US); 1998-. The p53 tumor suppressor protein. Available from: https://www.ncbi.nlm.nih.gov/books/NBK22268/.
13. Lane D, Levine A. p53 Research: the past thirty years and the next thirty years. Cold Spring Harb Perspect Biol. 2010; 2:a000893.
14. Dimas-González J, Maldonado-Lagunas V, Díaz-Chávez J, López-Arellano ME, Muñoz-Camacho J, Terán-Porcayo MA, Lagunas-Martínez A. Overexpression of p53 protein is a marker of poor prognosis in Mexican women with breast cancer. Oncol Rep. 2017; 37:3026–36.
15. Kunizaki M, Fukuda A, Wakata K, Tominaga T, Nonaka T, Miyazaki T, Matsumoto K, Sumida Y, Hidaka S, Yasutake T, Sawai T, Hamamoto R, Nanashima A, Nagayasu T. Clinical Significance of Serum p53 Antibody in the Early Detection and Poor Prognosis of Gastric Cancer. Anticancer Res. 2017; 37:1979–84.
16. Hideshima T, Cottini F, Nozawa Y, Seo HS, Ohguchi H, Samur MK, Cirstea D, Mimura N, Iwasawa Y, Richardson PG, Munshi NC, Chauhan D, Massefski W, et al. p53-related protein kinase confers poor prognosis and represents a novel therapeutic target in multiple myeloma. Blood. 2017; 129:1308–19.
17. Kunizaki M, Sawai T, Takeshita H, Tominaga T, Hidaka S, To K, Miyazaki T, Hamamoto R, Nanashima A, Nagayasu T. Clinical Value of Serum p53 Antibody in the Diagnosis and Prognosis of Colorectal Cancer. Anticancer Res. 2016; 36:4171–75.
18. Freier CP, Stiasny A, Kuhn C, Mayr D, Alexiou C, Janko C, Wiest I, Jeschke U, Kost B. Immunohistochemical Evaluation of the Role of p53 Mutation in Cervical Cancer: Ser-20 p53-Mutant Correlates with Better Prognosis. Anticancer Res. 2016; 36:3131–37.
19. Singh RD, Patel KR, Patel PS. “p53 mutation spectrum and its role in prognosis of oral cancer patients: A study from Gujarat, West India”. Mutat Res. 2016; 783:15–26.
20. Bot FJ, Godschalk JC, Krishnadath KK, van der Kwast TH, Bosman FT. Prognostic factors in renal-cell carcinoma: immunohistochemical detection of p53 protein versus clinico-pathological parameters. Int J Cancer. 1994; 57:634–37.
21. Shiina H, Igawa M, Urakami S, Shirakawa H, Ishibe T, Kawanishi M. Clinical significance of immunohistochemically detectable p53 protein in renal cell carcinoma. Eur Urol. 1997; 31:73–80.
22. Rioux-Leclercq N, Turlin B, Bansard J, Patard J, Manunta A, Moulinoux JP, Guillé F, Ramée MP, Lobel B. Value of immunohistochemical Ki-67 and p53 determinations as predictive factors of outcome in renal cell carcinoma. Urology. 2000; 55:501–05.
23. Girgin C, Tarhan H, Hekimgil M, Sezer A, Gurel G. P53 mutations and other prognostic factors of renal cell carcinoma. Urol Int. 2001; 66:78–83. https://doi.org/10.1159/000056575.
24. Lee JS, Kim HS, Jung JJ, Park CS, Lee MC. Expression of vascular endothelial growth factor in renal cell carcinoma and the relation to angiogenesis and p53 protein expression. J Surg Oncol. 2001; 77:55–60.
25. Ljungberg B, Bozoky B, Kovacs G, Stattin P, Farrelly E, Nylander K, Landberg G. p53 expression in correlation to clinical outcome in patients with renal cell carcinoma. Scand J Urol Nephrol. 2001; 35:15–20.
26. Olumi AF, Weidner N, Presti JC Jr. p53 immunoreactivity correlates with Ki-67 and bcl-2 expression in renal cell carcinoma. Urol Oncol. 2001; 6:63–67.
27. Uchida T, Gao JP, Wang C, Jiang SX, Muramoto M, Satoh T, Minei S, Shimura S, Irie A, Kameya T, Baba S. Clinical significance of p53, mdm2, and bcl-2 proteins in renal cell carcinoma. Urology. 2002; 59:615–20.
28. Cho DS, Joo HJ, Oh DK, Kang JH, Kim YS, Lee KB, Kim SJ. Cyclooxygenase-2 and p53 expression as prognostic indicators in conventional renal cell carcinoma. Yonsei Med J. 2005; 46:133–40.
29. Kim HL, Seligson D, Liu X, Janzen N, Bui MH, Yu H, Shi T, Belldegrun AS, Horvath S, Figlin RA. Using tumor markers to predict the survival of patients with metastatic renal cell carcinoma. J Urol. 2005; 173:1496–501.
30. Kramer BA, Gao X, Davis M, Hall M, Holzbeierlein J, Tawfik O. Prognostic significance of ploidy, MIB-1 proliferation marker, and p53 in renal cell carcinoma. J Am Coll Surg. 2005; 201:565–70.
31. Uzunlar AK, Sahin H, Yilmaz F, Ozekinci S. Expression of p53 oncoprotein and bcl-2 in renal cell carcinoma. Saudi Med J. 2005; 26:37–41.
32. Kankuri M, Söderström KO, Pelliniemi TT, Vahlberg T, Pyrhönen S, Salminen E. The association of immunoreactive p53 and Ki-67 with T-stage, grade, occurrence of metastases and survival in renal cell carcinoma. Anticancer Res. 2006; 26:3825–33.
33. Phuoc NB, Ehara H, Gotoh T, Nakano M, Yokoi S, Deguchi T, Hirose Y. Immunohistochemical analysis with multiple antibodies in search of prognostic markers for clear cell renal cell carcinoma. Urology. 2007; 69:843–48.
34. Perret AG, Clemencon A, Li G, Tostain J, Peoc’h M. Differential expression of prognostic markers in histological subtypes of papillary renal cell carcinoma. BJU Int. 2008; 102:183–87.
35. Zubac DP, Bostad L, Kihl B, Seidal T, Wentzel-Larsen T, Haukaas SA. The expression of thrombospondin-1 and p53 in clear cell renal cell carcinoma: its relationship to angiogenesis, cell proliferation and cancer specific survival. J Urol. 2009; 182:2144–49.
36. Kankuri-Tammilehto MK, Söderström KO, Pelliniemi TT, Vahlberg T, Pyrhönen SO, Salminen EK. Prognostic evaluation of COX-2 expression in renal cell carcinoma. Anticancer Res. 2010; 30:3023–30.
37. Baytekin F, Tuna B, Mungan U, Aslan G, Yorukoglu K. Significance of P-glycoprotein, p53, and survivin expression in renal cell carcinoma. Urol Oncol. 2011; 29:502–07.
38. Weber T, Meinhardt M, Zastrow S, Wienke A, Fuessel S, Wirth MP. Immunohistochemical analysis of prognostic protein markers for primary localized clear cell renal cell carcinoma. Cancer Invest. 2013; 31:51–59.
39. Abolhasani M, Salarinejad S, Asgari M. P53 and MDM2 Over-expression and Five-year Survival of Kidney Cancer Patients Undergoing Radical Nephrectomy—iranian Experience. Asian Pac J Cancer Prev. 2015; 16:5043–47.
40. Kankaya D, Kiremitci S, Tulunay O, Baltaci S. Gelsolin, NF-κB, and p53 expression in clear cell renal cell carcinoma: impact on outcome. Pathol Res Pract. 2015; 211:505–12.
41. Shi ZG, Li SQ, Li ZJ, Zhu XJ, Xu P, Liu G. Expression of vimentin and survivin in clear cell renal cell carcinoma and correlation with p53. Clin Transl Oncol. 2015; 17:65–73.
42. Rivlin N, Koifman G, Rotter V. p53 orchestrates between normal differentiation and cancer. Semin Cancer Biol. 2015; 32:10–17.
43. Parrales A, Iwakuma T. Targeting Oncogenic Mutant p53 for Cancer Therapy. Front Oncol. 2015; 5:288.
44. Sutton AJ, Song F, Gilbody SM, Abrams KR. Modelling publication bias in meta-analysis: a review. Stat Methods Med Res. 2000; 9:421–45.
45. Liberati A, Altman DG, Tetzlaff J, Mulrow C, Gøtzsche PC, Ioannidis JP, Clarke M, Devereaux PJ, Kleijnen J, Moher D. The PRISMA statement for reporting systematic reviews and meta-analyses of studies that evaluate health care interventions: explanation and elaboration. PLoS Med. 2009; 6:e1000100.
46. Tierney JF, Stewart LA, Ghersi D, Burdett S, Sydes MR. Practical methods for incorporating summary time-to-event data into meta-analysis. Trials. 2007; 8:16.
47. Handoll HH. Systematic reviews on rehabilitation interventions. Arch Phys Med Rehabil. 2006; 87:875.
48. Higgins JP, Thompson SG, Deeks JJ, Altman DG. Measuring inconsistency in meta-analyses. BMJ. 2003; 327:557–60.