
INTRODUCTION
According to WHO data, cancer is the second cause of death which has caused about one-sixth of the death (8.8 million) in 2015 worldwide. Lung cancer is the leading cause of cancer death, which led to 1.69 million people died, accounting for about 19% [1]. In China, there are approximately 600,000 people died because of lung cancer. The morbidity and mortality of lung cancer is the highest in the malignant tumors [2]. The 5-year survival rate of IA stages lung cancer was 70%, but the total rate was only about 15%, and the standardized mortality rates are expected to continue rising [3]. Therefore, improvement of the early diagnosis has great clinical significance for the prevention and treatment of lung cancer.
With the development of gene expression profiling technology and data mining technology, people could obtain and analyze the early molecular events of lung cancer, and thus expected to achieve the secondary prevention of lung cancer [4]. To date, low-dose computed tomography (CT), Auto Fluorescence Bronchoscope and Liquid-Based Cytology versus Conventional Cytology are used for the diagnosis of lung cancer, which made some progress, but still have some limitations in sensitivity, specificity and applicability. Thus, starting from the serum markers, finding susceptible and effective biomarkers have become a hot research topic. At present, many single nucleotide polymorphisms (SNPs) associated with lung cancer have been found by GWAS, Taqman probe (Taqman real time PCR) assays, DNA sequencing technology, such as CYFRA21-1 [5, 6], NSE [7], CA19-9 [8], KDM4A [9, 10], TP53 [11], KRT81 [12], etc. In epigenetic field, methylation, histone modification, RNA correlation silence, telomere are also relates with the development of lung cancer [13–16]. Multiple tumor markers are usually used to improve the detection effect of early lung cancer, because the single tumor marker isn’t reliable.
In this study, we screened the biomarkers related to genetic susceptibility and epigenic modification of relevant genes in lung cancer, and analyzed the relationship between these biomarkers and the occurrence of lung cancer and established the early intelligent diagnostic model of lung cancer was also established based on multiple tumor markers and data mining techniques. We also performed comparison between data mining and Fisher discriminatory analysis in the classification effect, explored the application value of tumor markers in the early warning of lung cancer, in order to construct the early intelligentized model for diagnosis.
RESULTS
General data of research objects was compared
The age difference between the case group and the control group was statistically significant (P<0.05), the gender difference was not statistically significant (P>0.05). The smoking rate of lung cancer group was higher than control group, the difference was statistically significant (P<0.05), seen in Table 1.
Table 1: General characteristics of the case and control group
Case group(n=200) |
Control group(n=200) |
χ2/t |
P |
|
|---|---|---|---|---|
Age (±s) |
59.56±10.56 |
53.70±13.34 |
4.872 |
<0.001 |
Male (n) |
143 |
151 |
0.821 |
0.428 |
Smokin (n) |
107 |
79 |
7.879 |
0.007 |
Correlation between the genetic polymorphism of CYP1A1, GSTM1, GSTT1, mEH, XRCC1 and lung cancer
CYP1A1-rs1048943 GG+AG genotype, GSTM1 deletion genotype, mEH-rs1051740 mutant genotype, XRCC1-rs1799782 TT+CT genotype, XRCC1- rs25489 GG genotype showed significant correlations with lung cancer risk increased. Mutant genotype and wildtype genotype of CYP1A1- rs35463883, mEH-rs55784606, XRCC1- rs25487 gene and GSTT1 deletion genotype were no significantly difference between the case group and the control group(P>0.05), seen in Table 2.
Table 2: CYP1A1, GSTM1, GSTT1, mEH, XRCC1 gene polymorphisms and lung cancer susceptibility association analysis
Gene polymorphisms |
Case group |
Control group |
OR(95%CI) |
ORadj (95 %CI)# |
||
|---|---|---|---|---|---|---|
n |
% |
n |
% |
|||
CYP1A1 |
||||||
rs35463883 |
||||||
Wildtype (TT) |
59 |
29.5 |
68 |
34.0 |
1.00 |
1.00 |
Variant (CC+CT) |
141 |
70.5 |
132 |
66.0 |
1.231 (0.846-1.791) |
1.133 (0.773-1.661) |
rs1048943 |
||||||
Wildtype (AA) |
90 |
45.0 |
116 |
57.8 |
1.00 |
1.00 |
Variant (GG+AG) |
110 |
55.0 |
84 |
42.2 |
1.688 (1.136-2.507)* |
1.727 (1.203-2.477) |
GSTM1 |
||||||
+ |
82 |
41.4 |
112 |
55.9 |
1.00 |
1.00 |
- |
118 |
58.6 |
88 |
44.1 |
1.831 (1.232-2.723) |
1.727 (1.211-2.463) |
GSTT1 |
||||||
+ |
114 |
56.6 |
122 |
60.9 |
1.00 |
1.00 |
- |
86 |
43.4 |
78 |
39.1 |
1.180 (0.792-1.758) |
1.284 (0.893-1.847) |
mEH |
||||||
rs1051740 |
||||||
Wildtype (TT) |
51 |
25.5 |
76 |
37.9 |
1.00 |
1.00 |
Variant (CC+TC) |
149 |
74.5 |
124 |
62.1 |
1.791 (1.168-2.745) |
1.758 (1.194-2.589)* |
rs55784606 |
||||||
Wildtype (CC) |
154 |
76.9 |
162 |
80.8 |
1.00 |
1.00 |
Variant (TT+CT) |
46 |
23.1 |
38 |
19.1 |
1.273 (0.786-2.064) |
1.436 (0.924-2.231) |
XRCC1 |
||||||
rs1799782 |
||||||
Wildtype (CC) |
86 |
43.0 |
108 |
53.9 |
1.00 |
1.00 |
Variant (TT+CT) |
114 |
57.0 |
92 |
46.1 |
1.556 (1.049-2.309) |
1.542 (1.083-2.196) |
rs25489 |
||||||
Variant (AA+GA) |
180 |
90.4 |
192 |
95.7 |
1.00 |
1.00 |
Wildtype (GG) |
20 |
9.6 |
8 |
4.3 |
2.667 (1.146-6.206) |
2.941 (1.427-6.060) |
rs25487 |
||||||
Wildtype (GG) |
100 |
50.2 |
107 |
53.5 |
1.00 |
1.00 |
Variant (AA+GA) |
100 |
49.8 |
93 |
46.5 |
1.151 (0.777-1.704) |
1.163 (0.805-1.680) |
#: Adjusted by gender, age, smoking status; *:P<0.05.
Correlation between the methylation of p16 gene and RASSF1A gene and lung cancer
The lung cancer patient group and the control group were divided into four layers according to the quartile of two genes methylation level, the results showed that the increase of p16 gene and RASSF1A gene correlated with increasing risk of lung cancer(Ptrend<0.05); The median of two genes methylation level was divided into two layers according to the median, the results showed the level of methylation higher than the median will cause increasing risk of lung cancer as seen in Table 3.
Table 3: The level of p16, RASSF1A gene methylation and the risk of lung cancer
The level of gene methylation (%) |
Lung cancer group |
Control group |
OR (95%CI)* |
P* |
|
|---|---|---|---|---|---|
P16 is classified by quartile |
First quartile |
35 |
65 |
1 |
— |
Second quartile |
52 |
48 |
1.856 (1.018~3.382) |
0.043 |
|
Third quartile |
57 |
44 |
2.310 (1.270~4.202) |
0.006 |
|
Fourth quartile |
56 |
43 |
2.079 (1.140~3.791) |
0.017 |
|
P** |
0.006 |
— |
— |
||
P trend |
— |
— |
0.002 |
— |
|
P16 is classified by median |
≤Median |
87 |
113 |
1 |
— |
>Median |
113 |
87 |
1.597 (1.052~2.422) |
0.028 |
|
P** |
0.009 |
— |
— |
||
RASSF1A is classified by quartile |
First quartile |
38 |
62 |
1 |
— |
Second quartile |
50 |
49 |
1.492 (0.822~2.708) |
0.189 |
|
Third quartile |
58 |
43 |
1.976 (1.088~3.591) |
0.025 |
|
Fourth quartile |
54 |
46 |
1.837 (1.013~3.333) |
0.045 |
|
P** |
0.035 |
— |
— |
||
P trend |
— |
— |
0.014 |
— |
|
RASSF1A is classified by median |
≤Median |
88 |
111 |
1 |
— |
>Median |
112 |
89 |
1.551 (1.023~2.353) |
0.039 |
|
P** |
0.021 |
— |
— |
||
ps: * is used unconditional Logistic regression to calculate OR and P values, Adjusted by gender, age, smoking status; ** is the result of x2.
Analysis of the association between telomere relative length and lung cancer
The lung cancer patient group and the control group were divided into four layers according to the quartile of telomere relative length. With the risk analysis of lung cancer with the long telomere group as the reference group, the results showed that the shortening of telomere relative length correlated with increasing risk of lung cancer(Ptrend<0.001); Then according the median divided layers, the risk of lung cancer in patients with short telomere length is 3.258 times of the long telomere length group, the difference was statistically significant as seen in Table 4.
Table 4: Telomere length and the risk of lung cancer
Telomere length |
Lung cancer group |
Control group |
ORadj(95%CI)* |
P* |
|
|---|---|---|---|---|---|
Classified by quartile |
RTL>1.27 |
23 |
80 |
1 |
— |
0.95<RTL≤1.27 |
47 |
48 |
2.625 (1.378~5.002) |
0.003 |
|
0.73<RTL≤0.95 |
66 |
33 |
6.064 (3.164~11.622) |
<0.001 |
|
RTL≤0.73 |
64 |
39 |
4.962 (2.619~9.401) |
<0.001 |
|
P |
<0.001** |
— |
<0.001*** |
— |
|
Classified by median |
RTL>0.95 |
70 |
128 |
1 |
— |
RTL≤0.95 |
130 |
72 |
3.258 (2.118~5.011) |
0.009 |
|
P |
<0.001** |
— |
— |
— |
ps: * is used unconditional Logistic regression to calculate OR and P values, Adjusted by gender, age, smoking status: ** is the result of x2;***: is the result of trend test.
Evaluation of lung cancer discriminative model based on 5 genetic polymorphisms
Through analyzing the diagnostic value of three kinds of models by ROC, results showed the ROC curve area (AUC) of Fisher discriminant analysis is less than 0.7 showing the lower accurate diagnosis, but the AUC of decision tree and ANN are all closed to 0.9, showing the better accurate of diagnosis. The model prediction results are shown in Table 5 and Figure 1.
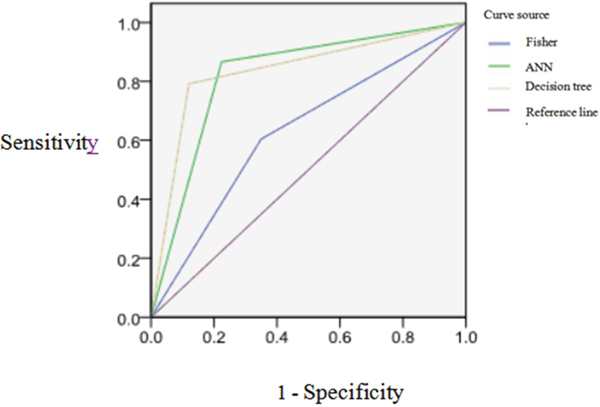
Figure 1: The ROC curves of three kinds of models for classification effect of prediction set model.
Table 5: The diagnostic results of the 3 models on the prediction set
Model |
Sensitivity(%) |
Specificity(%) |
Accuracy(%) |
Positive Predictive value(%) |
Negative Predictive value(%) |
AUC(95%CI) |
|---|---|---|---|---|---|---|
Fisher |
69.64 |
57.38 |
63.25 |
60.00 |
67.31 |
0.627 (0.570-0.684) |
Decision tree |
75.47 |
88.71 |
82.61 |
85.11 |
80.88 |
0.836 (0.792-0.879) |
ANN |
75.41 |
1 |
80.77 |
82.14 |
79.73 |
0.821 (0.776-0.866) |
Evaluation of lung cancer discriminant model based on the methylation of p16 gene and RASSF1A gene and the relative length of telomere
Through analyzing the diagnostic value of models by ROC, the result showed the ROC curve area (AUC) of Fisher discriminant analysis is less than 0.7 showing the lower accurate diagnosis, but the AUC of decision tree and ANN model are more than 0.7 which indicates the moderate accurate diagnosis better than the diagnostic value of Fisher discriminant analysis as seen in Table 6 and Figure 2.
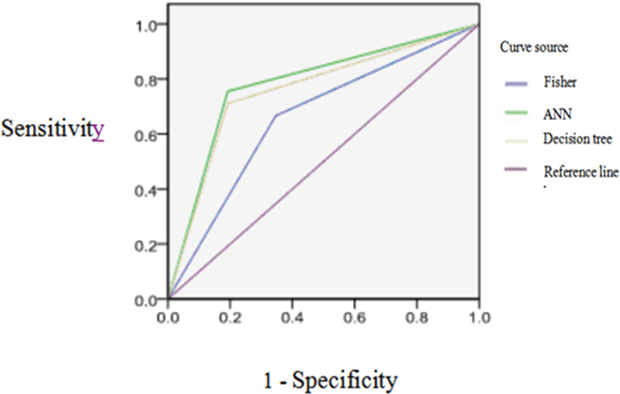
Figure 2: The ROC curves of three kinds of models for classification effect of prediction set model.
Table 6: The diagnostic results of the 3 models on the prediction set
Model |
Sensitivity(%) |
Specificity(%) |
Accuracy(%) |
Positive Predictive value(%) |
Negative Predictive value(%) |
AUC(95%CI) |
|---|---|---|---|---|---|---|
Fisher |
62.79 |
67.44 |
65.82 |
71.05 |
60.98 |
0.660 (0.551-0.770) |
Decision tree |
70.59 |
79.66 |
75.45 |
75.00 |
75.81 |
0.782 (0.686-0.878) |
ANN |
74.48 |
69.93 |
72.15 |
70.13 |
74.30 |
0.759 (0.660-0.859) |
Evaluation of lung cancer discriminant model based on tumor markers
Through random extracted 75% and 25% of samples as the training set and the prediction set, the classification accuracy rate was 72.15% and 70.59% by Fisher discriminant analysis model after repeated training. However the classification accuracy rate was 92.96% and 89.62% of decision tree C5.0 model, ANN model for prediction set and the training set classification accuracy was 92.96% and 89.62%.
The result of diagnostic value of models by ROC showed the AUC of Fisher discriminant analysis is 0.722, showing the moderate accurate diagnosis, the AUC of decision tree is more than 0.9, showing the better accurate diagnosis. The AUC of ANN is more than 0.9, also showing the better accurate diagnosis. Therefore, two kinds of data mining models are better than discriminant analysis model of diagnostic value. As seen in Table 7 and Figure 3.
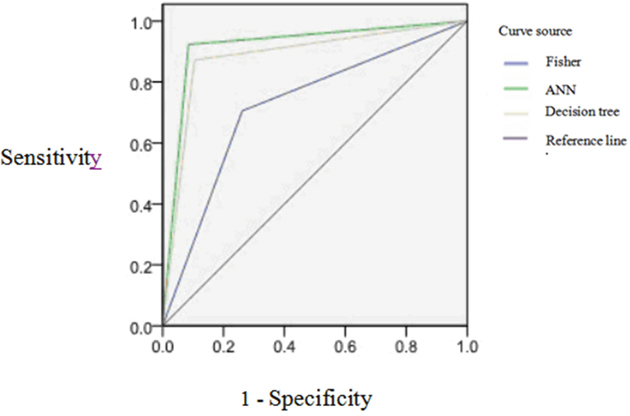
Figure 3: The ROC curves of three kinds of models for classification effect of prediction set model.
Table 7: The diagnostic results of the 3 models on the prediction set
Model |
Sensitivity(%) |
Specificity(%) |
Accuracy(%) |
Positive Predictive value(%) |
Negative Predictive value(%) |
AUC(95%CI) |
|---|---|---|---|---|---|---|
Fisher |
65.38 |
76.00 |
70.59 |
73.91 |
67.86 |
0.722 (0.664-0.780) |
Decision tree |
90.70 |
94.74 |
93.00 |
92.86 |
93.10 |
0.929 (0.894-0.964) |
ANN |
89.09 |
90.20 |
89.62 |
90.74 |
88.46 |
0.894 (0.852-0.935) |
Classification of lung cancer in early stage (I+II stage) by using decision tree and ANN model
Through combining the genetic polymorphism of CYP1A1-rs1048943, GSTM1, mEH-rs1051740, XRCC1-rs1799782 and XRCC1-rs25489, the methylation of p16 and RASSF1A gene, the length of telomere, smoking status and other factors, the early stage classification model of lung cancer was established by using decision tree and ANN techniques through repeated training. And then we classified the lung cancer in the early stage (I+II stage), evaluated the effectiveness and diagnostic value of the model. The results shown that the classification accuracy of the decision tree model is 96.36%, the ANN model is 89.09%, which illustrated the classification results was better as seen in Figure 4 and 5.
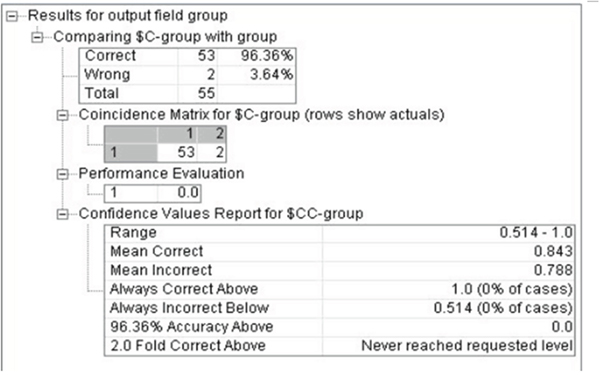
Figure 4: The classification of decision tree model for early stage lung cancer.
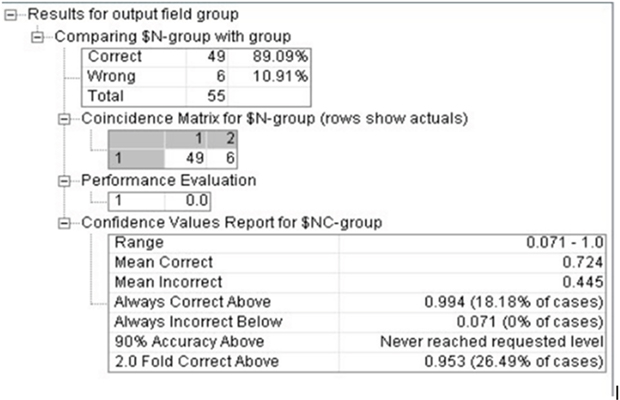
Figure 5: The classification of ANN model for early stage lung cancer.
DISCUSSION
Recent studies have indicated that the occurrence of lung cancer is a multiple- factors and multiple-step process, and it is the result of interaction between genetic and environmental exposure factors [17]. Tumor markers can be produced directly by the tumor or by non-tumor cells. Biomarker can be found in blood, urine, or body tissues. The levels of biomarkers can be elevated specifically caused by the presence of one or more types of cancers. There are many different tumor markers, indicative of a particular disease process. They have been exploited in detection of cancers. An elevated level of a tumor marker indicates the formation or existence of cancer [18]. Therefore, such tumor makers are likely useful tools for early diagnosis, treatment and prognosis of tumor.
Therefore, genetic polymorphisms of CYP1A1-rs1048943, GSTM1, GSTT1, mEH-rs1051740 and XRCC1(rs1799782, rs25489), methylation of p16 and RASSF1A gene, and telomere length were analyzed in peripheral blood both from lung cancer patients and health controls to explore their correlation. The results showed that all indexes had different degrees of correlation with lung cancer. Smoking has the most closer relationship to lung cancer, which is consistent with other research results [19–25]. Compared with the diagnostic model based on different tumour markers, it has been shown that the AUC level of each discriminative model has been improved by about 10% based on multiple tumor markers, which indicates that the sensitivity and specificity of diagnosis can be substantially improved through combining different tumor makers compared to individual tumor marker. Therefore, multiple tumor marker analysis system is more suitable for the construction of the early intelligent discriminative model of lung cancer.
Data Mining, also called Knowledge Discovery from Database, is a complex process which extracts and excavates unknown and valuable knowledge such as model or regular pattern from mass incomplete, fuzzy, noisy, random of data [26–28]. The latest technology, such as database technology, machine learning, artificial intelligence, statistics, information retrieval and data visualization was combined together [29]. Fisher discriminant analysis is a traditional statistical classification method, the principle of this method is substitution the indicators of the observation unit based on discriminant function, obtain the corresponding discriminant function value, and finally according to the function value of the observation unit to determine the classification effect [30].
The sensitivity, specificity and accuracy of lung cancer discrimination model, based on data mining technology, were higher than Fisher discriminant analysis model, the AUC of ANN model and decision tree model are 0.929 and 0.894 respectively, which based on multiple tumour markers, but the AUC of Fisher discriminant analysis model is 0.722, which indicated that the data mining technology is more suitable for lung cancer discriminant model. Due to lack significant correlation between indexes, various factors have complicated nonlinear relationship with lung cancer. The model of Fisher discriminant analysis is a linear model, which has a higher requirement for the data, and has great limitations in analysis the variation law of the nonlinear data system [31]. The data mining technology has better intelligent characteristics when dealing with complex nonlinear data for imprecise mathematical models, and identifies and taps the relationship and potential information of indicators by automatically learning, and describe the fuzzy evaluation, therefore, the limit of data types is smaller [32, 33]. On the other hand, compared the methodology, the classification of data information by Fisher discriminant analysis, which based on the statistics attribute of samples, but the data mining technology is based on logic, which belongs to the category of intelligent machine learning.
Through further comparing two discriminant models, the sensitivity, specificity and accuracy of the decision tree model were 90.7%, 94.74%, 93%, and each index from decision tree model was better than the ANN model. The reasons probably are: firstly ANN is a processing network to deal with complex information, which composed by wide connection of many simple processing units [34], needs to transform the discrete attributes of numerical value into numerical attributes, so ANN is more susceptible to data attributes than decision trees [35]. Secondly, the neural network has the better ability to manipulate data with time sequence [36–38], but it requires more data. Moreover, it needs to draw support from the rich experience in training, the training sample set should contain all the patterns, and the input data should as far as possible haven’t relevant between each other, these lead the higher requirements of the sample data, which means the neural network is more suitable for the larger database [39]. In addition, the classification result of Decision tree model was simple, clear, intuitive structure [40–42], has more advantages in explaining and analyzing the results than ANN model.
Finally, in this study tumor markers from 55 patients with diagnosed clinical early stage (I+II) lung cancers were used to evaluate the effectiveness and diagnostic value of the model. The accuracy rate of decision tree and ANN model is 96.36 and 89.09, respectively. The diagnostic efficiency with the new model was better than ANN model.
Limitations need to be considered in explaining the time and causal relationship between the occurrence of molecular events and lung cancer, although we tried to recruit more cases who on Clinical stage I and II, the inherently limitations of case-control design still exist. In the next step, with the permission of funds and technology, we will verify the efficiency of the diagnosis model by expanding the sample size and/or using prospective studies.
The early intelligent discriminative models of lung cancer has the better diagnostic effect and profound significance for diagnostic the early stage lung cancer, which based on multiple tumour markers and data mining techniques.
MATERIALS AND METHODS
Subject of study
The patients (n=200) were diagnosed as lung cancer by pathology from the First Affiliated Hospital of Zhengzhou University, including 87 squamous cell carcinoma cases, 72 adenocarcinoma cases, 33 small cell lung cancer cases and 8 large cell lung cancer cases; 55 cases of Clinical stage I and II, 145 of clinical stage III and IV; Age: 59.56 ± 10.56 years old; Gender: 143 Male and 57 female; Smoker: 107 smokers and 93 non-smokers; The control group (n=200) was from healthy non-tumor persons by Physical examination department from the First Affiliated Hospital of Zhengzhou University: Age (53.70±13.34) years old; 151 Male cases, 49 female cases, 79 smokers cases, 121 non-smokers; 2ml of peripheral blood was collected after morning fasting. Epidemiological data and blood samples were collected by professional investigators and doctors after the subject’s informed consent.
Each index detection method
Genomic DNA was extracted from 2 ml blood according to the instruction of the QIAamp DNA Mini kit.
The polymorphisms were detected with allele specific amplification method (ASA) and polymerase chain reaction-restriction fragment length polymorphism (PCR-RFLP) method. The genes included CYP1A1 rs1048943ll, rs35463883 [43], mEH rs1051740, rs1051740 [44], XRCC1 rs1799782, rs25487 [45], rs25489 [46]. The polymorphisms of GSTM1 and GSTT1 genes were detected by Multiple PCR method [47].
The methylation level of p16 and RASSF1A were detected by real-time methylation specific PCR [48–49]. The relative telomere length was detected by real-time fluorescence quantitative PCR method. GAPDH was used as a reference gene [50].
General statistical analysis of data
The general statistical analysis was assessed by SPSS21.0 software, according statistical data type to choose description method, using mean±standard deviation when data was normal distribution, using median and inter-quartile range when data wasn’t normal distribution, comparing count data groups used Student’s t test or Wilcoxon rank sum test; Comparing count data groups used chi-square test, the correlation between indicators and lung cancer was determined using the logistic regression. α=0.05.
Data mining model establishment
All the data are normalized to [0, 1] with the max min method.
According to the proportion of 3:1, the data is divided into training set and prediction set by SPSS Clementine software of random sampling founction.
Based on Clementine SPSS 12 software of fisher discriminant analysis, decision tree C5.0 and BP neural network algorithm, the diagnostic model of lung cancer was established.
The model was evaluated with diagnostic test, the indexes include sensitivity, specificity, accuracy, area under the receiver operating characteristic curve (AUC), positive predictive value and negative predictive value. The AUC less than 0.5 shows the diagnosis hasn’t significance; the AUC between 0.5~0.7 showing the lower accurate diagnosis; AUC between 0.7~0.9 showing the medium accurate diagnosis; AUC more than 0.9, showing the higher accurate diagnosis.
Abbreviations
DM: Data mining; ANN: Artificial Neural Networks; KDD: Knowledge Discovery from Database; ASA: allele-specific amplification; PCR: Polymerase Chain Reaction; RFLP: Restriction fragment lebgth polymorphism; Qmsp: real-time methylation specific PCR; BP, Back-Propagation; GWAS: genome wide association study; SNP: Single nucleotide polymorphisms; BER: base excision repair; AUC: area under the curve; CYP1A1: Cytoehrome P4501A1; GST: Glutathione-S-transferase; mEH, microsomal epoxide hydrase; XRCC1: X-ray repair cross-complementing gene 1; CGI: CpG island; NSCLC, non-small cell lung cancer; TM: Tumor Marker; OR: Odds Ratio; CI: Confidenee Interva.
CONFLICTS OF INTEREST
The authors have no conflicts of interest with the subject matter or materials discussed in this manuscript.
GRANT SUPPORT
This study was supported by the National Natural Science Foundation of China (No. 81573203), by the Key Project of He’nan Educational Committee (No. 13A330447), by the National Natural Science Foundation of China (No.81402712), by the outstanding youth grant of Zhengzhou University (No.1421329082), by the research fund for doctoral courses in Colleges and Universities (No. 20134101120004), by the Outstanding innovating talents grant of Henan Province (No. 154200510015).
REFERENCES
1. GBD 2015 Risk Factors Collaborators. Global, regional, and national comparative risk assessment of 79 behavioural, environmental and occupational, and metabolic risks or clusters of risks, 1990-2015: a systematic analysis for the Global Burden of Disease Study 2015. Lancet. 2016; 388:1659-1724.
2. Chen W, Zheng R, Baade PD, Zhang S, Zeng H, Bray F, Jemal A, Yu XQ, He J. Cancer statistics in China, 2015. CA Cancer J Clin. 2016; 66:115-132.
3. He J. Annual report on status of cancer in China, 2013. Military Medical Science Press, 2014.
4. Hiley CT, Le Quesne J, Santis G, Sharpe R, de Castro DG, Middleton G, Swanton C. Challenges in molecular testing in non-small-cell lung cancer patients with advanced disease. Lancet. 2016; 388: 1002-1011.
5. Chen Z, Liang R, Guo X, Liang J, Deng Q, Li M, An T, Liu T, Wu Y. Simultaneous quantitation of cytokeratin-19 fragment and carcinoembryonic antigen in human serum via quantum dot-doped nanoparticles. Biosensors & bioelectronics. 2017; 91:60-65.
6. Wang L, Wang D, Zheng G, Yang Y, Du L, Dong Z, Zhang X, Wang C. Clinical evaluation and therapeutic monitoring value of serum tumor markers in lung cancer. The International journal of biological markers. 2016; 31:e80-87.
7. Miao L, Lu Y, Xu Y, Zhang G, Huang Z, Gong L, Fan Y. PD-L1 and c-MET expression and survival in patients with small cell lung cancer. Oncotarget. 2017;8:53978-53988. http://doi.org/10.18632/oncotarget.9765.
8. Son SM, Han HS, An JY, Choe KH, Lee KM, Lee KH, Kim SS, Lee YM, Lee HC, Song HG, Lee OJ. Diagnostic performance of CD66c in lung adenocarcinoma-associated malignant pleural effusion: comparison with CEA, CA 19-9, and CYFRA 21-1. Pathology. 2015; 47:123-129.
9. Van Rechem C, Black JC, Greninger P, Zhao Y, Donado C, Burrowes PD, Ladd B, Christiani DC, Benes CH, Whetstine JR. A coding single-nucleotide polymorphism in lysine demethylase KDM4A associates with increased sensitivity to mTOR inhibitors. Cancer discovery. 2015; 5:245-254.
10. Carbonneau M, Gagné L, Lalonde ME, Germain MA, Motorina A, Guiot MC, Secco B, Vincent EE, Tumber A, Hulea L, Bergeman J, Oppermann U, Jones RG, et al. The oncometabolite 2-hydroxyglutarate activates the mTOR signalling pathway. Nature communications. 2016; 7:12700.
11. Zhang Y, Wang DC, Shi L, Zhu B, Min Z, Jin J. Genome analyses identify the genetic modification of lung cancer subtypes. Seminars in cancer biology. 2017; 42:20-30.
12. Lee SY, Choi JE, Jeon HS, Hong MJ, Choi YY, Kang HG, Yoo SS, Lee EB, Jeong JY, Lee WK, Lee J, Cha SI, Kim CH, et al. A genetic variation in microRNA target site of KRT81 gene is associated with survival in early-stage non-small-cell lung cancer. Ann Oncol. 2015; 26:1142-1148.
13. Mohammad HP, Smitheman KN, Kamat CD, Soong D, Federowicz KE, Van Aller GS, Schneck JL, Carson JD, Liu Y, Butticello M, Bonnette WG, Gorman SA, Degenhardt Y, et al. A DNA Hypomethylation Signature Predicts Antitumor Activity of LSD1 Inhibitors in SCLC. Cancer cell. 2015; 28:57-69.
14. Belinsky SA. Unmasking the lung cancer epigenome. Annual review of physiology. 2015; 77:453-474.
15. Karami S, Han Y, Pande M, Cheng I, Rudd J, Pierce BL, Nutter EL, Schumacher FR, Kote-Jarai Z, Lindstrom S, Witte JS, Fang S, Han J, et al. Telomere structure and maintenance gene variants and risk of five cancer types. International journal of cancer. 2016; 139:2655-2670.
16. Momi N, Kaur S, Rachagani S, Ganti AK, Batra SK. Smoking and microRNA dysregulation: a cancerous combination. Trends in molecular medicine. 2014; 20:36-47.
17. Livak KJ, Schmittgen TD. Analysis of relative gene expression data using real-time quantitative PCR and the 2(T)(-Delta Delta C) method. Methods. 2001; 25:402-408.
18. Chen CY. DNA polymerases drive DNA sequencing-by-synthesis technologies: both past and present. Front Microbiol. 2014; 5:305.
19. Futami K, Ogasawara S, Goto H, Yano H, Furuichi Y. RecQL1 DNA repair helicase: A potential tumor marker and therapeutic target against hepatocellular carcinoma. Int J Mol Med. 2010; 25:537-545.
20. Girdhar Y, Singh N, Behera D, Sharma S. Synergistic association of CYP1A1 polymorphisms with increased susceptibility to squamous cell lung cancer in north Indian smokers. Int J Biol Markers. 2016; 31:e402-e412.
21. Li W, Yue W, Zhang L, Zhao X, Ma L, Yang X, Zhang C, Wang Y, Gu M. Polymorphisms in GSTM1, CYP1A1, CYP2E1, and CYP2D6 are associated with susceptibility and chemotherapy response in non-small-cell lung cancer patients. Lung. 2012; 190:91-98.
22. Yu W, Lin Z, Qu B. Impact of epoxide hydrolase 1 polymorphisms on lung cancer susceptibility in Asian populations. Cell Biochem Biophys. 2015; 71:3-20.
23. Gurubhagavatula S, Liu G, Park S, Zhou W, Su L, Wain JC, Lynch TJ, Neuberg DS, Christiani DC. XPD and XRCC1 genetic polymorphisms are prognostic factors in advanced non-small-cell lung cancer patients treated with platinum chemotherapy. J Clin Oncol. 2004; 22:2594-2601.
24. Calmon MF, Colombo J, Carvalho F, Souza FP, Filho JF, Fukuyama EE, Camargo AA, Caballero OL, Tajara EH, Cordeiro JA, Rahal P. Methylation profile of genes CDKN2A (p14 and p16), DAPK1, CDH1, and ADAM23 in head and neck cancer. Cancer Genet Cytogenet. 2007; 173:31-37.
25. Liu Y, Lan Q, Siegfried JM, Luketich JD, Keohavong P. Aberrant promoter methylation of p16 and MGMT genes in lung tumors from smoking and never-smoking lung cancer patients. Neoplasia. 2006; 8:46-51.
26. Sun B, Wang Y, Kota K, Shi Y, Motlak S, Makambi K, Loffredo CA, Shields PG, Yang Q, Harris CC, Zheng YL. Telomere length variation: A potential new telomere biomarker for lung cancer risk. Lung Cancer. 2015; 88:297-303.
27. Qian Y, Ding T, Wei L, Cao S, Yang L. Shorter telomere length of T-cells in peripheral blood of patients with lung cancer. Onco Targets Ther. 2016; 9: 2675-82.
28. Jiang P, Liu XS. Big data mining yields novel insights on cancer. Nat Genet. 2015; 47: 103-104.
29. Yoo I, Alafaireet P, Marinov M, Pena-Hernandez K, Gopidi R, Chang JF, Hua L. Data mining in healthcare and biomedicine: a survey of the literature. J Med Syst. 2012; 36:2431-48.
30. Jiang P, Liu XS. Big data mining yields novel insights on cancer. Nat Genet. 2015; 47:103-1044.
31. Shouval R, Labopin M, Bondi O, Mishan-Shamay H, Shimoni A, Ciceri F, Esteve J, Giebel S, Gorin NC, Schmid C, Polge E, Aljurf M, Kroger N, et al. Prediction of Allogeneic Hematopoietic Stem-Cell Transplantation Mortality 100 Days After Transplantation Using a Machine Learning Algorithm: A European Group for Blood and Marrow Transplantation Acute Leukemia Working Party Retrospective Data Mining Study. J Clin Oncol. 2015; 33:3144-3151.
32. Wang H, Lu X, Hu Z, Zheng W. Fisher discriminant analysis with L1-norm. IEEE Trans Cybern. 2014; 44:828-842.
33. Oquendo M.A, Baca-Garcia E, Artes-Rodriguez A, Perez-Cruz F, Galfalvy HC, Blasco-Fontecilla H, Madigan D, Duan N. Machine learning and data mining: strategies for hypothesis generation. Mol Psychiatry. 2012; 17:956-959.
34. Sung SF, Hsieh CY, Kao Yang YH, Lin HJ, Chen CH, Chen YW, Hu YH. Developing a stroke severity index based on administrative data was feasible using data mining techniques. J Clin Epidemiol. 2015; 68:1292-1300.
35. Hagan MT, Demuth HB, Beale MH. Neural Network Design (2nd Edition). Martin Hagan, 2014.
36. Myers J, de Souza CR, Borghi-Silva A, Guazzi M, Chase P, Bensimhon D, Peberdy MA, Ashley E, West E, Cahalin LP, Forman D, Arena R. A neural network approach to predicting outcomes in heart failure using cardiopulmonary exercise testing. Int J Cardiol. 2014; 171: 265-269.
37. Cambria E, Egrioglu E, Aladag CH. Application of multi-dimensional scaling and artificial neural networks for biologically inspired opinion mining. Biologigally Inspired Cognitive Architectures. 2013; 4: 41-53.
38. Khashei M, Hamadani AZ, Bijari M. A novel hybrid classification model of artificial neural networks and multiple linear regression models. Expert Systems With Applications. 2012; 39:2606-2620.
39. Yolcu U, Egrioglu E, Aladag CH. A new linear & nonlinear artificial neural network model for time series forecasting. Decision Support Systems. 2013; 54:1340-1347.
40. Wu X, Zhu XQ, Wu GQ, Wei D. Data Mining with Big Data. Ieee Transactions on Knowledge and Data Engineering. 2014; 26:97-107.
41. Huysmans J, Mues C, Dejaeger K, Vanthienen J, Baesens B. An empirical evaluation of the comprehensibility of decision table, tree and rule based predictive models. Decision Support Systems. 2011; 51:141-154.
42. Kotsiantis SB. Decision trees: a recent overview. Artificlal Intelligence Review. 2013; 39: 261-283.
43. Hayashi S, Watanabe J, Nakachi K, Kawajiri K. Genetic linkage of lung cancer-associated MspI polymorphisms with amino acid replacement in the heme binding region of the human cytochrome P450IA1 gene. Journal of biochemistry. 1991; 110:407-411.
44. Zhou W, Thurston SW, Liu G, Xu LL, Miller DP, Wain JC, Lynch TJ, Su L, Christiani DC. The interaction between microsomal epoxide hydrolase polymorphisms and cumulative cigarette smoking in different histological subtypes of lung cancer. Cancer Epidem Biomar. 2001; 10:461-466.
45. Xing DY, Qi J, Miao XP, Lu WF, Tan W, Lin DX. Polymorphisms of DNA repair genes XRCC1 and XPD and their associations with risk of esophageal squamous cell carcinoma in a Chinese population. International journal of cancer. 2002; 100:600-605.
46. Tuimala J, Szekely G, Gundy S, Hirvonen A, Norppa H. Genetic polymorphisms of DNA repair and xenobiotic-metabolizing enzymes: role in mutagen sensitivity. Carcinogenesis. 2002; 23:1003-1008.
47. Delpisheh A, Brabin L, Topping J, Reyad M, Tang AW, Brabin BJ. A case-control study of CYP1A1, GSTT1 and GSTM1 gene polymorphisms, pregnancy smoking and fetal growth restriction. European journal of obstetrics, gynecology, and reproductive biology. 2009; 143:38-42.
48. Herman JG, Graff JR, Myohanen S, Nelkin BD, Baylin SB. Methylation-specific PCR: a novel PCR assay for methylation status of CpG islands. Proceedings of the National Academy of Sciences of the United States of America. 1996; 93:9821-9826.
49. Hsu HS, Chen TP, Hung CH, Wen CK, Lin RK, Lee HC, Wang YC. Characterization of a multiple epigenetic marker panel for lung cancer detection and risk assessment in plasma. Cancer. 2007; 110:2019-2026.
50. Livak KJ, Schmittgen TD. Analysis of relative gene expression data using real-time quantitative PCR and the 2(T)(-Delta Delta C) method. Methods. 2001; 25:402-408.