
INTRODUCTION
Myeloid sarcoma (MS) is an extramedullary tumoral mass composed of immature myeloid cells. MS can manifest from various clinical conditions, including acute myeloid leukemia (AML), myeloproliferative disorders, myelodysplastic syndromes (MDS) and isolated tumors in patients without evident hematological disorders [1, 2]. In 2008 the World Health Organization classification adopted the term “myeloid sarcomas” as a subgroup of “acute myeloid leukemias, not otherwise categorized” [3]. The most frequently involved sites of MS are soft tissue, bone, skin and lymph node [4], while rarely involving the central nervous system [5]. Clinical symptoms of MS depend on the organs involved and generally do not impact treatment response [6]. Early diagnosis of MS and prompt treatment is associated with improved survival [7].
There are several case reports [8, 9] and pictorial essays [10] in radiology literature that report on image performance in MS, however, there exists only 5 small studies that systematically analyzed MS [11–15]. Choi et al. [11] previously reported computed tomography (CT) findings of MS involving the bowel, and Noh et al. [12] first reported CT findings of MS involving the head and neck. Seok et al. [13] reported MRI (pre-contrast T1WI and post-contrast T2WI) findings of MS involving the spine. In addition, Shinagare et al. [14] systematically reviewed and described multisystem CT and MRI (T1WI, T2WI and T1 post-contrast) characteristics of MS, but only 6 patients with central nervous system involvement were studied. Moreover, Chaudhry et al. [15] described CT and MRI (T1WI, T2WI and contrast-enhanced T1WI, DWI and SWI) characteristics of MS involving the brain. None of these studies systematically performed qualitative and quantitative analysis of diffusion and perfusion characteristics of MS, and none of these studies assessed treatment response of MS using MRI. The aim of this study was to qualitatively assess MRI findings of brain MS, perform quantitative analysis and to assess MRI as a tool to evaluate treatment response of brain MS.
MATERIALS AND METHODS
Study group
We performed a computer search of the pathology, radiology and medical records of 2 tertiary care centers in Beijing and Shenzhen, China (Baoan Central Hospital of ShenZhen and Aerospace Central Hospital) to identify pathologically confirmed cases of myeloid sarcoma that underwent treatment with standard chemotherapy from January 2011 to December 2016. We identified 42 patients with pathologically confirmed myeloid sarcoma anywhere in the body, 18 patients with myeloid sarcoma involving the brain, but only 10 patients (6 male and 4 female; range, 10–45 years) that underwent MRI examination and chemotherapy. These 10 patients constituted our study cohort.
Imaging protocol
The sequence of our brain tumor imaging protocol was as follows: T2-weighted imaging, fluid-attenuated inversion recovery imaging, non-enhanced T1-weighted imaging, Gd-DTPA contrast-enhanced T1-weighted imaging, SW imaging, DW imaging and ASL perfusion imaging. Images were from MRI examinations that utilized GE 1.5T and Siemens 3T MR imaging systems. Follow-up MRI was performed at 2 chemotherapy courses, 4 chemotherapy courses and 6 chemotherapy courses after treatment.
Qualitative image analysis
Two radiologists independently reviewed and evaluated the MR images with regard to the locations, morphologic characteristics, architecture, degree of surrounding edema and mass effect, pattern and degree of enhancement, ± susceptibility artifact, ± restricted diffusion and ± higher perfusion. The MRI signal intensity of the lesions was compared to the contralateral normal gray matter. The degree of enhancement, surrounding edema and mass effect were subjectively assessed as mild, moderate or marked.
Quantitative DW Image and ADC value analysis of brain MS
MRI images were transferred to the MR protocol workstation. From conventional MR and DW images, 2 independent and blinded observers identified the tumors’ contrast-enhanced components. The observers were allowed to adjust the grayscale center level and window width settings, as well as the zoom factor for optimal image interpretation. They measured ADC values of tumor by manually placing regions of interest (ROIs) within tumor components on ADC maps. ROIs (40–60 mm2) were placed to avoid cystic and/or necrotic areas. Each reviewer placed 3–5 ROIs on areas viewed to be the minimum and maximum ADC regions. There were more ROIs for more heterogeneous lesions. The average ADC was calculated as the mean of the summed values of the 3–5 ROIs. Minimum and maximum ADCs were selected, and the same observer placed ROIs (approximately 2.5 cm2/ROI) in contralateral normal hemispheres. The resulting ADC parameter measurements computed for each lesion were averaged between the 2 observers. Mean ADC values between 2 locations were compared with the independent samples t-test. P values < 0.05 were considered statistically significant. Statistical software (SPSS, version 22.0) was used to perform statistical analyses.
Quantitative ASL perfusion and CBF value analysis of brain MS
ASL perfusion parametric maps were obtained by using a dedicated software package and other software (Matlab 2013b; Mathworks). In the same way, tumor regions of interest (ROIs) were determined and manually drawn in an area with maximum signal enhancement on grayscale, and ASL cerebral blood flow (CBF) maps were calculated using perfusion software by 2 independent observers. Necrotic tissue and large vessels were avoided with T2-weighted images, CE T1-weighted images and ASL images. Tumor Blood Flow (TBF) values were measured in the ROIs described above. Each reviewer placed 3–5 ROIs on areas viewed to be the minimum and maximum TBF regions. The mean TBF values were calculated by taking the mean of the summed values of the 3–5 ROIs. Minimum and maximum CBF values were selected, and ROIs were also placed by the same observers in contralateral normal hemispheres. Hemisphere ROIs (approximately 2.5 cm2/ROI) were placed centrally within the hemispheres. The resulting CBF parameter measurements computed for each lesion were averaged between the 2 observers. The mean CBF values between the two locations were compared with independent samples t-test. P values < 0.05 were considered statistically significant. Statistical software (SPSS, version 22.0) was used to perform statistical analyses.
Evaluation of post-treatment response of brain MS
All patients underwent standard induction chemotherapy and intrathecal chemotherapy, and 4 patients also underwent radiation treatment. Standard chemotherapy treatment of MS is identical to that of AML, comprised of 2 courses of induction chemotherapy (idarubicin and arabinocytidine) and 4 courses of consolidation chemotherapy. Treatment response is classified as complete remission, partial remission or recrudescence. To assess MS treatment response via MRI, the loss of mass suggests a complete remission of MS. Although, the mass does not completely disappear, but shrinks, suggesting partial remission. If the tumor persists, it indicates residual disease. Radiologists independently reviewed and evaluated the post-treatment MR images with regards to changes in lesion size, surrounding edema, mass effect, degree of enhancement, signal intensity change of DWI images and post-treatment MRI.
RESULTS
Clinical findings
As shown in Table 1, the most common clinical symptom of brain MS was headache (8 of 9 patients). Other manifestations included numbness of limb, blurred vision and epilepsy. All patients have a known history of hematologic malignancy, including 7 patients with a known history of AML, 2 patients with a history of acute lymphoblastic leukemia (ALL) and 1 patient with a history of chronic myelogenous leukemia (CML). Primary myeloid sarcoma was not found in our study.
Table 1: Clinical characteristics of patients with intracranial myeloid sarcoma
Patient No. |
Sex |
Age |
Disease and Diagnosis Time |
Clinical Manifestation at Presentation |
|---|---|---|---|---|
1 |
M |
20 |
AML/6 months |
Numbness of limb |
2 |
M |
39 |
CML/120 months |
Headache |
3 |
M |
25 |
ALL/11 months |
Headache, nausea and vomiting |
4 |
M |
38 |
AML/2 month |
Headache and blurred vision |
5 |
F |
10 |
AML/24 months |
Headache |
6 |
F |
29 |
AML/21 months |
Headache |
7 |
M |
23 |
AML/12 months |
Epilepsy and headache |
8 |
M |
26 |
ALL/24 months |
Headache, nausea and vomiting |
9 |
F |
45 |
AML/8 months |
Headache |
10 |
F |
31 |
AML/16 months |
Headache |
Qualitative MRI of brain MS
Qualitative results of brain MS are shown in Table 2. A total of 40 lesions in the brain were studied, including lesions located in the brain parenchyma involving the temporal lobe (n = 10), frontal lobe (n = 15), parietal lobe (n = 6), occipital lobe (n = 3) and cerebellar hemisphere (n = 6). Multifocal brain lesions were noted in 6 patients. On MRI, mean lesion size was recorded as 2.0 ± 0.8 cm. The lesions were isointense (70%) or hypointense (30%) on T1-weighted images with homogeneous (75%) or heterogeneous (25%) enhancement. On fluid-attenuated inversion recovery and T2-weighted images, lesions were hyperintense (90%) or isointense (10%), with surrounding vasogenic edema (75%) or obvious mass effect (10%). For those with surrounding edema and mass effect, about 50% had mild edema, 15% had mass effect and 10% had cysts and/or necrosis (Figure 1). On DWI, the lesions (90%) demonstrated restricted diffusion. On SWI or T2*-GRE imaging, lesions (12.5%) revealed susceptibility artifact. None of these had evidence of observable calcification. On ASL perfusion imaging, the lesions (80%) demonstrated mild-to-moderate lower-perfusion (Figure 2). Two patients had diffuse infiltration of the multifocal meninges. Moreover, 1 patient had involvement of the skull.
Table 2: Qualitative MRI findings in myeloid sarcoma
Total no. of lesions |
40 |
|||
|---|---|---|---|---|
Location |
temporal lobe |
10 |
25% |
10/40 |
frontal lobe |
15 |
37.5% |
15/40 |
|
parietal lobe |
6 |
15% |
6/40 |
|
occipital lobe |
3 |
7.5% |
3/40 |
|
Cerebellar hemisphere |
6 |
15% |
6/40 |
|
Mean lesion size |
2.0 ± 0.8 cm |
|||
Shape |
regular |
36 |
90% |
36/40 |
irregular |
4 |
10% |
4/40 |
|
Signal intensity |
||||
T1WI |
isointense |
28 |
70% |
28/40 |
Hypointense |
12 |
30% |
12/40 |
|
T2WI/FLAIR |
Hyperintense |
34 |
85% |
34/40 |
Isointense |
4 |
10% |
4/40 |
|
Hypointense |
2 |
5% |
2/40 |
|
SWI |
Isointense |
35 |
87.5% |
35/40 |
Hypointense |
5 |
12.5% |
5/40 |
|
DWI |
Hyperintense |
32 |
80% |
36/40 |
Isointense |
4 |
10% |
4/40 |
|
ASL |
Isointense |
6 |
15% |
12/40 |
Mild Hypointense |
26 |
65% |
20/40 |
|
Degree of contrast enhancement |
Mild |
6 |
15% |
6/40 |
Moderate |
12 |
30% |
12/40 |
|
Marked |
4 |
10% |
4/40 |
|
Homogeneity of Contrast enhancement |
Homogeneous |
30 |
75% |
30/40 |
Heterogeneous |
10 |
25% |
10/40 |
|
Degree of surrounding edema |
Mild |
20 |
50% |
12/40 |
Moderate |
8 |
20% |
8/40 |
|
Marked |
2 |
5% |
2/40 |
|
Mass effect |
Mild |
4 |
10% |
4/40 |
Marked |
2 |
5% |
2/40 |
|
Cysts and/or necrosis |
4 |
10% |
2/40 |
|
Calcification |
0 |
0% |
0/40 |
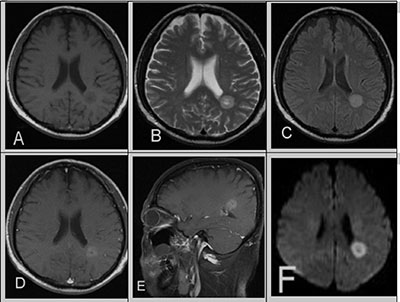
Figure 1: A 39-year-old male with a 10-year history of CML in relapse presents with headaches. (A) Unenhanced T1WI revealed a well-defined, heterogeneous brain parenchyma mass with mild hypointensity. (B) T2WI and (C) FLAIR showed hyperintensity, post-contrast. (D, E) T1WI showed mild hyperintensity and cystic changes. (F) DWI showed evidence of restricted diffusion in the corresponding area. There was no surrounding vasogenic edema or mass effect.
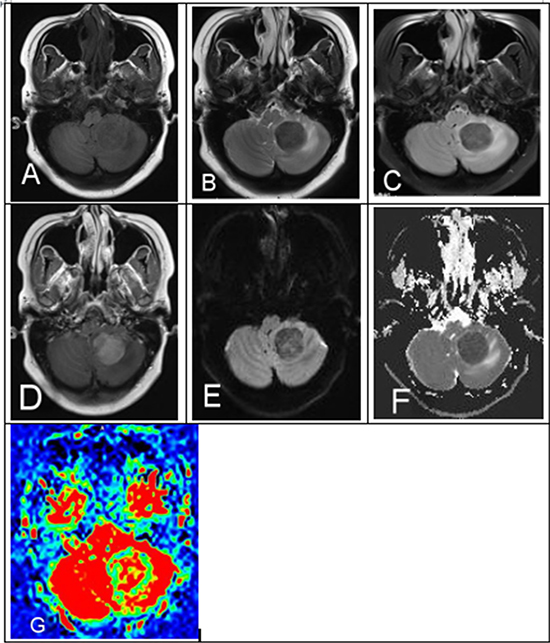
Figure 2: A 29-year-old female with a history of AML in remission presents with headaches, nausea and vomiting. (A) MRI demonstrated left cerebellum mass unenhanced T1WI, (B) T2WI, (C) FLAIR isointense-to-mild hypointense and (D) CE-T1WI showed homogenous hyperintensity. (E) DWI and (F) ADC map demonstrated mild-to-moderate restricted diffusion. (G) ASL showed mild hypointensity with mild surrounding vasogenic edema and mass effect.
Quantitative ADC values of brain MS
Maximum ADC, mean ADC, minimum ADC and P values are shown in Table 3. The maximum ADC value of brain MS (450 ± 60 × 10-6 mm2/sec) is lower than the minimum ADC value of normal brain (600 ± 60 × 10-6 mm2/sec). The mean and minimum ADC values of brain MS are lower than the ADC values of normal brain. This shows a marked restricted diffusion in brain MS. P = 0.001.
Table 3: ADC Values in myeloid sarcoma and normal brain
ADC of MS |
Maximum ADC |
450 ± 60 ×10−6 mm2/sec |
Minimum ADC |
240 ± 40 ×10−6 mm2/sec |
|
Mean ADC |
400 ± 55 ×10−6 mm2/sec |
|
ADC of Normal Hemisphere |
Maximum ADC |
750 ± 110 ×10−6 mm2/sec |
Minimum ADC |
600 ± 70 ×10−6 mm2/sec |
|
Mean ADC |
660 ± 70 ×10−6 mm2/sec |
|
P value |
P = .001 |
Quantitative CBF values of brain MS
TBF and P values are shown in Table 4. The maximum TBF value of brain MS (46.06 ± 10.80 ml/min.100 g) is lower than the minimum CBF value of normal brain (52.08 ± 10.36 ml/min.100 g). The mean and minimum TBF values of brain MS were also lower than the CBF values of normal brain. This shows a mild-to-moderate lower perfusion in brain MS. P = 0.01.
Table 4: TBF and CBF values in myeloid sarcoma and normal brain
TBF of MS |
Maximum TBF |
46.06 ± 10.80 ml/(min.100 g) |
Minimum TBF |
28.66 ± 10.22 ml/(min.100 g) |
|
Mean TBF |
40.56 ± 11.32 ml/(min.100 g) |
|
CBF of Normal Hemisphere |
Maximum CBF |
65.55 ± 11.20 ml/(min.100 g) |
Minimum CBF |
52.08 ± 10.36 ml/(min.100 g) |
|
Mean CBF |
60.18 ± 12.64 ml/(min.100 g) |
|
P value |
P = .01 |
Evaluation of post-treatment response of brain MS
All patients underwent standard induction chemotherapy and intrathecal chemotherapy, and 4 patients also underwent radiation treatment. MRI follow-up was performed at 2 chemotherapy courses, 4 chemotherapy courses, 6 chemotherapy courses and after treatment. 80% of lesions achieved complete remission. MRI showed that these lesions turned into a cavity and were characterized by obvious hypointensity on T2WI/FLAIR and DWI versus pretreatment (Figure 3). 15% of lesions were further improved after 4 chemotherapy courses, as indicated by gradually lower MR signal intensities. 5% of lesions indicated residual disease after 6 chemotherapy courses, as indicated by hyperintensity on DWI, ADC map and CE-T1WI.
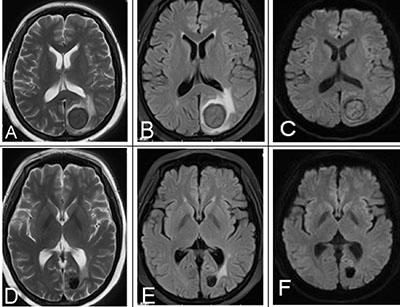
Figure 3: A 25-year-old female with a history of AML underwent chemotherapy and MRI follow-up. (A–C) MRI signal intensity was obvious and lower than pre-treatment on T2WI, FLAIR, DWI, indicating a good treatment response. (D–F) Post-treatment mass on T2WI, FLAIR, DWI.
DISCUSSION
Myeloid sarcoma (MS) is a rare manifestation of leukemias, myeloproliferative neoplasias or myelodysplastic syndromes and is composed of immature myelomonocytic cells in extramedullary sites. MS can involve any organ, but the most common sites include soft tissue, bone, skin and lymph node [4]. Survival outcomes are markedly improved when patients are diagnosed and treated early with standard induction chemotherapy or radiation [16].
Myeloid sarcoma of the central nervous system (CNS) is a rare presentation of leukemic mass infiltration outside of the bone marrow involving extramedullary sites. On rare occasions, it can also invade the brain parenchyma. Notably, all 40 lesions in our study were located in the brain parenchyma.
There are a few studies that have previously systematically analyzed CNS MS. Shinagare et al. [14] and Chaudhry et al. [15] both described brain MS lesions showing isointensity on T1WI, hyperintensity on T2WI and hyperintensity on FLAIR sequences. Similar to our study, their qualitative assessment of lesions demonstrated a restricted diffusion on DWI and revealed few susceptibility artifacts on GRE. Qualitative assessment of MS on ASL is unique to our study and demonstrated mild-to-moderate low perfusion. In a case report [17], Hakyemez et al. reported that lesions were low perfusion on dynamic susceptibility contrast (DSC) perfusion-weighted imaging (PWI) of intracranial myeloid sarcoma. We can consider these results as similar to our study. On the other hand, our study was unique in it exploration of surrounding edema and mass effect. Lesions were predominantly mild surrounding edema, and there was little mass effect. We also found cysts and/or necrosis in very few MS lesions (10%) on T2WI, FLAIR and CE-T1WI. Notably, none of the lesions had any observable calcium.
To our understanding, usage of DWI to quantitatively assess brain MS has not yet been reported. The underlying rationale of DWI is based upon the fact that narrowed extracellular space decreases the diffusion of water molecules in the extracellular space. Restricted diffusion is quantitatively measured by the apparent diffusion coefficient (ADC), which is lower in highly cellular tumors and higher in cases of edema and necrosis. DW imaging has been extensively investigated as an important diagnostic tool for the assessment of primary brain tumors, and tumor grade has been confirmed to correlate with the ADC values. High-grade brain tumors have lower ADC values than low-grade tumors and normal appearing parenchyma [18, 19]. In fact, some studies have shown that ADC value can grade for gliomas [20, 21]. In accordance with other malignant brain tumor studies, our ADC measurements of brain MS revealed mild-to-moderate values (P = 0.001 (less than .05). Based on these results, we consider the cases we studied to have mild-to-high cell density, but inferior-to-high-grade brain tumors. These results are consistent with MS pathological observations and are supportive of the prospect of utilizing brain MS ADC values to identify patients with high-grade brain tumors.
Furthermore, ADC values are useful in assessing treatment responses of brain tumors. For example, an increase in ADC after treatment is considered a good response, but a decrease in ADC after treatment is associated with tumor progression [22, 23].
To our understanding, usage of ASL to quantitatively assess brain MS has not yet been reported. ASL is an MRI perfusion technique that can be used to assess brain tumor vascularity and offer absolute quantification of CBF noninvasively. Meningiomas have high vascularity and showed the highest TBF values [24], and high-grade gliomas have higher TBF values than low-grade gliomas [25]. CNS lymphomas were found to have a mean TBF [26]. In our study, measurement of TBF revealed mild-to-moderate low TBF values in brain MS (P = 0.01), which is indicative of low perfusion in brain MS, similar to CNS lymphomas. We think it is beneficial to differentiate brain MS and other high-vascularity brain tumors, such as high-grade gliomas and meningiomas, but it is difficult to differentiate between brain MS and CNS lymphomas on ASL perfusion images.
A brain mass in a patient with a history of hematologic conditions, especially an AML, should be considered MS. Characteristic of brain MS, the MRI findings in our study were homogeneous non-calcified masses, which are T1 isointense and T2/FLAIR hyperintense with homogeneous enhancement, having mild surrounding vasogenic edema, no obvious mass effect, few cysts and/or necrosis, occasional susceptibility artifact, restricted diffusion and mild-to-moderate low ADC values, low perfusion and mild-to-moderate low TBF values. These findings have certain imaging characteristics. Our study was designed to narrow differential diagnoses by excluding inflammatory, hemorrhagic and calcific lesions. In addition, quantitative assessment of ADC and CBF can help differentiate some other brain tumors. Notably, in the diagnosis of brain MS, it is important to utilize both MRI findings and cerebrospinal fluid analysis.
MRI is a very useful method for assessing MS treatment response. Follow-up MRI found that most MS lesions turn into a cavity characterized by obvious hypointensity on T2WI/FLAIR, DWI and CE-T1WI as compared with pre-treatment. We consider these brain MS cases to have achieved complete remission. Few lesions were still hyperintense on T2WI/FLAIR, DWI, and CE-T1WI after treatment with 6 chemotherapy courses. This is indicative of residual disease, which was confirmed by cerebrospinal fluid analysis.
Our study did have some limitations. Firstly, we only included a small number of patients due to the rarity of cases with tumor in the brain parenchyma. Secondly, pathological confirmation was no acquired for every mass lesion observed in the brain. However, we believe that at least 1 pathologically proven MS in the brain in each patient provided sufficiently compelling evidence. Thirdly, we were unable to obtain a primary brain MS patient in this study due to the rarity of this tumor type. Finally, our study did not include SWI semi-quantitative assessment of intratumoral susceptibility signals (ITSS) of the brain MS lesions.
MS of the brain is a rare manifestation of extramedullary leukemia that is mostly present in AML patients. MS of the brain may be characterized by changes in MRI intensity, contrast enhancement, diffusion, perfusion and susceptibility artifact, which is highly predictive in patients with a history of hematologic disorder. MRI can become a useful assessment tool for diagnosis of MS and treatment management.
ACKNOWLEDGMENTS
The authors thank the numerous individuals who participated in this study. XWH designed and wrote the manuscript. XWH and LTD collect the cases. HTY critically reviewed the cases and contributed to the design of the manuscript. XJZ contributed to the design of and revised the manuscript. All authors read and approved the final manuscript.
CONFLICTS OF INTEREST
There are no conflicts of interest to disclose.
REFERENCES
1. Muss HB, Moloney WC. Chloroma and other myeloblastic tumors. Blood. 1973; 42:721–8.
2. Jaffe ES, Harris NL, Stein H. Tumours of haematopoietic and lymphoid tissues. Lyon: IARC Press, International Agency for Research on Cancer. 2001; 62–107.
3. Gunaldi M, Kara IO, Duman BB, Ercolak V. Primary intracerebral myeloid sarcoma. Onkologie. 2012; 35:694–7.
4. Meis JM, Butler JJ, Osborne BM, Manning JT. Granulocytic sarcoma in non-leukemic patients. Cancer. 1986; 58:2697–709.
5. Sandhu GS, Ghufoor K, Gonzalez-Garcia J, Elexpuru-Camiruaga JA. Granulocytic sarcoma presenting as cauda equina syndrome. Clin Neurol Neurosurg. 1998; 100:205–8.
6. Shinagare AB, Krajewski KM, Hornick JL, Zukotynski K, Kurra V, Jagannathan JP, Ramaiya NH. MRI for evaluation of myeloid sarcoma in adults: a single-institution 10-year experience. AJR Am J Roentgenol. 2012; 199:1193–1198.
7. Tsimberidou AM, Kantarjian HM, Wen S, Keating MJ, O'Brien S, Brandt M, Pierce S, Freireich EJ, Medeiros LJ, Estey E. Myeloid sarcoma is associated with superior event-free survival and overall survival compared with acute myeloid leukemia. Cancer. 2008; 113:1370–1378.
8. Guermazi A, Feger C, Rousselot P, Merad M, Benchaib N, Bourrier P, Mariette X, Frija J, de Kerviler E. Granulocytic sarcoma (chloroma): imaging findings in adults and children. AJR Am J Roentgenol. 2002; 178:319–325.
9. Fritz J, Vogel W, Bares R, Horger M. Radiologic spectrum of extramedullary relapse of myelogenous leukemia in adults. AJR Am J Roentgenol. 2007; 189:209–218.
10. Lee EY, Anthony MP, Leung AY, Loong F, Khong PL. Utility of FDG PET/CT in the assessment of myeloid sarcoma. AJR Am J Roentgenol. 2012; 198:1175–9. https://doi.org/10.2214/AJR.11.7743.
11. Choi EK, Ha HK, Park SH, Lee SJ, Jung SE, Kim KW, Lee SS. Granulocytic sarcoma of bowel: CT findings. Radiology. 2007; 243:752–759.
12. Noh BW, Park SW, Chun JE, Kim JH, Kim HJ, Lim MK. Granulocytic sarcoma in the head And neck: CT and MR imaging findings. Clin Exp Otorhinolaryngol. 2009; 2:66–71.
13. Seok JH, Park J, Kim SK, Choi JE, Kim CC. Granulocytic sarcoma of the spine: MRI and clinical review. AJR Am J Roentgenol. 2010; 194:485–489.
14. Shinagare AB, Krajewski KM, Hornick JL, Zukotynski K, Kurra V, Jagannathan JP, Ramaiya NH. MRI for evaluation of myeloid sarcoma in adults:a single-institution 10-year experience. AJR Am J Roentgenol. 2012;199:1193–1198.
15. Chaudhry AA, Gul M, Chaudhry AA, Dunkin J. Qualitative Assessment of Diffusion Weighted Imaging and Susceptibility Weighted Imaging of Myeloid Sarcoma Involving the Brain. J Comput Assist Tomogr. 2016; 40:61–6. https://doi.org/10.1097/RCT.0000000000000337.
16. Tsimberidou AM, Kantarjian HM, Estey E, Cortes JE, Verstovsek S, Faderl S, Thomas DA, Garcia-Manero G, Ferrajoli A, Manning JT, Keating MJ, Albitar M, O'Brien S, et al. Outcome in patients with nonleukemic granulocytic sarcoma treated with chemotherapy with or without radiotherapy. Leukemia. 2003; 17:1100–1103.
17. Hakyemez B, Yildirim N, Taskapilioglu O, Erdogan C, Aker S, Yilmazlar S, Parlak M. Intracranial myeloid sarcoma: conventional and advanced MRI findings. Br J Radiol. 2007; 80:e109–12.
18. Nagar VA, Ye JR, Ng WH, Chan YH, Hui F, Lee CK, Lim CC. Diffusion-weighted MR imaging: diagnosing atypical or malignant meningiomas and detecting tumor dedifferentiation. AJNR Am J Neuroradiol. 2008; 29:1147–52.
19. Koral K, Mathis D, Gimi B, Gargan L, Weprin B, Bowers DC, Margraf L. Common pediatric cerebellar tumors: correlation between cell densities and apparent diffusion coefficient metrics. Radiology. 2013; 268:532–7. https://doi.org/10.1148/radiol.13121362.
20. Kang Y, Choi SH, Kim YJ, Kim KG, Sohn CH, Kim JH, Yun TJ, Chang KH. Gliomas: Histogram analysis of apparent diffusion coefficient maps with standard or high-b-value diffusion-weighted MR imaging-correlation with tumor grade. Radiology. 2011; 261:882–90. https://doi.org/10.1148/radiol.11110686.
21. Brasil Caseiras G, Ciccarelli O, Altmann DR, Benton CE, Tozer DJ, Tofts PS, Yousry TA, Rees J, Waldman AD, Jäger HR. Low-grade gliomas: six-month tumor growth predicts patient outcome better than admission tumor volume, relative cerebral blood volume, and apparent diffusion coefficient. Radiology. 2009; 253:505–12. https://doi.org/10.1148/radiol.2532081623.
22. Jain R, Scarpace LM, Ellika S, Torcuator R, Schultz LR, Hearshen D, Mikkelsen T. Imaging response criteria for recurrent gliomas treated with bevacizumab: role of diffusion weighted imaging as an imaging biomarker. J Neurooncol. 2010; 96:423–431.
23. Yamasaki F, Kurisu K, Aoki T, Yamanaka M, Kajiwara Y, Watanabe Y, Takayasu T, Akiyama Y, Sugiyama K. Advantages of high b-value diffusion-weighted imaging to diagnose pseudo-responses in patients with recurrent glioma after bevacizumab treatment. Eur J Radiol. 2012; 81:2805–2810.
24. Järnum H, Steffensen EG, Knutsson L, Fründ ET, Simonsen CW, Lundbye-Christensen S, Shankaranarayanan A, Alsop DC, Jensen FT, Larsson EM. Perfusion MRI ofbrain tumours: a comparative study of pseudo-continuous arterial spinlabelling and dynamic susceptibility contrast imaging. Neuroradiology. 2010; 52:307–17. https://doi.org/10.1007/s00234-009-0616-6.
25. Wolf RL, Wang J, Wang S, Melhem ER, O'Rourke DM, Judy KD, Detre JA. Grading of CNS neoplasms using continuous arterial spin labeled perfusion MR imaging at 3 Tesla. J Magn Reson Imaging. 2005; 22:475–482.
26. Weber MA, Zoubaa S, Schlieter M, Jüttler E, Huttner HB, Geletneky K, Ittrich C, Lichy MP, Kroll A, Debus J, Giesel FL, Hartmann M, Essig M. Diagnostic performance of spectroscopic and perfusion MRI for distinction of brain tumors. Neurology. 2006; 66:1899–906.