
INTRODUCTION
Breast cancer is the most frequently diagnosed cancer and the leading cause of cancer death among females worldwide [1]. The incidence of breast cancer is still rising, especially in South America, Africa, and Asia [1–2]. Early diagnosis is usually considered to be central to reducing the mortality of breast cancer. Although population-based mammographic screening [3] has contributed to the reduction of death rate of breast cancer in North America and some well-developed European countries, the cost limits its application in developing countries [4]. Therefore, relatively inexpensive tumor biomarkers are also needed.
Circulating cell-free DNA (cfDNA) is the tumor-derived fragmented extracellular DNA which has been detected in human body fluids. As early as 1977, Leon et al. have reported that breast cancer patients contained increased cfDNA in their serum [5]. With advances in knowledge and technology, detection of cfDNA has been applied in prenatal diagnosis [6], disease surveillance, and tumor diagnosis [7]. From cfDNA, we can obtain information regarding cancer, including gene mutations, copy number variation and DNA integrity [8–11]. Quantification of cfDNA has emerged to be a possible tool for early diagnosis of cancers, which has been confirmed in liver cancer and non-small cell lung cancer [12–13]. Numerous clinical studies [14–17] have emphasized that the concentration of cfDNA can be used to distinguish between malignant breast cancer and benign breast nodules. However, there are still inconsistencies in these results and a systematic analyses are required to confirm its diagnostic accuracy. Thus, this meta-analysis was designed to investigate the value of cfDNA quantification as a biomarker for breast cancer and assess the possible factors that influenced the diagnostic efficiency.
MATERIALS AND METHODS
Data sources and searches
Four main databases were searched for related studies: PubMed, EMBASE, Web of Science and Cochrane library (from 2000 to October 2016), without language limitations. The combinations of search terms included “breast neoplasms,” “cell-free,” “DNA,” and all of their possible variations. The search strategy was manually adapted according to the citation lists of retrieved articles for sensitivity.
Study selection
Inclusion criteria consisted of studies in breast cancer and availability of diagnostic data, such as area under the receiver operating characteristic (ROC) curve, specificity and sensitivity. No restrictions on methodology or types of the study were included. Case reports, reviews, conference presentations and duplications were excluded. Two independent reviewers, Z. Liu and H. Wang, evaluated the eligibility of studies. Disagreements were resolved by consensus.
Data extraction
All the data analyzed were from published papers. Predesigned forms were applied in data collecting. Details listed as follows: first author, year of publication, country, type of study, numbers of cases categorized by age, estrogen receptor (ER), progesterone receptor (PR), human epidermal growth factor receptor 2 (HER-2), tumor stage, and lymph mode metastasis. Sample materials, testing methods, reference genes were collected as well. Diagnostic data was directly extracted from articles or estimated from ROC curves based on the Youden index (sensitivity+specificity-1), as others have published [13, 18]. When nuclear DNA and mitochondria DNA were both measured, the former was used in the analysis.
Quality assessment
Quality assessment was conducted according to Quality Assessment of Diagnostic Accuracy Studies (QUADAS-2) [19, 20], which is composed of four domains: patient selection, index test, reference standard, and flow and timing. For each domain, the risk of bias and concerns about applicability were evaluated and rated (low risk, high risk, and unclear). The results of the quality assessment were used to investigate potential sources of heterogeneity. Two reviewers scored all the studies independently. Different opinions were discussed until an agreement was reached. If the two reviewers can’t reach consensus since the quality of the article was dissatisfying, it would be excluded.
Statistical analysis
Fourfold tables (tables) for diagnostic test were rebuilt according to the primary publications. Pooled analysis for sensitivity, specificity positive likelihood ratio (PLR), negative likelihood ratio (NLR), and area under the ROC curve (AUC) with their corresponding 95% confidence intervals (95% CI) were calculated using the bivariate random effects model. The diagnostic accuracy for discriminating between breast cancer patients and healthy individuals or patients with benign breast disease were presented as diagnostic odds ratios (DORs) with 95% CI. The statistical heterogeneity was tested through the Q statistic and the variation in OR attributable to heterogeneity was evaluated by statistic. The source of heterogeneity was further investigated using meta-regression and subgroup analyses based on regions, time points of sample collection, sample materials, test methods, and reference genes. The test of publication bias was performed according to the methods described by Deeks et al. [21]. Sensitivity analysis was carried out using leave-one-out method, which is also named influence analysis. All statistical analyses were calculated in STATA v14.0 (Stata Corporation, TX). Statistical significance was defined as P < 0.05.
RESULTS
Study characteristics and quality assessment
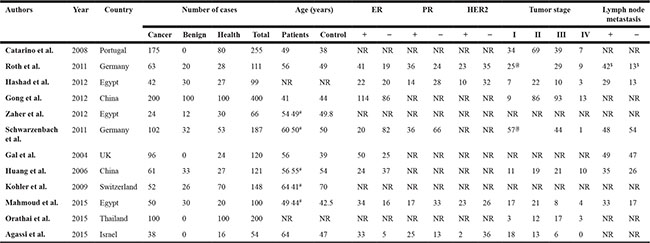
A total of 1385 records were retrieved and 12 studies [14–16, 22–30] involving 1807 people met the eligibility criteria (Figure 1). The characteristics of these are included were summarized in Table 1. All the trials were retrospective studies, which involved 8 countries (Portugal, Germany, United Kingdom, Switzerland, Egypt, Israel, China, and Thailand) and 3 regions (Europe, Middle East, and East Asia). Amongst the 12 studies, 1003 primary breast cancer patients and 575 healthy individuals were included; 283 cases with benign breast disease were involved in 8 studies. Eight included studies used quantitative PCR based methods, though they varied in the process of DNA extraction and the choice of reference genes. The other four used fluorescence quantitative analyses. Out of the 12 studies, 8 collected samples of plasma or serum before treatment (surgery or chemotherapy), the others collected samples after surgery. Most breast cancers patients were diagnosed in their fifties and were in stage II~III. Details of reference genes, cut-off values and AUCs in each study were summarized in Table 2. Information of Pre-analytical procedures of cfDNA quantification were listed in Supplementary Table 1.
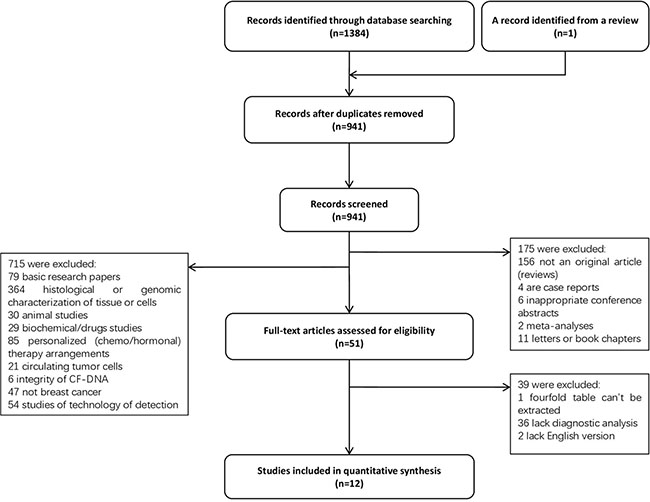
Figure 1: Flow diagram of included studies in this meta-analysis. #, the average age of patients who have benign breast disease; $, only parameters of M0 patients are available; @, total numbers of patients in stage I and II; NR, not reported.
Table 1: Basic characteristics of the included studies
#, average age of patients who have benign breast disease
$, only parameters of M0 patients are available
@, total number of patients in stage I and II
NR, not reported
Table 2: Summary of outcomes of the included studies
Authors |
Time of sample collection |
Material |
Test method |
Reference gene |
Cutoff value |
AUC |
|---|---|---|---|---|---|---|
Catarino et al. |
after/before surgery |
plasma |
real-time qPCR |
hTERT |
106.0 ng/mL |
NR |
Roth et al. |
after surgery before therapy |
serum |
Quant-iT PicoGreen |
/ |
NR |
0.77 |
Hashad et al. |
before surgery or therapy |
plasma |
real-time qPCR |
hTERT |
34 ng/mL |
NR |
Gong et al. |
before surgery or therapy |
Serum |
real-time qPCR |
GAPDH |
471 ng/ml |
0.93 |
Zaher et al. |
before surgery or therapy |
serum |
Quant-iT PicoGreen |
/ |
600 ng/μL |
0.96 |
Schwarzenbach et al. |
before surgery |
serum |
fluorescence-labelled PCR |
D13S159 D13S280 D13S282 D10S1765 |
NR |
0.66 |
Gal et al. |
before surgery |
serum |
real-time qPCR |
β-globin |
NR |
0.92 |
Huang, et al. |
Before surgery and therapy |
plasma |
real-time qPCR |
β-globin |
19 ng/mL |
0.95 |
Kohler et al. |
Before surgery or therapy |
plasma |
multiplex real-time qPCR |
GAPDH & MTATP 8 |
1866 GE/mL |
0.80 |
Mahmoud et al. |
before surgery |
plasma |
multiplex real time PCR |
GAPDH & MTATP 8 |
2236 copy/μL |
0.79 |
Orathai et al.. |
after/before surgery |
plasma |
QubitTM fluorometer |
/ |
90 ng/ml |
0.96 |
Agassi et al. |
before surgery or therapy |
serum |
fluorescent SYBR Gold stain |
/ |
600 ng/ml |
0.83 |
NR, not reported
Evaluation of the risk of bias and concerns regarding applicability are graphically displayed in Supplementary Table 2. Gal et al. [26] arranged four groups of breast cancer patients, all the other studies reported that the patients were consecutive or random in a certain period of time. All patients included had clear diagnosis with pathological evidence. In general, all studies met the predefined criteria for our review questions and were high in applicability.
Screening and diagnosis value of cfDNA quantification for BC
All studies reported data for discriminating between breast cancer and healthy controls, and showed that high levels of cfDNA significantly pointed to breast cancer. The scatter plot showed in Supplementary Figure 1 and calculation of Harbord test indicated that no significant publication bias (P = 0.56) and no small-study effects (P = 0.67) were detected. The pooled sensitivity was 84% [95% CI, 71~92%; I2 = 95.14%, Q = 226.26 (P < 0.01)] and specificity was 85% [95% CI, 79~90%; I2 = 77.74%, Q = 49.43 (P < 0.01); Figure 2A]. PLR and NLR were 5.7 (95% CI, 3.8–8.5) and 0.19 (95% CI, 0.10–0.36), respectively. The DOR value measured 27.63 (95% CI, 10.96~69.61; I2 = 86.2%, P < 0.001; Figure 2B), and estimation of summary ROC (SROC) curve displayed an AUC of 0.91 (95% CI, 0.17~1.00; Figure 2C), indicating a good discriminatory accuracy for breast cancer versus healthy individuals.
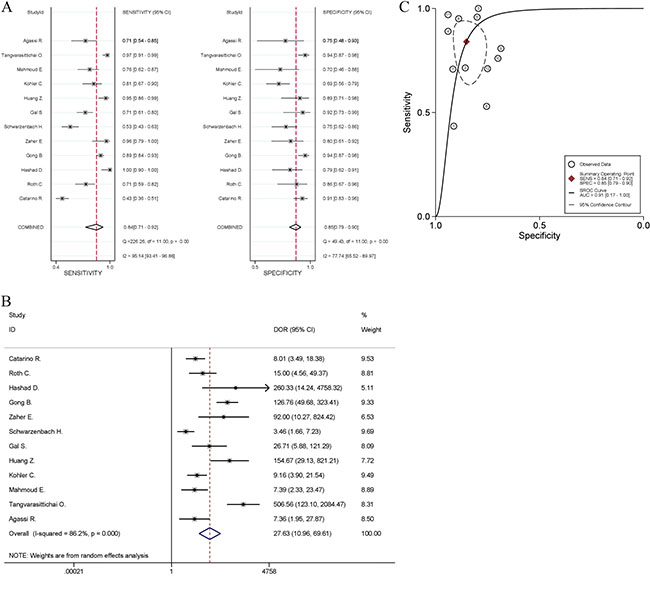
Figure 2: Meta-analysis of the power of cfDNA quantification to discriminate between breast cancer and healthy controls. (A) Sensitivity and specificity, (B) diagnostic odds ratio, and (C) summary receiver operating characteristic (ROC) curve. The odds ratios for each trial are represented by squares, and the horizontal line crossing the square represents the 95% confidence interval (CI). The diamonds represent the estimated pooled effect.
Eight studies included patients with benign breast disease, however, only four of them [23–24, 27–28] had diagnostic data available for pooled quantitative analyses. For these four studies, the pooled sensitivity and specificity were 0.86 (95% CI, 78~92%; Q = 9.51, I2 = 68.54%, P = 0.02) and 85% (95% CI, 65~95%; Q = 21.60, I2 = 86.11%, P < 0.01), respectively (Figure 3A). The pooled DOR was 35.30 (95% CI, 7.58~164.39; Figure 3B), which had significant heterogeneity (I2 = 79.9%, P = 0.002). The area under the SROC curve was 0.91 (95% CI, 0.89~0.93; Figure 3C). Both DOR and AUC suggested that the quantification of cfDNA might become a diagnostic tool in differentiating breast cancer from benign lesions.
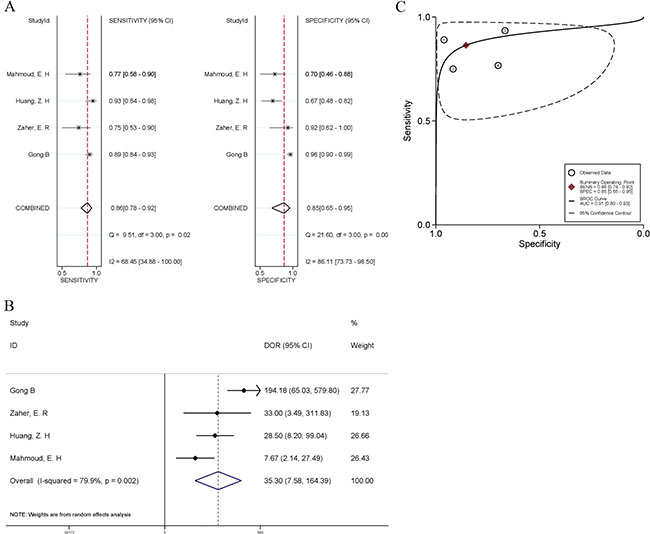
Figure 3: Forest plots of the sensitivity and specificity (A), diagnostic odds ratio (B), and summary receiver operating characteristic (SROC) curve (C) for cfDNA quantification in the discrimination between breast cancer and benign breast disease. The odds ratios for each trial are represented by squares, and the horizontal lime crossing the square represents the 95% confidence interval (CI). The diamonds represent the estimated pooled effect.
The concentration of cfDNA was also associated with molecular subtypes of breast cancer and nodal status (Supplementary Table 3). Although cfDNA levels were not associated with ER or PR, they were significantly higher in HER-2-positive patients than in HER-2-negative patients [15, 28]. Most researchers [15, 25–28, 30–31] showed a higher level of cfDNA in node-positive patients compared to node-negative patients, and as more lymph nodes are involved, more cfDNA could be detected in circulation [28]. Also, two studies [15, 30] reported significant differences in the level of cfDNA between node-positive patients and node-negative patients, which suggested that the concentration of cfDNA might be a possible marker of early lymph node metastasis in breast cancer.
Major clinical heterogeneity sources
To find the source of heterogeneity, firstly, random effects meta-regression analysis was used to assess covariates involved in these studies. Factors including “regions (Europe, Middle East, and East Asia)”, “sample materials (plasma or serum)”, “test methods (polymerase chain reaction (PCR)-based or not)”, “time of sample collection (before or after treatment)”, and “Method of extraction (QIAamp DNA Blood Mini Kit, Qiagen DNA Blood Mini Kit, Nucleic-Spino Plasma XS Kit, and Other)” were included in univariate analysis. The results suggested that “regions” accounted for most of heterogeneity and explained 82.54% between-study variance. Although “test methods” alone was not responsible for the heterogeneity (Coef. = 0.70, 95% CI, -1.64~3.04, P = 0.53), in multivariate analysis, “test methods” and “regions” altogether explained 87.09% of the between-study variance. The other factors could not explain the heterogeneity, and details of the calculation were showed in Table 3.
Table 3: Meta-regression of effects of study characteristics on diagnostic accuracy of cfDNA quantification
Variable |
Regression Coefficient (95% CI) |
SE |
P |
I2 (95% CI) |
|
|---|---|---|---|---|---|
Area |
Europe |
−3.14 (−4.74 to −1.54) |
0.71 |
0.002 |
54.67% |
Middle East |
−2.49 (−4.36 to −0.61) |
0.83 |
0.15 |
||
Sample material |
Plasma (vs. serum) |
0.61 (−1.61 to 2.83) |
0.99 |
0.55 |
87.31% |
Test method |
Not PCR-based (vs. PCR- based) |
0.70 (−1.64 to 3.04) |
1.05 |
0.53 |
86.31% |
Time of sample collection |
Before (vs. after) |
−0.35 (−2.88 to 2.18) |
1.14 |
0.76 |
87.23% |
Method of extraction |
Nucleic-Spino Plasma XS Kit |
2.22 (−1.73 to 6.17) |
1.71 |
0.23 |
82.82% |
QIAamp DNA Blood Mini Kit |
−0.50 (−3.84 to 2.84) |
1.45 |
0.74 |
||
Other (except Qiagen DNA extraction MiniKit) |
−0.30 (−3.63 to 3.03) |
1.44 |
0.84 |
||
Area & Test Method |
Europe |
−3.06 (−4.66 to −1.46) |
0.69 |
0.002 |
52.17% |
Middle East |
−2.66 (−4.58 to −0.75) |
0.83 |
0.012 |
||
Not PCR-based |
0.67 (−0.85 to 2.19) |
0.66 |
0.341 |
SE, standard error.
The geographical grouping (Europe, Middle East, and East Asia) contained the differences in ethnic and genetic characteristics in these regions, thus, subgroup analysis was used to further evaluate the accuracy of diagnosis test in each region. As shown in Figure 4, the pooled DOR for cfDNA test were 8.54 (95% CI, 4.54–16.07; I2 = 53.0%, P = 0.074) in Europe, 22.84 (95% CI, 4.89–106.76; I2 = 68.66%, P = 0.023) in Middle East, and 195.21 (95% CI, 83.96–453.85; I2 = 23.6%, P = 0.270) in East Asia. The diagnostic performance in East Asia increased dramatically while the heterogeneity went down to a low level. Pooled analysis of European studies showed moderate heterogeneity, however, the DOR did not indicate fairly good discriminatory test performance. Many other factors still needed to be considered and analyzed in studies from Middle East.
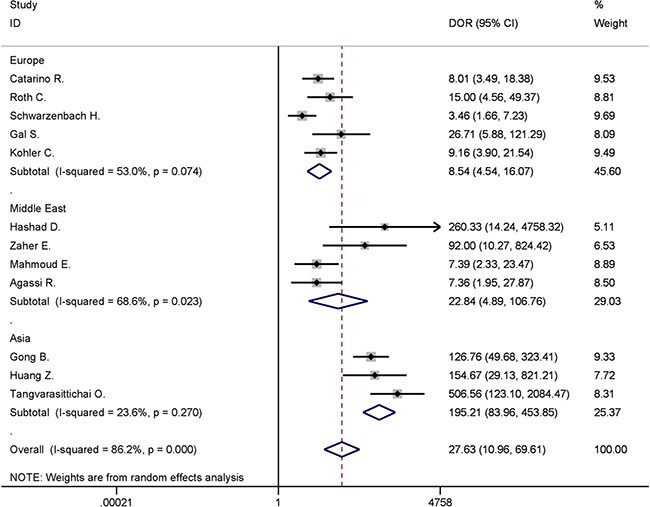
Figure 4: Forest plot for subgroup analysis of different areas in discriminating between breast cancer and healthy controls.
Sensitivity analysis, using leave-one-out sensitivity analysis (Supplementary Figure 2) with a random effect model, revealed that the pooled effect estimates would not be influenced by any single study and maintain their stability.
DISCUSSION
The incidence and mortality of breast cancer in less developed countries are still increasing. Early screening and reliable diagnosis are essential for breast cancer treatment. Various investigations [14–16, 22–34] have demonstrated that the quantification of cfDNA was potentially an effective biomarker for breast cancer diagnosis. In this meta-analysis, quantification of cfDNA as a screening tool for breast cancer had a pooled sensitivity of 84% and a pooled specificity of 85%. The DOR was 27.63 and the AUC value was 0.91, which reached a high level of evaluation criteria and indicated a high degree of overall diagnostic accuracy. The cfDNA level was reported higher in HER-2 or node positive patients but was not associated with ER and PR status. Subgroup and meta-regression analyses found “regions” was the main source of heterogeneity, revealing the heterogeneity of breast cancer among ethnic groups. Additionally, as a diagnostic tool, high level of cfDNA also pointed to a higher risk of breast cancer, with a DOR of 35.30 and an AUC of 0.91, indicating a diagnostic value of cfDNA quantification for breast cancer.
Sources of heterogeneity was evaluated by meta-regression and subgroup analyses. Nearly 90 percent of the heterogeneity could be explained by the mixed effect of “regions” and “test method”, and the former is the main factor. Subgroup analysis provided more details of the ethnicity-based regional grouping. The heterogeneity between three studies from East Asia [23, 27, 29] decreased to a quite low level (I2 < 30.0%), and studies from China [23, 27] had no heterogeneity (I2 = 0%), both of which used real-time quantification PCR. Four studies from Middle East were done in Egypt and Israel, and there remained moderate heterogeneity within this subgroup. The major covariate affecting these trials was “testing method”: Hadshad et al. [15] and Mahmoud et al. [28] quantified cfDNA with PCR-based detection method. Zaher et al. used a fluorescence-based DNA assay kit (PicoGreen), and Agassi et al. chose a fluorescent dye [35] to measure cfDNA directly in the diluted samples. Pre-analytical procedures of cfDNA quantification do add heterogeneity according to the information we collected (Supplementary Table 1), however, only 14.50% of between-study variance was explained by “method of extraction”. Missing information and changing methods hindered further analyses, and excessive confounding factors can also lead to unreliable analysis results. Generally, PCR is regarded as a more sensitive approach in the quantification of cfDNA, however, the standardization of cfDNA quantification methods remains one of the problems confronted in the way of further clinical application. Therefore, we recommend a unified technique in future studies of cfDNA at least in a specific region, in order to guarantee the sensitivity of detection and establish guidelines in this area.
Recently, Lin et al. [36] published a meta-analysis to comprehensively evaluate the cfDNA-based early detection methods for BC. They included literature measuring cfDNA quantification, integrity, methylations, loss of heterogeneity and etc., which resulted in heterogeneity between studies. In this meta-analysis, we only included studies containing DNA quantification results. Measured by the same inclusion criteria, more studies could be included in our study (n = 12 vs. n = 9). Our comprehensive literature search was supported by a lack of evidence for publication bias through Deeks and Harbord test. Although significant heterogeneity was observed in their study, Lin et al. demonstrated that none of the methodological covariates (“country” and “assay methods”) produced major heterogeneity (P > 0.05) in meta-regression analysis. This may be caused by the loose inclusion criteria, which introduced too many influencing factors. Moreover, among the data from Kohler et al.’s study [16], Lin et al. mistook the results of screening test using mitochondrial DNA (mtDNA) quantification (cut-off: 463282 GE/ml; sensitivity: 53%; specificity: 87%; P < 0.001) for distinguishing BC from patients with benign breast diseases.
However, there remain limitations in our meta-analysis. Firstly, due to the restriction of systematic review and meta-analysis, only population-level data could be extracted; more correlation of subtypes defined by ER, PR or HER-2 as well as lymph node metastasis could not be further analyzed. Secondly, there remained about 1need a space: 10% heterogeneity which did not have clear source. At the pre-analytical phase of cfDNA quantification, the methods of cfDNA extraction and the following assessment lacked standard protocols, which may lead to heterogeneity [37].
In conclusion, this meta-analysis suggests that the quantification of cfDNA can be a potential biomarker for accurately discriminating BC patients from healthy individuals. Sensitivity analyses using various criteria to improve the quality of included studies or reduce the systematic errors in the process of calculation did not alter the results substantially, suggesting that the results of our meta-analysis are robust. Combination of cfDNA quantification and other biomarkers maybe a future direction in BC early diagnosis.
Abbreviations
cfDNA, cell-free DNA; CI, confidence interval; DOR, diagnostic odds ratio; SROC, summary receiver operating characteristic curve; ER, estrogen receptor; PR, progesterone receptor; HER-2, human epidermal growth factor receptor-2; QUADAS-2, Quality Assessment of Diagnostic Accuracy Studies (2nd edition); PLR, positive likelihood ratio; NLR, negative likelihood ratio; ROC, receiver operating characteristic curve; AUC, area under the ROC curve.
CONFLICTS OF INTEREST
The authors declare no conflicts of interest.
FUNDING
This work was supported by the National Natural Science Foundation of China (81572592, 81602635, 81502398), the Zhejiang Province Preeminence Youth Fund (LR16H160001), the Zhejiang Natural Sciences Foundation Grant (LY15H160025, LQ16H160003), the Hangzhou Health and Family Planning Commission Fund (2014A61), and the Zhejiang medical innovative discipline construction project-2016.
REFERENCES
1. Torre LA, Bray F, Siegel RL, Ferlay J. Global Cancer Statistics , 2012. CA Cancer J Clin. 2015; 65:87–108.
2. Althuis MD, Dozier JM, Anderson WF, Devesa SS, Brinton LA. Global trends in breast cancer incidence and mortality 1973–1997. Int J Epidemiol. 2005; 34:405–12.
3. Bleyer A, Welch HG. Effect of Three Decades of Screening Mammography on Breast-Cancer Incidence. N Engl J Med. 2012; 367:1998–2005.
4. Anderson BO, Cazap E, El Saghir NS, Yip CH, Khaled HM, Otero IV, Adebamowo CA, Badwe RA, Harford JB. Optimisation of breast cancer management in low-resource and middle-resource countries:executive summary of the Breast Health Global Initiative consensus, 2010. Lancet Oncol. 2010; 12:387–98.
5. Leon SA, Shapiro B, Sklaroff DM, Yaros MJ. Free DNA in the Serum of Cancer Patients and the Effect of Therapy. Cancer Res. 1977; 37:646–50.
6. Yin A, Peng C, Zhao X, Caughey BA, Yang J, Liu J, Huang W, Liu C, Luo D, Liu H, Chen Y, Wu J, Hou R, et al. Noninvasive detection of fetal subchromosomal abnormalities by semiconductor sequencing of maternal plasma DNA. Proc Natl Acad Sci USA. 2015; 112:14670–5.
7. Vendrell J, Mau-Them F, Béganton B, Godreuil S, Coopman P, Solassol J. Circulating Cell Free Tumor DNA Detection as a Routine Tool for Lung Cancer Patient Management. Int J Mol Sci. 2017; 18:264:1–19.
8. Schwarzenbach H, Pantel K. Circulating DNA as biomarker in breast cancer. Breast Cancer Res. 2015; 17:136:1–9.
9. Madhavan D, Wallwiener M, Bents K, Zucknick M, Nees J, Schott S, Cuk K, Riethdorf S, Trumpp A, Pantel K, Sohn C, Schneeweiss A, Surowy H, et al. Plasma DNA integrity as a biomarker for primary and metastatic breast cancer and potential marker for early diagnosis. Breast Cancer Res Treat. 2014; 146:163–74.
10. Zikan M, Lempiäinen H. DNA methylation markers for early detection of women ’ s cancer: promise and challenges. Epigenomics. 2014; 6:311–27.
11. Mcanena P, Brown JA, Kerin MJ. Circulating Nucleosomes and Nucleosome Modifications as Biomarkers in Cancer. Cancers (Basel). 2017; 9:1–18.
12. Liao W, Mao Y, Ge P, Yang H, Xu H, Lu X, Sang X, Zhong S. Value of Quantitative and Qualitative Analyses of Circulating Cell-Free DNA as Diagnostic Tools for Hepatocellular Carcinoma. Medicine (Baltimore). 2015; 94:e722.
13. Jiang T, Zhai C, Su C, Ren S, Zhou C. The diagnostic value of circulating cell free DNA quantification in non-small cell lung cancer: A systematic review with meta-analysis. Lung Cancer. 2016; 100:63–70.
14. Roth C, Pantel K, Müller V, Rack B, Kasimir-bauer S, Janni W, Schwarzenbach H. Apoptosis-related deregulation of proteolytic activities and high serum levels of circulating nucleosomes and DNA in blood correlate with breast cancer progression. BMC Cancer. 2011; 11:4:1–12.
15. Hashad D, Sorour A, Ghazal A, Talaat I. Free Circulating Tumor DNA as a Diagnostic Marker for Breast Cancer. J Clin Lab Anal. 2012; 26:467–72.
16. Kohler C, Radpour R, Barekati Z, Asadollahi R, Bitzer J, Wight E, Bürki N, Diesch C, Holzgreve W, Zhong XY. Levels of plasma circulating cell free nuclear and mitochondrial DNA as potential biomarkers for breast tumors. Mol Cancer. 2009; 8:105:1–8.
17. Oliver J. S, Lehner J, Fersching-Gierlich D, Nagel D, Holdenrieder S. Diagnostic relevance of plasma DNA and DNA integrity for breast cancer. Tumor Biol. 2014; 35:1183–91.
18. Vera-Badillo FE, Templeton AJ, de Gouveia P, Diaz-Padilla I, Bedard PL, Al-Mubarak M, Seruga B, Tannock IF, Ocana A, Amir E. Androgen Receptor Expression and Outcomes in Early Breast Cancer: A Systematic Review and Meta-Analysis. J Natl Cancer Inst. 106:1–11.
19. Whiting PF, Rutjes AW, Westwood ME, Mallett S, Deeks JJ, Reitsma JB, Leeflang MM, Sterne JA, Bossuyt PM; QUADAS-2 Group. QUADAS-2: A Revised Tool for the Quality Assessment of Diagnostic Accuracy Studies. Ann Intern Med. 2011; 155:529–36.
20. Andreano A, Rechichi G, Rebora P, Sironi S, Valsecchi MG. MR diffusion imaging for preoperative staging of myometrial invasion in patients with endometrial cancer: a systematic review and meta-analysis. Eur Radiol. 2014; 24:1327–38.
21. Deeks JJ, Macaskill P, Irwig L. The performance of tests of publication bias and other sample size effects in systematic reviews of diagnostic test accuracy was assessed. J Clin Epidemiol. 2005; 58:882–93.
22. Catarino R, Ferreira MM, Rodrigues H, Coelho A. Quantification of Free Circulating Tumor DNA as a Diagnostic Marker for Breast Cancer. DNA Cell Biol. 2008; 27:415–21.
23. Gong B, Xue J, Yu J, Li H, Hu H, Yen H, Hu J, Dong Q, Chen F. Cell-free DNA in blood is a potential diagnostic biomarker of breast cancer. Oncol Lett. 2012; 3:897–900.
24. Zaher ER, Anwar MM, Kohail HMA, El-zoghby SM, Abo-el-eneen MS. Value of circulating DNA concentration and integrity as a screening test for detection of cancer in an Egyptian cohort. Alexandria J Med. 2012; 48:187–96.
25. Schwarzenbach H, MuLler V, Milde-langosch K, Steinbach B, Pantel K. Evaluation of cell-free tumour DNA and RNA in patients with breast cancer and benign breast disease. Mol Biosyst. 2011; 7:2848–54.
26. Gal S, Fidler C, Lo YM, Taylor M, Han C, Moore J, Harris AL, Wainscoat JS. Quantitation of circulating DNA in the serum of breast cancer patients by real-time PCR. Br J Cancer. 2004; 90:1211–5.
27. Huang ZH, Li LH, Hua D. Quantitative analysis of plasma circulating DNA at diagnosis and during follow-up of breast cancer patients. Cancer Lett. 2006; 243:64–70.
28. Mahmoud EH, Fawzy A, Ahmad OK, Ali AM. Plasma Circulating Cell-free Nuclear and Mitochondrial DNA as Potential Biomarkers in the Peripheral Blood of Breast Cancer Patients. Asian Pac J Cancer Prev. 2015; 16:8299–305.
29. Tangvarasittichai O, Jaiwang W. The Plasma DNA Concentration as a Potential Breast Cancer Screening Marker. Ind J Clin Biochem. 2015; 30:55–8.
30. Agassi R, Czeiger D, Shaked G, Avriel A, Sheynin J, Lavrenkov K, Ariad S, Douvdevani A. Measurement of circulating cell-free DNA levels by a simple fluorescent test in patients with breast cancer. Am J Clin Pathol. 2015; 143:18–24.
31. Zaher ER, Anwar MM, Kohail HM, El-Zoghby SM, Abo-El-Eneen MS. Cell-free DNA concentration and integrity as a screening tool for cancer. Indian J Cancer. 2013; 50:175–83.
32. Burwinkel B. Plasma DNA integrity as a biomarker for primary and metastatic breast cancer and potential marker for early diagnosis. Breast Cancer Res Treat. 2014; 146:163–74.
33. Ibrahim IH, Kamel MM, Ghareeb M. Circulating DNA in Egyptian Women with Breast Cancer. Asian Pac J Cancer Prev. 2016; 17:2989–93.
34. Shaw JA, Charles R, Payne R, Lee B, Hava N. Circulating tumor cells and plasma DNA analysis in patients with indeterminate early or metastatic breast cancer. Biomarkers Med. 2011; 5:87–91.
35. Goldshtein H, Hausmann MJ, Douvdevani A. A rapid direct fluorescent assay for cell-free DNA quantification in biological fluids. Ann Clin Biochem. 2009; 46:488–94.
36. Lin Z, Neiswender J, Fang B, Ma X, Zhang J, Hu X. Value of circulating cell-free DNA analysis as a diagnostic tool for breast cancer: a meta-analysis. Oncotarget. 2017; 8:26625–36. https://doi.org/10.18632/oncotarget.15775.
37. Hyun KA, Kim J, Gwak H, Jung HI. Isolation and enrichment of circulating biomarkers for cancer screening, detection, and diagnostics. Analyst. 2016; 141:382–92.