
INTRODUCTION
Metastasis is the spread of cancer cells from the original tumor to other sites of the body through the tumor vasculature and lymphatics; for most solid tumors, it is the major cause of death. Despite our increasing knowledge on tumorigenesis and metastasis, our current understanding cannot fully explain the molecular mechanisms underlying the progression of metastasis.
The tumor microenvironment comprises infiltrating immune cells, endothelial cells, and stromal fibroblasts, which may provide the growth factors and cytokines that promote tumor growth, survival, and invasion [1]. It has been shown that cross-talk between tumor cells and stromal cells is required for the promotion and progression of cancer [2]. In the tumor microenvironment, stromal cells and cancer cells produce various chemokines that control tumor growth and progression [2–4], and emerging evidence shows that a variety of chemokine receptors are highly expressed on tumor cells and involved in tumor growth and metastasis [1, 4, 5]. In human breast cancer cells, chemokine receptors such as CXC chemokine receptor 4 (CXCR4) and CC motif chemokine receptor 7 (CCR7) are overexpressed and are involved in chemotactic and invasive responses [1, 5].
CCR1, a member of the seven-transmembrane G-protein-coupled receptor family, is widely expressed in many cell types and is involved in the activation and trafficking of immune cells, including neutrophils, monocytes, and lymphocytes [6]. CCR1 binds to multiple cytokines, including CCL3 (or MIP-1α), CCL5 (or RANTES), CCL7 (or MCP-3), CCL8 (or MCP-2), CCL14, CCL15 (or Leukotactin-1), CCL16, and CCL23 (or MPIF-1). CCR1 is highly expressed in diverse cancers, including prostate cancer cells, ovarian cancer, multiple myeloma, and hematolymphoid neoplasia [7–11]. Previous studies have demonstrated that CCR1 promotes the invasion of PC3 prostate cancer [7], hepatocellular carcinoma [12], ovarian cancer stem-like [9], and non-small cell lung cancer [13, 14] cells. These results indicate that CCR1 is associated with the progression of tumor invasion and metastasis [15]. In addition, CCR1 and its ligand CCL5 are highly expressed in ovarian cancer stem-like cells, suggesting the idea of a possible autocrine loop that maintains metastatic capability [9]. However, it remains largely unknown whether CCR1 is overexpressed in breast cancer tissues, and whether CCR1 promotes breast metastasis.
Epidermal growth factor (EGF) is a crucial factor in mammary gland development [16] and EGFR-targeted therapy provides some promising effects in patients with triple-negative (estrogen receptor-, progesterone receptor-, and erb-b2 receptor tyrosine kinase 2-negative) breast cancer [17]. In this study, we aimed to investigate the expression status of CCR1 in breast cancer tissues, the functional relevance of CCR1 in breast cancer metastasis, and the mechanisms underlying the regulation of CCR1 expression in breast cancer cells.
RESULTS
Higher expression of CCR1 in human breast cancer tissue
To investigate the role of CCR1 in human breast cancer, we first evaluated its expression in a tissue microarray composed of human breast invasive ductal carcinoma (IDC) and their adjacent peripheral normal tissues. We found that the CCR1 immunoreactivity was stronger in IDC than in adjacent normal tissues (Figure 1A). Relative CCR1 staining intensity was significantly higher in IDC than their adjacent normal tissues (mean ± SD; normal: 1.669 ± 1.886, Cancer: 5.781 ± 2.513; P < 0.0001 by two-tailed paired t-test, n = 178) (Figure 1B, Supplementary Table 1). Tissue microarray samples were composed of estrogen receptor (ER) negative and positive, progesterone receptor (PR) negative and positive, human epidermal growth factor receptor 2 (HER2) negative and positive, and triple negative (TN; ER-/PR-/HER2-) specimens. Statistical analysis shows that ER, PR, and HER2 expression was not associated with CCR1 staining intensity (Figure 1C). These data suggest that CCR1 is overexpressed in breast invasive ductal carcinoma (IDC) as compared to adjacent normal tissues, regardless of ER, PR, and HER2 expression status.
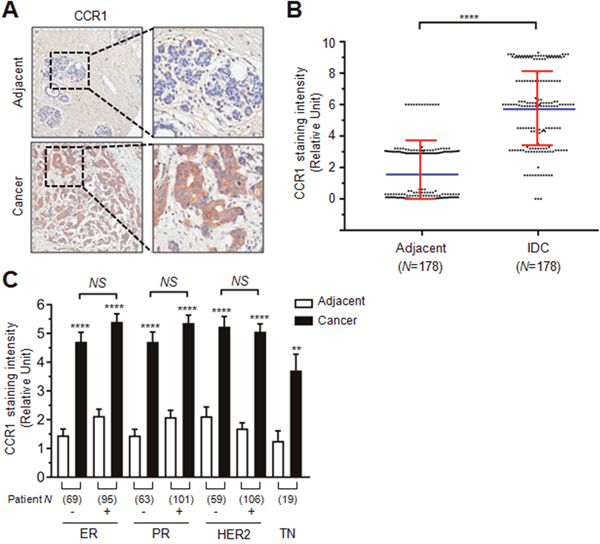
Figure 1: Role of CCR1 in the invasion and metastasis of breast cancer cells. (A) Representative immunohistochemical staining of CCR1 in breast invasive ductal carcinoma (IDC) and adjacent normal tissue samples. Square N indicates total tissue number. (B) Relative staining scores of CCR1 immunoreactivity in IDC and adjacent normal tissues. Data are mean ± SD. Spot, individual sample; blue horizontal line, mean; red vertical line, error bar. ****, P < 0.0001 (n = 178, paired two-tailed t-test). (C) Relative immunohistochemical staining intensity of CCR1 in ER, PR, HER2, or TN negative (-) or positive (+) samples. Square number indicates total sample number. ER, estrogen receptor; PR, progesterone receptor; HER2, human epidermal growth factor receptor 2; TN, triple negative (ER-/PR-/HER2-). Values are expressed as mean ± SD. NS, not significant; ****, P < 0.0001; **, P < 0.0220 by one-way ANOVA followed by Sidak’s multiple comparisons test (comparison between normal and cancer groups).
Silencing of CCR1 attenuates the invasive and metastatic capabilities of MDA-MB-231 cells
Previous studies have demonstrated that CCR1 is involved in tumor metastasis in several cancers [9, 12–14]. However, the functional role of CCR1 is unclear in breast cancer metastasis. The steady-state levels of CCR1 mRNA were examined in various breast cancer cell lines. RT-PCR analysis showed that CCR1 mRNA levels were readily detectable in most tested breast cancer cell lines, but not in untransformed MCF12A breast epithelial cells (Figure 2A). For further characterization, we selected the MDA-MB-231 breast cancer cell line because these cells are highly metastatic and induce cell migration upon EGF stimulation [18].
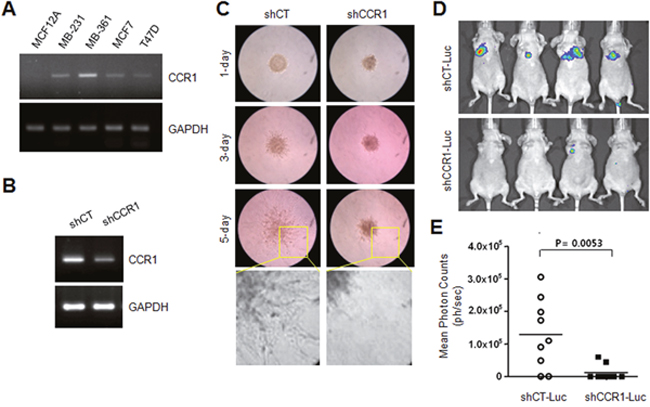
Figure 2: Effect of CCR1 silencing on experimental tumor invasion and metastasis. (A) CCR1 expression in various breast cancer cells. Steady-state CCR1 mRNA levels were examined by RT-PCR. GAPDH was used as an internal control. (B) Silencing of CCR1 by expression of lentiviral CCR1 shRNA (shCCR1). Knockdown of CCR1 expression was verified by RT-PCR. (C) Invasion assay. MDA-MB-231 transfectants expressing shCT or shCCR1 were cultured in three-dimensional spheroids in an extracellular matrix. Protrusion of invasive cells was captured with an Eclipse TS100 microscope equipped with a digital sight camera. (D) Experimental in vivo lung metastasis. Representative BLI imaging of nude mice bearing MDA-MB-231 (shCT-Luc and shCCR1-Luc) tumors with metastatic lung lesions. (E) Eight weeks after inoculation, BLI signal intensity was measured in MDA-MB-231 transfectants with Spectrum IVIS.
To evaluate the functional role of CCR1 in the regulation of invasion, we analyzed the invasiveness of MDA-MB-231 cells expressing either a scrambled shRNA (shCT) or CCR1 shRNA (shCCR1). Knockdown of CCR1 was verified by RT-PCR (Figure 2B). Three-dimensional (3-D) spheroid culture demonstrated that control shCT cells showed high invasiveness out of the spheroid and into the surrounding matrix as spindle-like protrusions (Figure 2C). In contrast, CCR1-silenced cells showed an obvious reduction in invasive sprouting. To determine the effect of CCR1 silencing on metastatic properties in vivo, we injected luciferase-expressing MDA-MB-231 transfectants (shCT-Luc and shCCR1-Luc cells) into the tail veins of immunodeficient mice, and metastatic activity was determined by bioluminescence imaging (Figure 2D). At 8-weeks post-injection, mice injected with shCT-Luc cells had large tumors and increased bioluminescence signals. In contrast, shCCR1-Luc cells showed decreased lung metastatic ability in the mice. Whole-body imaging revealed that silencing of CCR1 significantly reduced the bioluminescence signal (Figure 2E). These data demonstrate that CCR1 promotes the invasion and metastasis of MDA-MB-231 breast cancer cells.
EGF induces CCR1 expression in human breast cancer cells
To investigate the molecular mechanism underlying CCR1 gene regulation, we tested whether EGF up-regulates CCR1 expression in MDA-MB-231 cells by RT-PCR. After serum starvation, CCR1 mRNA was undetectable; however, after EGF stimulation for 3 h, CCR1 mRNA expression was increased (Figure 3A). Quantitative real-time PCR (Q-PCR) demonstrated maximum CCR1 mRNA expression after approximately 6 h, with 20.2- and 18.7-fold increases at 6 and 12 h, respectively, compared to the basal level (Figure 3B). Elevated CCR1 protein levels were confirmed by immunoblotting (Figure 3C), flow cytometry (Figure 3D), and immunofluorescence microscopy (Figure 3E). Thus, EGF facilitates CCR1 expression in highly metastatic MDA-MB-231 cells.
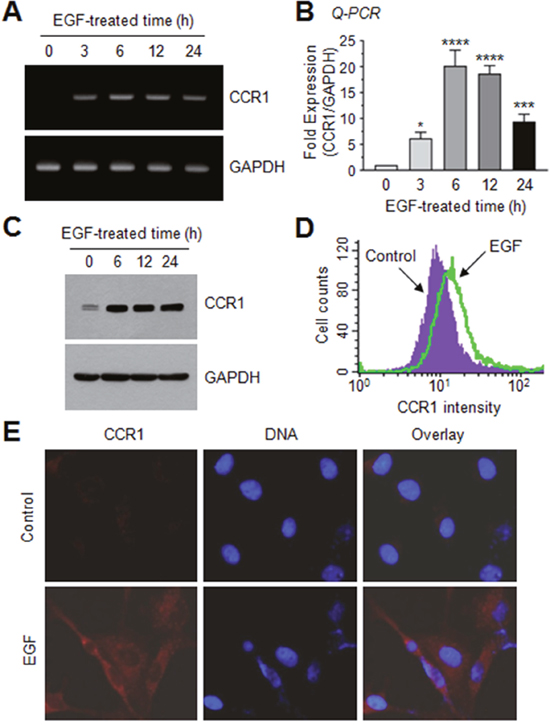
Figure 3: EGF enhances CCR1 expression in MDA-MB-231 breast cancer cells. (A) MDA-MB-231 cells were serum-depleted overnight and treated with EGF (50 ng/mL) for 0–24 h, and total RNA was extracted. CCR1 mRNA levels were examined by RT-PCR. GAPDH was used as an internal control. (B) Serum-starved MDA-MB-231 cells were treated as in A, and CCR1 mRNA levels were assessed by quantitative real-time PCR (Q-PCR). Values were normalized to GAPDH mRNA levels. Data are mean ± SD (n = 3). *, P = 0.0247; ***, P < 0.0009; ****, P < 0.0001 (compared to untreated control; by Sidak’s multiple comparisons test). (C) Serum-starved MDA-MB-231 cells were treated as in A, and CCR1 protein levels were assessed by immunoblotting. GAPDH was used as an internal control. (D) Flow cytometry. After serum-starved MDA-MB-231 cells were treated with EGF (50 ng/mL) for 12 h, CCR1 protein expression on the cell surface was measured using flow cytometry. (E) MDA-MB-231 cells were treated with EGF (50 ng/mL) for 12 h, and then incubated with an antibody against CCR1, and a AlexaFluor 555-conjugated (red signal) secondary antibody for 30 min. Nuclear DNA was stained with 0.1 μg/mL Hoechst 33258 for 10 min (blue signal). Fluorescence-positive cells were examined under an EVOSf1® fluorescence microscope.
Signal transducer and activator of transcription (STAT)-binding element stimulates EGF-induced CCR1 promoter activation
To determine the transcriptional mechanism regulating CCR1 expression, a series of 5′-deletion constructs of human CCR1 were generated and transfected into MDA-MB-231 cells. The data revealed that these deletions affected EGF stimulation-induced CCR1 promoter activity (Figure 4A). Notably, deletion of the –200 to –111 region dramatically decreased EGF-induced CCR1 promoter activity, suggesting that this region is crucial for EGF-induced CCR1 transcription.
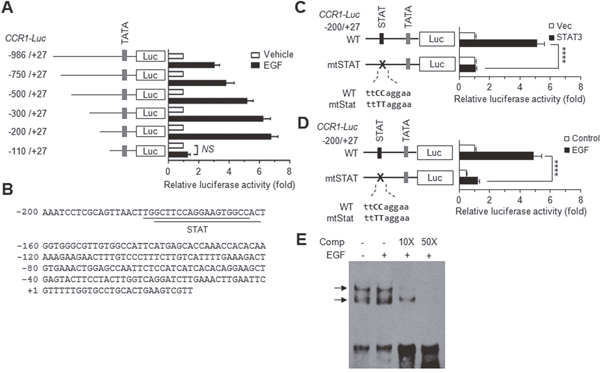
Figure 4: EGF induces CCR1 expression via STAT3. (A) MDA-MB-231 cells were transfected with 0.2 μg of the promoter-reporter plasmids along with 50 ng of the Renilla luciferase expression plasmid, pRL-null, for normalization of transfection efficiency. After 48 h, the cells were either treated with EGF (20 ng/mL) for 12 h or untreated (control), after which dual luciferase activity was measured. Data are means ± SD (n = 3). (B) The nucleotide sequence of the promoter region (−200 to +27) of human CCR1. (C) MDA-MB-231 cells were transfected with either wild-type pCCR1-Luc(−200/+27) or a STAT site mutant construct (mtSTAT), and with either an empty vector or a STAT3 expression plasmid. After 48 h, the cells were collected, and dual luciferase activity was measured. Data are means ± SD (n = 3). ****, p < 0.0001. (D) MDA-MB-231 cells were transfected with either wild-type pCCR1-Luc(−200/+27) or mtSTAT. After 48 h, the cells were either treated with EGF (20 ng/mL) for 12 h or untreated, and then, dual luciferase activity was measured. Data are means ± SD (n = 3). ****, p < 0.0001 by Sidak’s multiple comparisons test. (E) EMSA. MDA-MB-231 cells were treated with EGF (50 ng/mL) for 12 h or untreated, and nuclear extracts were prepared. EMSA was performed with biotin-labeled oligonucleotide probes containing the STAT3 binding sequence (5′-gttaacttggcttccaggaagtggc-3′) in the absence or presence of a 10-fold (10×) or 50-fold (50×) molar excess of unlabeled competitor oligonucleotides (Comp).
Using the web-based transcription factor search tool MatInspector (http://www.genomatix.de/), we identified two overlapping binding sites of signal transducer and activator of transcription (STAT) at –183/–165 and –181/–162 bp in the CCR1 promoter (Figure 4B). To determine the possible contribution of these STAT-binding elements to EGF-induced CCR1 transcription, the core sequence of the STAT-binding motif at –183/–162 was mutated within the –200/+27 construct (mtStat; ttCCagga → ttTTagga) by site-directed mutagenesis (Figure 4C). Transient transfection of STAT3 trans-activated the wild-type construct but not the STAT mutant construct. Notably, disruption of the STAT sites caused a significant reduction in EGF responsiveness (p < 0.0001) compared to the wild-type construct (Figure 4D). We next determined whether the STAT-binding elements are responsive to EGF stimulation. An electrophoretic mobility shift assay (EMSA) showed that EGF increased the amount of DNA-protein complexes, which were reduced by the addition of excess unlabeled STAT-binding oligonucleotides (Figure 4E). These data suggest that STAT3 binds to the STAT binding motifs in the CCR1 promoter region and is responsible for EGF signaling-mediated CCR1 transcription.
Inhibition of STAT3 reduces EGF-induced CCR1 transcription
Pretreatment of MDA-MB-231 cells with Stattic, a small molecule inhibitor of STAT3, dose-dependently decreased EGF-induced CCR1 mRNA accumulation (Figure 5A and 5B). To further address the role of STAT3, we established MDA-MB-231 transfectants stably expressing scrambled control shRNA (shCT) or STAT3 shRNA (shSTAT3). Reduction of STAT3 expression was confirmed by RT-PCR. Knockdown of endogenous STAT3 reduced EGF-induced CCR1 mRNA expression (Figure 5C). EGF stimulation increased CCR1 mRNA levels 22.1-fold in MDA-MB-231/shCT cells, but only 3.5-fold increase in MDA-MB-231/shSTAT3 cells (Figure 5D). Similarly, knockdown of STAT3 in T24 bladder cancer cells (Supplementary Figure 1A and 1B) and Capan-1 pancreatic cancer cells (Supplementary Figure 1C and 1D) dramatically decreased CCR1 mRNA levels, as revealed by RT-PCR and Q-PCR. These findings suggest that STAT3 mediates EGF-induced CCR1 expression and that the regulatory function of STAT3 in CCR1 expression is not limited to breast cancer cells.
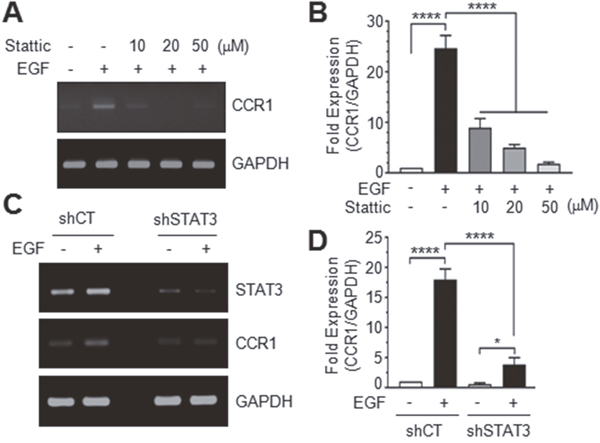
Figure 5: Effect of STAT3 silencing on CCR1 expression. (A) Serum-starved MDA-MB-231 cells were treated with EGF (50 ng/mL) in the absence or presence of different concentrations of Stattic. After 12 h, total RNA was extracted, and CCR1 mRNA levels were examined by RT-PCR. (B) Serum-starved MDA-MB-231 cells were treated as in A, and CCR1 mRNA levels were assessed by quantitative real-time PCR. Values were normalized to GAPDH mRNA levels. Data are means ± SD (n = 3). ****, p < 0.0001 by Sidak’s multiple comparisons test. (C) Serum-starved MDA-MB-231 transfectants expressing control scrambled shRNA (shCT) or STAT3 shRNA (shSTAT3) were treated with EGF (50 ng/mL) for 12 h, and total RNA was extracted. CCR1 mRNA levels were examined by RT-PCR. GAPDH was used as an internal control. (D) Cells were treated as in C, and CCR1 mRNA levels were determined by quantitative real-time PCR. Data are means ± SD (n = 3). *, p = 0.0157; ****, p < 0.0001 by Sidak’s multiple comparisons test.
Inhibition of AKT suppresses EGF-induced serine-727 phosphorylation of STAT3 and CCR1 expression
To investigate the STAT3-stimulating signaling pathway responsible for CCR1 expression, serum-starved MDA-MB-231 cells were treated with EGF (50 ng/mL). In accordance with a previous study [19], we observed an increase in STAT3 phosphorylation by EGF; of note, tyrosine-705 phosphorylation was transient, while serine-727 phosphorylation was long-lasting over 60 min (Figure 6A), suggesting that serine phosphorylation of STAT3 may play a role in CCR1 expression. We next sought to identify the serine kinase that phosphorylates serine-727 of STAT3. One possible candidate is AKT, which is important for tumor initiation [20] and metastasis [21]. AKT and its downstream effector, mammalian target of rapamycin (mTOR), were rapidly phosphorylated by EGF (Figure 6A). To determine whether AKT participates in EGF-induced CCR1 expression, we utilized the pharmacological AKT inhibitor, API2 [22]. We confirmed that API2 inhibited EGF-induced AKT phosphorylation (Figure 6B). API2 also inhibited EGF-induced mTOR phosphorylation, as well as phosphorylation of serine-727 of STAT3, but had no effect on ERK1/2 phosphorylation (Figure 6B). In addition, the EGF-induced accumulation of CCR1 mRNA was decreased by API2 in a dose-dependent manner as revealed by RT-PCR (Figure 6C) and Q-PCR (Figure 6D). These data suggest that AKT signaling is involved in EGF-induced CCR1 mRNA expression.
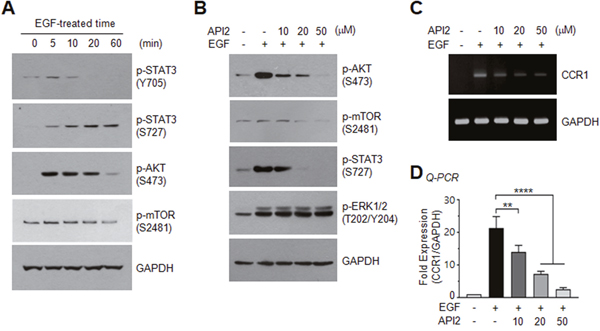
Figure 6: Effect of AKT inhibition on EGF-induced STAT3 phosphorylation and CCR1 expression. (A) Serum-starved MDA-MB-231 cells were treated with EGF (50 ng/mL) for different times, and phosphorylation of STAT3 (Tyr705), STAT3 (Ser727), AKT (Ser473), or mTOR (Ser2481) was analyzed by immunoblotting. GAPDH was used as an internal control. (B) Serum-starved MDA-MB-231 cells were either pretreated with API2 (10, 20, or 50 μM) for 30 min or untreated, and then treated with EGF (50 ng/mL). After 15 min, the cells were collected, and protein lysates were prepared. Phosphorylation of AKT (Ser473), mTOR (Ser2481), STAT3 (Ser727), or ERK1/2 (Thr201/Tyr204) was analyzed by immunoblotting. GAPDH was used as an internal control. (C) Cells were treated as in (B). After 24 h, total RNAs were extracted, and CCR1 mRNA levels were examined by RT-PCR. GAPDH was used as an internal control. (D) Serum-starved MDA-MB-231 cells were treated as in B, and CCR1 mRNA levels were assessed by quantitative real-time PCR (Q-PCR). Values were normalized to GAPDH mRNA levels. Data are means ± SD (n = 3). **, p = 0.0027; ****, p < 0.0001 by Sidak’s multiple comparisons test.
Silencing of AKT inhibits EGF-induced serine-727 phosphorylation of STAT3 and CCR1 expression
To further address the possible involvement of AKT in the regulation of CCR1 expression, we established MDA-MB-231 transfectants in which AKT1, AKT2, or AKT1 plus AKT2 [AKT(1+2)] were stably knocked down using a lentiviral shRNA delivery system (Figure 7A). Silencing of AKT1, AKT2, or AKT(1+2) led to decreased expression of CCR1 mRNA, as revealed by RT-PCR (Figure 7B) and Q-PCR (Figure 7C). Furthermore, AKT1 silencing resulted in the inhibition of EGF-induced phosphorylation of mTOR at serine-2481 and STAT3 at serine-727 (Figure 7D), as well as CCR1 mRNA expression (Figure 7E). These data demonstrate that AKT stimulates STAT3, leading to up-regulation of CCR1 mRNA expression. Similar results were observed for STAT3 phosphorylation on serine-727 (Supplementary Figure 2A) and CCR1 mRNA expression (Supplementary Figure 2B and 2C) in T24 bladder and Capan-1 pancreatic cancer cells expressing AKT1 shRNA.
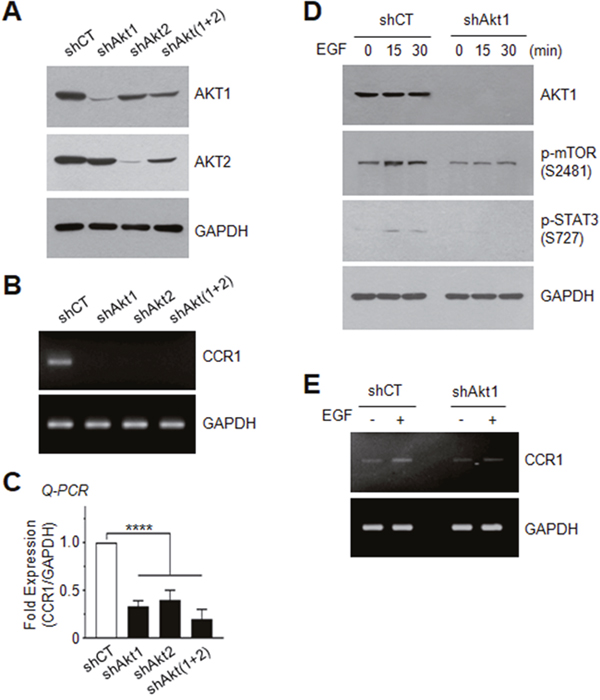
Figure 7: Effect of AKT silencing on EGF-induced STAT3 phosphorylation and CCR1 expression. (A) AKT1 or AKT2 expression was examined in MDA-MB-231 cells expressing control shRNA (shCT), AKT1 shRNA (shAkt1), AKT2 shRNA (shAkt2), or AKT1 plus AKT2 [shAkt(1+2)] shRNAs. GAPDH was used as an internal control. (B) CCR1 mRNA expression was detected by RT-PCR in shCT, shAkt1, shAkt2, or shAkt(1+2)-expressing cells. GAPDH was used as an internal control. (C) CCR1 mRNA expression was detected by Q-PCR in shCT, shAkt1, shAkt2, or shAkt(1+2)-expressing cells. Values were normalized to GAPDH mRNA levels. Data are means ± SD (n = 3). ****, p < 0.0001 by Sidak’s multiple comparisons test. (D) Serum-starved shCT or shAkt1 cells were either untreated or treated with EGF (50 ng/mL) for 15 or 30 min, and the phosphorylation status of mTOR (Ser2481) and STAT3 (Ser727) was analyzed by immunoblotting. GAPDH were used as internal controls. (E) Serum-starved shCT or shAkt1 cells were treated with EGF (50 ng/mL) for 24 h, and CCR1 mRNA expression was detected by RT-PCR. GAPDH was used as an internal control.
To extend our analysis of the role of AKT in CCR1 expression, we tested whether exogenous expression of AKT increases CCR1 expression. Exogenous expression of V5-tagged AKT1 in non-transformed MCF12A breast epithelial cells was confirmed by immunoblotting (Supplementary Figure 3A). We selected two transfectants (clones #1 and #2), and measured CCR1 mRNA expression. CCR1 mRNA levels were strongly increased by exogenous AKT1 expression compared with that in empty vector-transfected cells (Supplementary Figure 3B and 3C). These data demonstrated that AKT mediates EGF-induced CCR1 mRNA expression through activation of STAT3.
mTOR is necessary for AKT-induced serine-727 phosphorylation of STAT3 and CCR1 expression
A previous study has reported that inhibition of mTOR prevents the migration and invasion of leukemia cells through the inhibition of STAT3 phosphorylation [23]. We next asked whether EGF-induced mTOR activation is functionally linked to serine-727 phosphorylation of STAT3 and CCR1 expression. When MDA-MB-231 cells were treated with the mTOR inhibitor rapamycin, EGF-induced mTOR phosphorylation and STAT3 serine-727 phosphorylation (Figure 8A), as well as CCR1 mRNA expression (Figure 8B and 8C) were substantially decreased, suggesting that the rapamycin-sensitive mTOR/Raptor complex (mTORC1) is involved in EGF-induced phosphorylation of STAT3 and CCR1 mRNA expression.
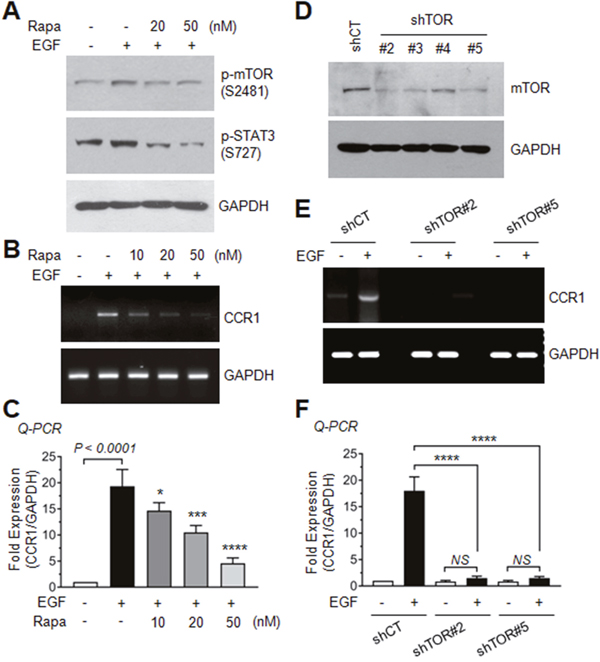
Figure 8: Role of AKT-dependent mTOR activation in EGF-induced CCR expression. (A) Serum-starved MDA-MB-231 cells were either left untreated or pretreated with rapamycin (20 or 50 nM) for 30 min, and then treated with EGF (50 ng/mL). After 15 min, the cells were collected, and protein lysates were prepared. Lysates were immunoblotted with phospho-mTOR (Ser2481) and phospho-STAT3 (Ser727) antibodies. GAPDH was used as an internal control. (B) Serum-starved MDA-MB-231 cells were treated as in A. After 24 h, total RNAs were extracted, and CCR1 mRNA levels were examined by RT-PCR. GAPDH was used as an internal control. (C) Serum-starved MDA-MB-231 cells were treated as in B, and CCR1 mRNA levels were assessed by quantitative real-time PCR (Q-PCR). Values were normalized to GAPDH mRNA levels. Data are means ± SD (n = 3). *, p = 0.0343; ***, p = 0.0004; ****, p < 0.0001 (compared with EGF-treated cells; by Sidak’s multiple comparisons test). (D) Silencing of mTOR by expression of lentiviral mTOR shRNA (shTOR). Knockdown of mTOR expression was verified by immunoblotting. (E) Serum-starved shCT and shTOR clones #2 and #5 cells were treated with EGF (50 ng/mL) for 24 h, and CCR1 mRNA expression was detected by RT-PCR. GAPDH was used as an internal control. (F) Serum-starved shCT and shTOR clones #2 and #5 cells were treated as in E, and CCR1 mRNA levels were assessed by Q-PCR. Values were normalized to GAPDH mRNA levels. Data are means ± SD (n = 3). ****, p < 0.0001; NS, statistically not significant (by Sidak’s multiple comparisons test).
To confirm the requirement of mTOR for EGF-induced CCR1 expression, we established MDA-MB-231 transfectants stably expressing mTOR shRNA (shTOR). Silencing of mTOR was confirmed by immunoblotting, and two clones (clones #2 and #5) were selected for further experiments (Figure 8D). Both two clones exhibited inhibition of EGF-induced CCR1 mRNA expression as revealed by RT-PCR (Figure 8E) and Q-PCR (Figure 8F). These data suggest that mTOR participates in serine-727 phosphorylation of STAT3 and CCR1 mRNA expression in response to EGF stimulation in MDA-MB-231 breast cancer cells.
DISCUSSION
Invasion and metastasis are central to cancer development and progression. EGF stimulates the growth, proliferation, differentiation, and survival of diverse cell types and facilitates cellular migration. Amplification or uncontrolled activation of EGFR signaling has been implicated in the invasion and metastasis of many cancers. In breast cancer cells, inhibition of EGFR signaling reduces breast cancer cell invasion [24]. CCR1 is involved in the invasion and metastasis of several cancer types [14, 15]. Here, we show that EGF up-regulates CCR1 expression, suggesting that CCR1 may contribute to EGFR-mediated tumor invasion and metastasis. CCR1 expression is enhanced by many extracellular agents, including histamine [25], conditional medium collected from TNFα-activated mesenchymal stem cells [26], interleukin-2 [27], and insulin-like growth factor (IGF)-1 [28]. However, the mechanism underlying CCR1 upregulation in metastatic tumor cells is poorly characterized. Here, we found that EGF induces CCR1 transcription by stimulating promoter activity, suggesting positive cross-talk between EGFR and CCR1 signaling. In this study, the transcriptional regulatory mechanism of the human CCR1 gene was investigated using MDA-MB-231 breast cancer cells. The major findings of our study can be summarized as follows: (i) elevated expression of CCR1 in breast IDC; (ii) EGF-induced transcriptional upregulation of CCR1 expression; (iii) overlapping consensus STAT3-binding sequences (between –183 and –162) in the CCR1 promoter are essential for EGF-induced CCR1 transcriptional activation; (iv) knockdown of CCR1 or STAT3 expression reduces the invasive and metastatic capability of MDA-MB-231 cells; and (v) the PI3K-AKT-mTOR-STAT3 axis is required for EGF-induced CCR1 mRNA expression.
We observed that CCR1 mRNA was abundantly expressed in various breast cancer cell lines, including MDA-MB-231, MDA-MB-361, MCF7, and T47D cells, as compared with the levels in normal MCF12A breast epithelial cells. We further found that CCR1 mRNA expression in MDA-MB-231 cells was enhanced upon EGF stimulation, as revealed by RT-PCR, Q-PCR, fluorescence microscopy, and flow cytometry. In an effort to reveal the transcriptional regulatory mechanism of EGF-induced CCR1 expression, we identified the cis-acting response elements in the CCR1 promoter. Using serial deletion constructs, we found that the region between –200 and –100 was required for EGF-induced CCR1 promoter activity, and sequence analysis revealed two overlapping STAT3 elements between –183 and –162. The functional significance of these STAT3 binding sites was demonstrated by their mutation, which led to significantly reduced STAT3- and EGF-induced promoter activity. In addition, transfection of MDA-MB-231 cells with a STAT3-specific shRNA strongly attenuated EGF-induced CCR1 transcription. STAT3 is ubiquitously expressed in most tissues, however, constitutively active STAT3 may contributes to tumor progression and metastasis in diverse cell types [29–32]. Our data clearly indicate that CCR1 silencing inhibited the invasive capability of MDA-MB-231 cells, as revealed in 3-D spheroid culture, and significantly inhibited lung metastasis, as revealed in an in vivo experiment. These results suggest that CCR1 promotes the metastasis of breast cancer cells. Thus, we hypothesized that STAT3 contributes to tumor invasion and metastasis by regulating CCR1 expression. These findings extend the function of EGFR in the promotion of invasiveness via up-regulation of CCR1 expression.
Another key finding of this study is that CCR1 expression is induced by the AKT-mTOR-STAT3 axis upon EGF stimulation. For maximal STAT3 activation, phosphorylation at both tyrosine and serine residues is required [33]. Tyrosine-705 phosphorylation of STAT3 is prerequisite for homodimerization, nuclear translocation, and DNA-binding activity [34], whereas serine-727 phosphorylation is necessary for maximal transcriptional activity [29, 35]. Tyrosine-705 is phosphorylated by several tyrosine kinases, such as EGFR, Src, and JAK family kinases [36, 37], and serine-727 phosphorylation by multiple serine kinases, including MAPKs (p38, ERK, JNK), PKCδ, mTOR, and NLK, independently of tyrosine-705 phosphorylation [35, 38, 39]. In MDA-MB-231 cells, we observed that EGF-induced tyrosine-705 phosphorylation rapidly declined after 10 min, whereas serine-727 phosphorylation was long lasting (up to 60 min). Here, we focused on the serine kinases involved in serine-727 phosphorylation of STAT3 in the regulation of CCR1 expression. Among the downstream effectors of EGFR, PI3K and AKT activities are significantly increased in triple-negative (ERα-/PR-/HER2-) breast cancers [40, 41], and PI3K expression is associated with poor prognosis in breast cancer [42]. In addition, targeting EGFR/PI3K/AKT pathway significantly inhibited migration and invasion of MDA-MB-231 cells [18]. Here we showed that AKT was highly phosphorylated within 5 min after EGF stimulation, and treatment with API2, a pharmacological inhibitor of AKT, reduced EGF-induced STAT3 phosphorylation and CCR1 mRNA expression. Moreover, shRNA-mediated silencing of AKT1 or AKT2 in MDA-MB-231 cells strongly attenuated STAT3 phosphorylation at serine-727 and CCR1 mRNA expression. Silencing of AKT1 in T24 bladder carcinoma cells and Capan-1 pancreatic carcinoma cells yielded similar results, suggesting that CCR1 expression activation via the AKT-STAT3 pathway is not restricted to breast cancer cells. However, in diethyl nitrosamine-induced mouse hepatocellular carcinoma cells, treatment with the PI3K inhibitor LY294002 had no effect on STAT3 phosphorylation at serine-727 [43]. Thus, it is unclear whether the AKT-STAT3 axis drives transcriptional activation of CCR1 in diverse cancer cell types.
In summary, we propose a signaling mechanism by which EGF up-regulates the expression of CCR1 through the AKT-mTOR-STAT3 axis in MDA-MB-231 breast cancer cells. It will be of great interest to determine whether targeting of AKT-mTOR-STAT3 axis-dependent CCR1 expression can be a potential therapeutic strategy for the management of triple-negative breast cancer.
MATERIALS AND METHODS
Cells
Human breast non-transformed epithelial (MCF12A) and cancer cells (MDA-MB-231), bladder carcinoma (T24) and pancreatic adenocarcinoma (Capan-1) cells were obtained from the American Type Culture Collection (Manassas, VA, USA).
Human breast cancer specimens and immunohistochemical analysis
A human breast tissue microarray, containing 189 breast cancer specimens composed of invasive ductal carcinoma (189 cases) and matched peripheral normal tissues, was generated by the Chonnam National University Hwasun Hospital National Biobank of Korea, a member of the National Biobank of Korea. Samples of invasive ductal carcinoma (IDC) and adjacent normal tissues (178 cases) were analyzed for CCR1 expression. Clinicopathologic parameters, including age at diagnosis, histopathologic type, tumor size, and nodal status, were evaluated. All IDC patients had not received chemotherapy or radiotherapy. All specimens were obtained after obtaining informed consent under an institutional review board (IRB)-approved protocol of the Chonnam National University Hwasun Hospital, Korea.
Immunohistochemical staining was performed with a Bond-Max autostainer system (Leica Microsystems, Bannockburn, IL, USA) using primary antibodies against CCR1 (1:150; Novus Biologicals, Littleton, CO, USA). All steps, which are listed below, were performed by the autostainer instrument, according to the manufacturer’s instructions, and all solutions were from Leica Microsystems: (i) deparaffinization of the tissue slides with Bond Dewax Solution at 72°C for 30 min, (ii) heat-induced epitope retrieval (antigen unmasking) with Bond Epitope Retrieval Solution 1 for 20 min at 100°C, (iii) peroxide blocking of the slides for 5 min at ambient temperature, (iv) incubation with the CCR1 primary antibody for 15 min at ambient temperature, (v) incubation with Post Primary reagent for 8 min at ambient temperature, followed by washing with Bond Wash solution for 6 min, (vi) incubation with Bond Polymer for 8 min at ambient temperature, followed by washing with Bond Wash and distilled water for 4 min, (vii) color development with 3,3′-diaminobenzidine tetrahydrochloride (DAB) chromogen for 10 min at ambient temperature, and (viii) hematoxylin counterstaining for 5 min at ambient temperature, followed by mounting of the slides. Normal human serum was used as a negative control. Histology slides were scanned with an Aperio ScanScope (Aperio Technologies, Vista, CA, USA). Immunostaining intensity was assessed in a blinded manner by two board-certified oncopathologists and scored on a scale of 0 to 3 (0 = negative, 1 = weak, 2 = moderate, and 3 = strong). The extent of staining was scored based on the percentage of stained cells (0 = negative, 1 = 1–25%, 2 = 26–50%, and 3 = 51–100%). Relative staining intensity was obtained by multiplying the intensity and extent scores (range, 0–9). Some samples with defective cores were not included in the analysis.
Reverse transcription (RT)-PCR and quantitative real time (Q)-PCR
RT-PCR and Q-PCR were performed as described previously [44]. Total RNA was extracted using a TRIzol RNA extraction kit (Invitrogen). First-strand cDNA was synthesized with an iScript cDNA synthesis kit (Bio-Rad, Richmond, CA, USA). RT-PCR and quantitative real-time-PCR (Q-PCR) were performed as described previously. The sequences of primers for RT-PCR and Q-PCR were: forward CCR1, 5′-gccttctggttttatggg-3′; reverse CCR1, 5′-ctcctagacacttttcctc-3′; CCR1 TaqMan probe, 5′-FAM- agttccgactgccatcttggactttg-BHQ-3′; forward GAPDH, 5′-tcgacagtcagccgcatcttc-3′; reverse GAPDH, 5′-cgcccaatacgaccacct ccg-3′; and GAPDH TaqMan probe, 5′-Yakima Yellow TM-cgtcgccagcccagccacgc-BHQ-1-3′. Expression values were normalized to GAPDH mRNA using the software program provided by the manufacturer.
Three-dimensional (3-D) spheroid invasion assay
A 3-D invasion assay was performed using the Cultrex 3-D Spheroid Cell Invasion Assay kit (Trevigen, Inc., Gaithersburg, MD, USA), as described previously [45]. MDA-MB-231 variant cells (3 × 10³ cells/well) expressing shRNA (shCT and shCCR1) were cultured for 3 days in Spheroid Formation Extracellular matrix to drive the aggregation and spheroid formation of cells followed by the addition of the Invasion Matrix composed of basement membrane proteins and medium for 1-5 days. The morphology of 3-D cell invasion was visualized using an Eclipse TS100 microscope equipped with a digital sight camera.
Experimental pulmonary metastasis assay in vivo
Balb/c-nude female mice were obtained from Orient Bio Inc. (Seungnam, Republic of Korea). All animal experiments were performed at Gachon University following IACUC (Institutional Animal Care and Use Committee)-approved protocols (No.LCDI-2012-0069). For the experimental metastatic model, MDA-MB-231-luc cells (shCT and shCCR1, 1 x 10⁶ cells in 100 μl PBS) were injected into the lateral tail veins of 7-week-old Balb/c-nude mice (n = 10 each group). After 8 weeks, D-luciferin (15 mg/kg; PerkinElmer, Waltham, MA, USA) was intraperitoneally injected 10 min prior to imaging acquisition. To monitor pulmonary metastasis, in vivo bioluminescent imaging was conducted once a week using the Spectrum IVIS (PerkinElmer, Waltham, MA, USA). The BLI signal intensity (photons/sec) was quantified and calculated as the sum of all detected regions per second using Living Image software (Xenogen, Alameda, CA, USA).
Immunoblot analysis
Cells were lysed in a buffer consisting of 20 mM HEPES (pH 7.2), 1% Triton X-100, 10% glycerol, 150 mM NaCl, 10 μg/mL leupeptin and 1 mM PMSF. The protein extracts (20 μg each) were separated by SDS-polyacrylamide gel electrophoresis and transferred to nitrocellulose membranes. Primary antibody against glyceraldehyde 3-phosphate dehydrogenase (GAPDH; 1:500) was obtained from Santa Cruz Biotechnology (Santa Cruz, CA, USA). Primary antibodies against phospho-Erk1/2 (Thr202/Tyr204; 1:1000), Akt1 (1:1000), phospho-Akt (Ser473; 1:1000), phospho-Stat3 (Tyr705; 1:500), and phospho-Stat3 (Ser727; 1:500), and phospho-mTOR (Ser2481; 1:1000) were purchased from Cell Signalling Technology (Danvers, MA, USA). The blots were incubated with the appropriate primary and secondary antibodies and developed using an enhanced chemiluminescence detection system (GE Healthcare, Piscataway, NJ, USA).
CCR1 surface expression analysis via flow cytometry
CCR1 expression on the cell surface was determined using the FlowCellect Chemokine Receptor CCR1 Surface Expression Identification kit (Merck Millipore, Darmstadt, Germany) according to the manufacturer’s instructions.
Construction and mutagenesis of human CCR1 promoter-reporter constructs
A fragment of the human CCR1 gene was amplified from human genomic DNA (Promega) via PCR. The Primer sequences used to amplify the human CCR1 gene spanning nucleotides –986 to +27 (transcription start site numbered +1) were 5′-agcaatgccgtgaggaaggt-3′ (forward; –986F) and 5′-tgtttctggggctttctggg-3′ (reverse; +27R). The amplified PCR products were ligated into a T&A vector (RBC Bioscience), followed by digestion with KpnI and BglII and subcloning into the luciferase reporter plasmid pGL4-basic (Promega), yielding pCCR1-Luc(–982/+27). A series of deletion constructs was generated using pCCR1-Luc(–986/+27) as a template. The forward primer sequences used to generate these constructs were 5′-agctgggatttgaacttgctc-3′ (−750 to +27), 5′-agttagttttgaggaacaggactca-3′ (–500 to +27), 5′-cactgccacccacctcaccca-3′ (–300 to +27), 5′- aaatcctcgcagttaacttgg-3′ (–200 to +27), and 5′-tttgtcccttcttgtcattt-3′ (–110 to +27). One reverse primer, +27R, was used for all deletion constructs. The amplified PCR products were ligated into the T&A vector and then ligated into the KpnI and BglII sites of the pGL4-basic vector, yielding pCCR1-Luc(−750/+27), pCCR1-Luc(−500/+27), pCCR1-Luc(−300/+27), pCCR1-Luc(−200/+27), and pCCR1-Luc(−110/+27), respectively. Site-specific mutation of the STAT3 binding site within the CCR1 promoter (ttCCagga → ttTTagga) was performed with a QuickChange site-directed mutagenesis system (Stratagene) using pCCR1-Luc(−200/+27) as a template. All mutations were verified by DNA sequencing.
Luciferase promoter reporter assay
The luciferase promoter reporter assay was performed as described previously [46]. Firefly luciferase activity was normalized to Renilla activity, and the relative amount of luciferase activity in the untreated cells was set to “1”.
Electrophoretic mobility shift assay (EMSA)
EMSA was performed using a DNA-binding protein detection system kit (Affymetrix, Santa Clara, USA) with minor modifications, as described previously [46]. The sequence of the synthetic deoxyoligonucleotide probe corresponding to the STAT binding sequence was 5′-biotin-gttaacttggcttccaggaagtggc-3′.
Lentiviral shRNA-mediated gene silencing
MDA-MB-231 cells were transduced with lentiviral particles targeting Akt1, Akt2, CCR1, mTOR, or STAT3 (MISSION® shRNA; Sigma-Aldrich, St. Louis, MO, USA), according to the manufacturer’s instructions.
Statistical analysis
The results were expressed as the mean ± standard deviation (SD). Statistical significance of tissue microarray data was analysed by paired two-tailed t-test, in vivo metastatic BL intensity data were by unpaired t-test, and other data were analyzed by one-way ANOVA followed by Sidak’s multiple comparisons test with the GraphPad Prism version 7.02 program (GraphPad Software, San Diego, CA, USA). A p-value < 0.05 was regarded as statistically significant.
Author contributions
SYS conducted the biochemical and animal experiments, analyzed the data, and wrote the manuscript. DHJ contributed to RT-PCR and luciferase reporter analysis; JL and CC contributed to tissue microarray analysis. JYK and JSN contributed to in vivo metastasis analysis. YL contributed to data analysis and interpretation. YHL supervised the study, analyzed the data, and edited the manuscript. All authors read and approved the final manuscript.
ACKNOWLEDGMENTS
The biospecimens and data used in this study were provided by the Biobank of Chonnam National University Hwasun Hospital, a member of the Korea Biobank Network. This paper was supported by the KU Research Professor Program of Konkuk University.
CONFLICTS OF INTEREST
The authors declare no conflicts of interest.
GRANT SUPPORT
This work was supported by grants (No. 2015R1A2A2A01004987 and No. 2016R1A2B4008570) from the Basic Science Research Program through the National Research Foundation of Korea (NRF) funded by the Ministry of Science, ICT and future Planning. The funders had no role in study design, data collection and analysis, decision to publish, or preparation of the manuscript.
REFERENCES
1. Balkwill F. Cancer and the chemokine network. Nat Rev Cancer. 2004; 4:540-550.
2. Nagarsheth N, Wicha MS, Zou W. Chemokines in the cancer microenvironment and their relevance in cancer immunotherapy. Nat Rev Immunol. 2017;17:559-572.
3. Chow MT, Luster AD. Chemokines in cancer. Cancer Immunol Res. 2014; 2:1125-1131.
4. Sarvaiya PJ, Guo D, Ulasov I, Gabikian P, Lesniak MS. Chemokines in tumor progression and metastasis. Oncotarget. 2013; 4:2171-2185. https://doi.org/10.18632/oncotarget.1426.
5. Muller A, Homey B, Soto H, Ge N, Catron D, Buchanan ME, McClanahan T, Murphy E, Yuan W, Wagner SN, Barrera JL, Mohar A, Verastegui E, et al. Involvement of chemokine receptors in breast cancer metastasis. Nature. 2001; 410:50-56.
6. Schaller MA, Kallal LE, Lukacs NW. A key role for CC chemokine receptor 1 in T-cell-mediated respiratory inflammation. Am J Pathol. 2008; 172:386-394.
7. Kato T, Fujita Y, Nakane K, Mizutani K, Terazawa R, Ehara H, Kanimoto Y, Kojima T, Nozawa Y, Deguchi T, Ito M. CCR1/CCL5 interaction promotes invasion of taxane-resistant PC3 prostate cancer cells by increasing secretion of MMPs 2/9 and by activating ERK and Rac signaling. Cytokine. 2013; 64:251-257.
8. Scotton C, Milliken D, Wilson J, Raju S, Balkwill F. Analysis of CC chemokine and chemokine receptor expression in solid ovarian tumours. Br J Cancer. 2001; 85:891-897.
9. Long H, Xie R, Xiang T, Zhao Z, Lin S, Liang Z, Chen Z, Zhu B. Autocrine CCL5 signaling promotes invasion and migration of CD133+ ovarian cancer stem-like cells via NF-kappaB-mediated MMP-9 upregulation. Stem Cells. 2012; 30:2309-2319.
10. De Vos J, Couderc G, Tarte K, Jourdan M, Requirand G, Delteil MC, Rossi JF, Mechti N, Klein B. Identifying intercellular signaling genes expressed in malignant plasma cells by using complementary DNA arrays. Blood. 2001; 98:771-780.
11. Anderson MW, Zhao S, Ai WZ, Tibshirani R, Levy R, Lossos IS, Natkunam Y. C-C chemokine receptor 1 expression in human hematolymphoid neoplasia. Am J Clin Pathol. 2010; 133:473-483.
12. Li Y, Wu J, Zhang P. CCL15/CCR1 axis is involved in hepatocellular carcinoma cells migration and invasion. Tumor Biol. 2016; 37:4501-4507.
13. Akram IG, Georges R, Hielscher T, Adwan H, Berger MR. The chemokines CCR1 and CCRL2 have a role in colorectal cancer liver metastasis. Tumor Biol. 2016; 37:2461-2471.
14. Wang CL, Sun BS, Tang Y, Zhuang HQ, Cao WZ. CCR1 knockdown suppresses human non-small cell lung cancer cell invasion. J Cancer Res Clin Oncol. 2009; 135:695-701.
15. Cao MA, Zhang Z, Gilchrist A. CCR1 as a target for metastatic breast cancer. FASEB J. 2017; 31:823.811-823.811.
16. Chen J, Zeng F, Forrester SJ, Eguchi S, Zhang MZ, Harris RC. Expression and function of the epidermal growth factor receptor in physiology and disease. Physiol Rev. 2016; 96:1025-1069.
17. Matsuda N, Lim B, Wang X, Ueno NT. Early clinical development of epidermal growth factor receptor targeted therapy in breast cancer. Expert Opinion Investig Drugs. 2017; 26:463-479.
18. Tsai PC, Fu YS, Chang LS, Lin SR. Taiwan cobra cardiotoxin III suppresses EGF/EGFR-mediated epithelial-to-mesenchymal transition and invasion of human breast cancer MDA-MB-231 cells. Toxicon. 2016; 111:108-120.
19. Chun J, Li RJ, Cheng MS, Kim YS. Alantolactone selectively suppresses STAT3 activation and exhibits potent anticancer activity in MDA-MB-231 cells. Cancer Lett. 2015; 357:393-403.
20. Smit L, Berns K, Spence K, Ryder WD, Zeps N, Madiredjo M, Beijersbergen R, Bernards R, Clarke RB. An integrated genomic approach identifies that the PI3K/AKT/FOXO pathway is involved in breast cancer tumor initiation. Oncotarget. 2016; 7:2596-2610. https://doi.org/10.18632/oncotarget.6354.
21. Pierobon M, Ramos C, Wong S, Hodge KA, Aldrich J, Byron SA, Anthony SP, Robert NJ, Northfelt DW, Jahanzeb M. Enrichment of PIK3-AKT-MTOR pathway activation in hepatic metastases from breast cancer. Clin Cancer Res. 2017; 23:4919-4928.
22. Yang L, Dan HC, Sun M, Liu Q, Sun XM, Feldman RI, Hamilton AD, Polokoff M, Nicosia SV, Herlyn M, Sebti SM, Cheng JQ. Akt/protein kinase B signaling inhibitor-2, a selective small molecule inhibitor of Akt signaling with antitumor activity in cancer cells overexpressing Akt. Cancer Res. 2004; 64:4394-4399.
23. He SQ, Gao M, Fu YF, Zhang YN. Glycyrrhizic acid inhibits leukemia cell growth and migration via blocking AKT/mTOR/STAT3 signaling. Int J Clin Exp Pathol. 2015; 8:5175-5181.
24. Farabegoli F, Govoni M, Spisni E, Papi A. EGFR inhibition by (-)-epigallocatechin-3-gallate and IIF treatments reduces breast cancer cell invasion. Biosci Rep. 2017. https://doi.org/10.1042/BSR20170168.
25. Kordulewska NK, Kostyra E, Cieślińska A, Matysiewicz M, Fiedorowicz E, Sienkiewicz-Szłapka E. Changes in gene expression induced by histamine, fexofenadine and osthole: expression of histamine H 1 receptor, COX-2, NF-κB, CCR1, chemokine CCL5/RANTES and interleukin-1β in PBMC allergic and non-allergic patients. Immunobiology. 2017; 222:571-581.
26. Chen K, Liu Q, Tsang LL, Ye Q, Chan HC, Sun Y, Jiang X. Human MSCs promotes colorectal cancer epithelial–mesenchymal transition and progression via CCL5/β-catenin/Slug pathway. Cell Death Dis. 2017; 8: e2819. https://doi.org/10.1038/cddis.2017.138.
27. Cantoni C, Huergo-Zapico L, Parodi M, Pedrazzi M, Mingari MC, Moretta A, Sparatore B, Gonzalez S, Olive D, Bottino C. NK cells, tumor cell transition, and tumor progression in solid malignancies: new hints for NK-based immunotherapy? J Immunol Res. 2016; 2016:4684268. https://doi.org/10.1155/2016/4684268.
28. Ho KH, Chen PH, Hsi E, Shih CM, Chang WC, Cheng CH, Lin CW, Chen KC. Identification of IGF-1-enhanced cytokine expressions targeted by miR-181d in glioblastomas via an integrative miRNA/mRNA regulatory network analysis. Sci Rep. 2017; 7:732.
29. Banerjee K, Resat H. Constitutive activation of STAT3 in breast cancer cells: a review. Int J Cancer. 2016; 138:2570-2578.
30. Kitamura H, Ohno Y, Toyoshima Y, Ohtake J, Homma S, Kawamura H, Takahashi N, Taketomi A. IL-6/STAT3 signaling as a promising target to improve the efficacy of cancer immunotherapy. Cancer Sci. 2017. https://doi.org/10.1111/cas.13332.
31. Geiger JL, Grandis JR, Bauman JE. The STAT3 pathway as a therapeutic target in head and neck cancer: barriers and innovations. Oral Oncol. 2016; 56:84-92.
32. Chai EZ, Shanmugam MK, Arfuso F, Dharmarajan A, Wang C, Kumar AP, Samy RP, Lim LH, Wang L, Goh BC. Targeting transcription factor STAT3 for cancer prevention and therapy. Pharmacol Ther. 2016; 162:86-97.
33. Yuan J, Zhang F, Niu R. Multiple regulation pathways and pivotal biological functions of STAT3 in cancer. Sci Rep. 2015; 5:17663. https://doi.org/10.1038/srep17663.
34. Aziz MH, Manoharan HT, Church DR, Dreckschmidt NE, Zhong W, Oberley TD, Wilding G, Verma AK. Protein kinase Cepsilon interacts with signal transducers and activators of transcription 3 (Stat3), phosphorylates Stat3Ser727, and regulates its constitutive activation in prostate cancer. Cancer Res. 2007; 67:8828-8838.
35. Decker T, Kovarik P. Serine phosphorylation of STATs. Oncogene. 2000; 19:2628-2637.
36. Zhong Z, Wen Z, Darnell JE Jr. Stat3: a STAT family member activated by tyrosine phosphorylation in response to epidermal growth factor and interleukin-6. Science. 1994; 264:95-98.
37. Ihle JN, Kerr IM. Jaks and Stats in signaling by the cytokine receptor superfamily. Trends Genet. 1995; 11:69-74.
38. Ouédraogo ZG, Müller-Barthélémy M, Kemeny JL, Dedieu V, Biau J, Khalil T, Raoelfils LI, Granzotto A, Pereira B, Beaudoin C. STAT3 serine 727 phosphorylation: a relevant target to radiosensitize human glioblastoma. Brain Pathol. 2016; 26:18-30.
39. Lim CP, Cao X. Regulation of Stat3 activation by MEK kinase 1. J Biol Chem. 2001; 276:21004-21011.
40. Jens CH, Jorg BE, Arnd H, Susanne M, Domenico Z, Andrea L, Nicola V. The PI3K/AKT/mTOR-signal transduction pathway as drug target in triple-negative breast cancer. Clin Cancer Drugs. 2017; 4:47-58.
41. Umemura S, Yoshida S, Ohta Y, Naito K, Osamura RY, Tokuda Y. Increased phosphorylation of Akt in triple-negative breast cancers. Cancer Sci. 2007; 98:1889-1892.
42. Aleskandarany MA, Rakha EA, Ahmed MA, Powe DG, Paish EC, Macmillan RD, Ellis IO, Green AR. PIK3CA expression in invasive breast cancer: a biomarker of poor prognosis. Breast Cancer Res Treat. 2010; 122:45-53.
43. Miyakoshi M, Yamamoto M, Tanaka H, Ogawa K. Serine 727 phosphorylation of STAT3: an early change in mouse hepatocarcinogenesis induced by neonatal treatment with diethylnitrosamine. Mol Carcinog. 2014; 53:67-76.
44. Shin SY, Kim CG, Jung YJ, Lim Y, Lee YH. The UPR inducer DPP23 inhibits the metastatic potential of MDA-MB-231 human breast cancer cells by targeting the Akt-IKK-NF-kappaB-MMP-9 axis. Sci Rep. 2016; 6:34134.
45. Lee da Y, Lee da H, Jung JY, Koh D, Kim GS, Ahn YS, Lee YH, Lim Y, Shin SY. A synthetic chalcone derivative, 2-hydroxy-3′,5,5′-trimethoxychalcone (DK-139), suppresses the TNFalpha-induced invasive capability of MDA-MB-231 human breast cancer cells by inhibiting NF-kappaB-mediated GROalpha expression. Bioorg Med Chem Lett. 2016; 26:203-208.
46. Shin SY, Lee JM, Lim Y, Lee YH. Transcriptional regulation of the growth-regulated oncogene alpha gene by early growth response protein-1 in response to tumor necrosis factor alpha stimulation. Biochim Biophys Acta. 2013; 1829:1066-1074.