
INTRODUCTION
In human females, reproductive organs age more rapidly than other parts of the body [1]; women older than 35 years typically exhibit low fertility [2]. The decline in fecundity accelerates from 35 to 40 years, and fertility is almost zero at 45 years [3]. In developed countries, women tend to delay having their first child, resulting in decreased birth rates and a more aged population, which is becoming a serious social problem [4]. Studies have shown that poor occyte quality caused by aging is the main reason for low fertility in elderly women [5-8].
Oocyte quality is strongly influenced by the microenvironment provided by granulosa cells (GCs) [9]. It is well-known that oocytes are separated from the blood by the surrounding GCs, follicular fluid, and theca cells. Hence, they are unable to obtain nutrients directly from the blood during development, 85 % of nutrients including hormones, growth factors, amino acids, and energy sources are supplied by GCs [10-17]. In addition, GCs also regulate the transcriptional activity of oocytes and facilitate the post-transcriptional modification of several oocyte proteins [18]. Interestingly, previous studies have demonstrated that the quality of oocytes could be improved following their isolation from aged mice follicles and maturation in vitro [19]. Moreover, aging GCs could also accelerate oocyte aging [20-24]. Taken together, these results suggest that oocyte quality is affected by deteriorating GCs [25].
Aging has a negative effect on GC functions [26]. In elderly women, the apoptosis ratio of GCs is significantly increased [27], moreover, the decrease in superoxide dismutase (SOD1 and SOD2), coenzyme Q10, and catalase were decreased along with defective mitochondria and reduced lipid droplets [24, 28]. The integrity of DNA in GCs is also affected by aging, moreover, a marked increase in double-strand breaks (DSBs) and a marked decrease in DSBs repair-related genes have been reported [29]. In addition, epigenetics changes were also the symptoms of the aging GCs. The GCs from old cows were found to have low genomic global DNA methylation, reduced proliferative and telomerase activity, and shortened telomeres [30]. Furthermore, the protein expression of GCs was reported to be different between young (20-33 years) and elderly (40-45 years) women, and 110 (7.7 % in total) proteins were found to be differentially expressed in aging GCs [31]. These results demonstrated that aging impairs GC functions; however, the mechanisms of aging and the gene expression profiles of aging GCs remain unclear.
Because of ethical constraints, the number of samples available for study is limited, preventing thorough investigations. Several studies have examined human GCs derived from patients undergoing in vitro fertilization (IVF). However, we believe that these cells do not accurately reflect actual conditions because they are derived from patients who suffer from infertility or some other illness that impairs fertility; moreover, the cells have been exposed to high pharmacological concentrations of exogenous gonadotropins during the process of super-ovulation. Therefore, the purpose of this study was to use porcine GCs as a model to evaluate the gene expression profiles during aging by RNA-seq and to understand the causes of fecundity declines in elderly women.
RESULTS
Ultrastructure changes in aging GCs
Various studies have investigated the intracellular ultrastructure changes in aging GCs by transmission electron microscopy and found defective mitochondria and reduced lipid droplets in the cytoplasm [28]. In the present study, to elucidate the effects of aging on GCs, changes in the cellular morphology and extracellular structure (especially the cell membrane) were analyzed by scanning electron microscopy. As shown in Figure 1, the cell membrane surface was rough, cavitations were found, and the formation of filopodia was greatly reduced in aging GCs compared with the control GCs. Moreover, cells in the aging group appeared flat. These results showed that aging could disrupt cell membrane integrity and fluidity.
Table 1: Basic characteristics of RNA-seq data in porcine GCs during aging.
Biological replicate 1 |
Biological replicate 2 |
Biological replicate 3 |
||||
Type |
Control 1 |
Aging 1 |
Control 2 |
Aging 2 |
Control 3 |
Aging 3 |
Total Raw Reads |
65275748 |
54539100 |
64997294 |
65296682 |
74624954 |
56512978 |
Total Clean Reads |
64809040 |
54410404 |
64799480 |
65145146 |
73957792 |
56386430 |
Total Clean Reads Ratio(%) |
99.29 |
99.76 |
99.70 |
99.77 |
99.11 |
99.78 |
Clean Reads Q30(%) |
90.76 |
92.91 |
91.84 |
93.06 |
91.15 |
92.84 |
Total mapped reads |
84.28% |
79.38% |
85.13% |
79.33% |
83.96% |
79.27% |
Unique mapped reads |
78.36% |
74.01% |
79.12% |
74.03% |
78.06% |
73.91% |
Reads mapped in paired |
78.69% |
71.35% |
80.11% |
71.44% |
78.46% |
71.07% |
Read mapped Gene |
55.51% |
53.60% |
55.42% |
55.98% |
55.99% |
54.34% |
Detected Gene Number |
22293 |
25141 |
22851 |
23789 |
22662 |
23974 |
Reads Map to '+' |
25,874,673 (39.92%) |
20,433,831 (37.56%) |
26,226,379 (40.47%) |
24,457,340 (37.54%) |
26,211,265 (40.45%) |
21,144,814 (37.50%) |
Reads Map to '-' |
25,848,028 (39.88%) |
20,456,183 (37.60%) |
26,211,265 (40.45%) |
24,463,039 (37.55%) |
29,430,847 (39.79%) |
21,165,749 (37.54%) |
Triplicate samples were collected from separated experiments. GC (%) is the percentage of G and C bases / total nucleotides; N (%) is the percentage of unrecognized bases / total nucleotides; Q30 (%) is the percentage of bases’ mass greater than or equal Q30 in the clean data; Uniq Mapped Reads is the number and percentage of reads that mapped to a unique position in the reference genome in the clean reads; Multiple Mapped Reads is the number and percentage of reads that mapped to multiple positions in the reference genome in the clean reads; Reads Map to ‘+’ is the number of clean reads mapped to the sense strand; Reads Map to ‘−’ is the number of clean reads mapped to antisense strand.
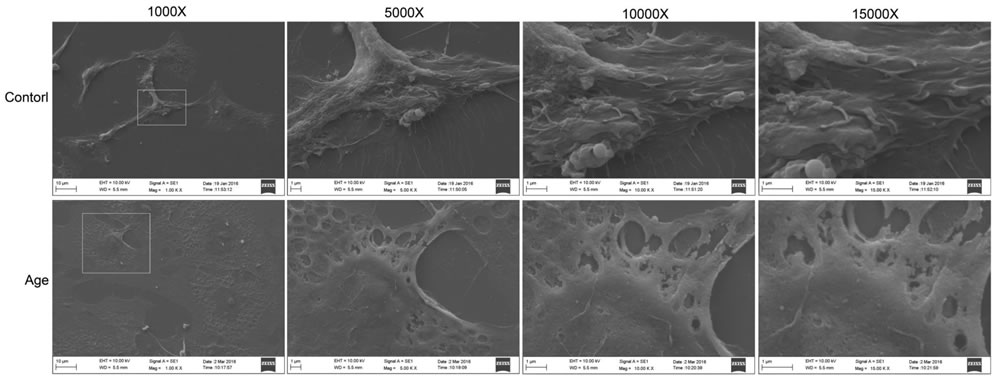
Figure 1: Extracellular ultrastructure analysis using scanning electron microscope. Ultrastructures observed at 1000×, 5000×, 10000×, and 15000×, respectively.
Overview of sequencing data
After RNA-seq analysis, we obtained 51.84 Gb of clean data from six libraries. A total of 64809040, 64799480, 73957792, 54410404, 65145146 and 56386430 clean reads were obtained from the respective libraries after filtering low-quality reads and removing adaptor sequences, and approximately 81.89% of the total clean reads were mapped to the Sus scrofa genome assembly in NCBI (http://www.ncbi.nlm.nih.gov/genome/?term = Sus_scrofa). In addition, the Q30 ranged between 90.76% and 93.06%. These results indicated that the quality of our six libraries was good, thus they were suitable for analysis. The detected number of genes was 22293, 22851, 22662, 25141, 23789 and 23974 for the respective libraries (Table 1). The vast majority of reads were evenly distributed throughout the gene by random sampling, which indicated the quality and homogeneity of the samples (Figure 2A). The samples collected form three separated experiments were good biological replicates (Figure 2B). Moreover, the ratio of reads corresponding to the exon, intron, and intergenic regions was different (Figure 2C). In total, 23159 genes were annotated (Table 2) and 3411 genes were differentially expressed in GCs during aging, of which 2193 genes were up-regulated and 1218 genes were down-regulated (Detailed information was shown in Supplementary Files 1 and 2). The top 10 up-regulated and down-regulated genes are shown in Table 3. Moreover, 2210 new genes were detected in the analysis, and 1580 genes were annotated in a different database (Table 2) (Detail information was shown in Supplementary File 3).
Table 2: Annotated gene numbers and length distribution in different databases
Annotation Database |
Annotated Number (All Genes/New Genes) |
300<=length<1000 (All Genes/New Genes) |
length>=1000 (All Genes/New Genes) |
COG Annotation |
7016/194 |
2554/70 |
4308/118 |
GO Annotation |
20881/813 |
8826/298 |
10935/478 |
KEGG Annotation |
13324/593 |
5295/214 |
7438/347 |
Swiss-Prot Annotation |
14455/771 |
5441/226 |
8253/521 |
Nr Annotation |
19735/1576 |
8241/510 |
10603/1007 |
All Annotated |
23159/1580 |
9897/512 |
11960/1009 |
COG : Clusters of Orthologous Groups; GO: Gene Ontology; KEGG: Kyoto Encyclopedia of Genes and Genomes;
Nr: Non-Redundant
Table 3: Top ten up-regulated and down-regulated genes in porcine GCs during aging
Gene Name |
Description |
Log2 Fold Change |
P-Value |
| Up-regulated | |||
| CEBPB | CCAAT/enhancer binding protein beta | 8.012054 | 5.69E-94 |
| RLN2 | Relaxin 2 | 6.982068 | 5.68E-24 |
| PGM5 | Phosphoglucomutase 5 | 6.347641 | 8.96E-20 |
| PLIN4 | Perilipin 4 | 6.305554 | 1.02E-26 |
| CHST9 | Carbohydrate sulfotransferase 9 | 5.920979 | 9.32E-33 |
| NRSN1 | Neurensin 1 | 5.552856 | 9.80E-12 |
| SCARA5 | Scavenger receptor class A member 5 | 5.537797 | 3.84E-57 |
| HKDC1 | Hexokinase domain containing 1 | 5.346571 | 1.20E-24 |
| PPP1R3G | Protein phosphatase 1 regulatory subunit 3G | 5.337344 | 2.30E-26 |
| CXCL12 | C-X-C motif chemokine ligand 12 | 5.287672 | 6.19E-25 |
| Down-regulated | |||
| TNFRSF11B | TNF receptor superfamily member 11b | -6.22999 | 1.15E-15 |
| IGFBP3 | Insulin like growth factor binding protein 3 | -5.1116 | 0 |
CXCL9 |
C-X-C motif chemokine ligand 9 | -4.70226 | 6.44E-08 |
| ANGPT2 | Angiopoietin 2 | -4.65853 | 4.29E-14 |
| BBOX1 | Gamma-butyrobetaine hydroxylase 1 | -4.59239 | 4.77E-09 |
| SERPINB9 | Serpin family B member 9 | -4.44572 | 1.60E-08 |
| AREG | Amphiregulin | -4.34269 | 2.54E-184 |
| TKTL1 | Transketolase like 1 | -4.10354 | 2.56E-07 |
| RU2B | U2 small nuclear ribonucleoprotein B | -3.85723 | 6.94E-10 |
| CXCL10 | C-X-C motif chemokine ligand 10 | -3.83186 | 2.89E-05 |
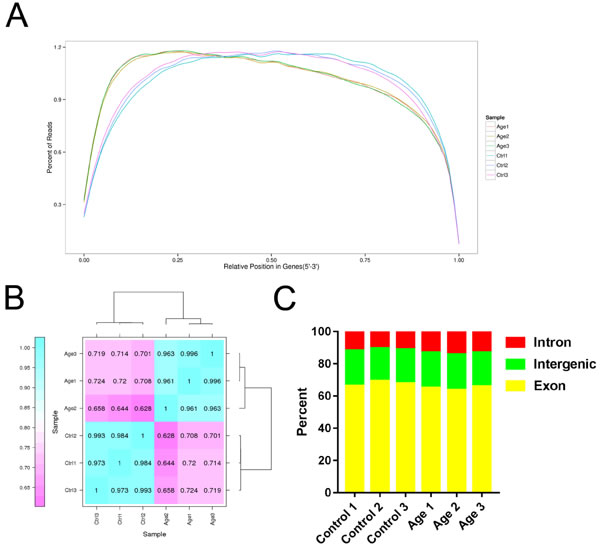
Figure 2: Overview of RNA sequencing data. A. The distribution of mapped reads on mRNA (5′-3′). Data in reflects the percentage of mapped reads assigned to all regions of mRNA. The location of the normalized mRNA is on the horizontal (x) axis; the percentage of reads as compared to total mapped reads for the position is on the vertical (y) axis. B. Heat map of the biological replicates. C. Reads mapped to different regions of the gene.
Based on the FPKM, six samples showed a similar expression level, and most of the mRNAs detected in RNA-seq were from protein-coding genes (Figure 3A and 3B). Additionally, volcano plots representing the differential expression of genes were drawn, in which, gene expression ratios and the significance of differential gene expression are displayed on the X and Y axis, respectively (Figure 3C). The results of unsupervised hierarchical clustering of the differentially expressed genes (DEGs) are presented in a heat map which showed a clear discrimination between the two groups (Figure 3D).
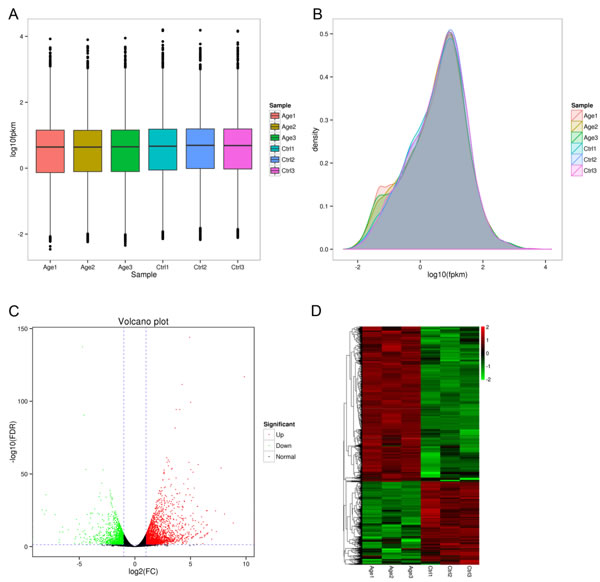
Figure 3: Overview of differentially expressed genes. A. The number of differentially expressed mRNAs by sample. B. FPKM distributions in each sample. C. Volcano plot of genes differentially expressed in each sample. The log2 fold change difference is represented on the x-axis and negative log of FDR is represented on the y-axis. Each point represents a gene which had detectable expression in the 6 samples. The significant up-regulated genes are plotted in red on the right side and down-regulated genes plotted in green on the left side. The no significant differentially expressed genes were shown in dark points in the middle and the bottom. D. Expression differences are shown as different colors. Red indicates up-regulated while green indicates down-regulated gene expression.
Gene ontology (GO) and KEGG pathway enrichment analysis
The most enriched GO terms for DEGs are shown in Figure 4A (Total information was listed in Supplementary File 4). The most enriched GO terms for newly identified DEGs are shown in Figure 4B. GO analyses of the newly identified DEGs were also performed (As shown in Supplementary File 4).
A total of 1818 DEGs were assigned to KEGG annotations (Figure 5A), of which 25 enriched pathways were significantly changed (P < 0.01) including the pathway in cancer, PI3K-Akt signaling pathway, focal adhesion, proteoglycans in cancer, and cAMP signaling pathway (as shown in Figure 5B and Table 4.), and the numbers of up-regulated and down-regulated DEGs in most enriched pathways were shown in Figure 5C and Supplementary File 5.
Table 4: All the significantly changed pathways in porcine GC during aging (P<0.01)
Pathway |
DGEs in term |
All genes in term |
Rich Factor |
P-value |
Q-value |
Pathway ID |
Pathways in Cancer |
128 (4.9%) |
718 (3.98%) |
0.178272980501393 |
0.006292627 |
1.031292e-01 |
ko05200 |
PI3K-Akt signaling pathway |
114 (4.36%) |
634 (3.51%) |
0.17981072555205 |
0.007344795 |
1.070215e-01 |
ko04151 |
Focal adhesion |
96 (3.67%) |
496 (2.75%) |
0.193548387096774 |
0.001518009 |
5.597658e-02 |
ko04510 |
Proteoglycans in Cancer |
93 (3.56%) |
467 (2.59%) |
0.199143468950749 |
0.0007058003 |
4.164222e-02 |
ko05205 |
cAMP signaling pathway |
71 (2.72%) |
361 (2%) |
0.196675900277008 |
0.003890199 |
9.302484e-02 |
ko04024 |
Adrenergic signaling in cardiomycytes |
53 (2.03%) |
264 (1.46%) |
0.200757575757576 |
0.007605771 |
1.070215e-01 |
ko04261 |
cGMP-PKG signaling pathway |
62(2.37%) |
303(1.68%) |
0.204620462046205 |
0.00264789 |
8.679198e-02 |
ko04022 |
Platelet activition |
53 (2.03%) |
260 (1.44%) |
0.203846153846154 |
0.005571454 |
9.668111e-02 |
ko04611 |
ECM-receptor interaction |
54 (2.07%) |
247 (1.37%) |
0.218623481781377 |
0.001064528 |
5.116876e-02 |
ko04512 |
Melanogenesis |
37 (1.42%) |
168 (0.93%) |
0.220238095238095 |
0.005287348 |
9.668111e-02 |
ko04916 |
Amoebiasis |
53 (2.03%) |
237 (1.31%) |
0.223628691983122 |
0.0006811799 |
4.164222e-02 |
ko05146 |
Protein digestion and absorption |
45 (1.72%) |
189 (1.05%) |
0.238095238095238 |
0.000412861 |
4.059800e-02 |
ko04974 |
Adipocytokine signaling pathway |
29 (1.11%) |
122 (0.68%) |
0.237704918032787 |
0.004151216 |
9.302484e-02 |
ko04920 |
Central carbon metabolism in cancer |
26 (1%) |
108 (0.6%) |
0.240740740740741 |
0.00537483 |
9.668111e-02 |
ko05230 |
Prion diease |
26 (1%) |
105 (0.58%) |
0.247619047619048 |
0.00359846 |
9.302484e-02 |
ko05020 |
Regulation of lipolysis in adipocytes |
24 (0.92%) |
96 (0.53%) |
0.25 |
0.004414738 |
9.302484e-02 |
ko04923 |
Ribosome biogenesis in eukaryotes |
29 (1.11%) |
113 (0.63%) |
0.256637168141593 |
0.001214174 |
5.116876e-02 |
ko03008 |
Type II diabetes mellitus |
24 (0.92%) |
94 (0.52%) |
0.25531914893617 |
0.003302304 |
9.302484e-02 |
ko04930 |
PPAR signaling pathway |
39 (1.49%) |
149 (0.83%) |
0.261744966442953 |
0.0001245343 |
1.836881e-02 |
ko03320 |
Axon guidance |
90 (3.44%) |
344 (1.91%) |
0.261627906976744 |
7.418738e-09 |
2.188528e-06 |
ko04360 |
Ovarian steroidogenesis |
20 (0.77%) |
79 (0.44%) |
0.253164557 |
0.007657 |
1.07E-01 |
ko04913 |
Oxytocin signaling pathway |
60 (2.3%) |
306 (1.69%) |
0.196078431 |
0.007981 |
1.07E-01 |
ko04921 |
Salivary secretion |
40 (1.53%) |
190 (1.05%) |
0.210526316 |
0.008535 |
1.09E-01 |
ko04970 |
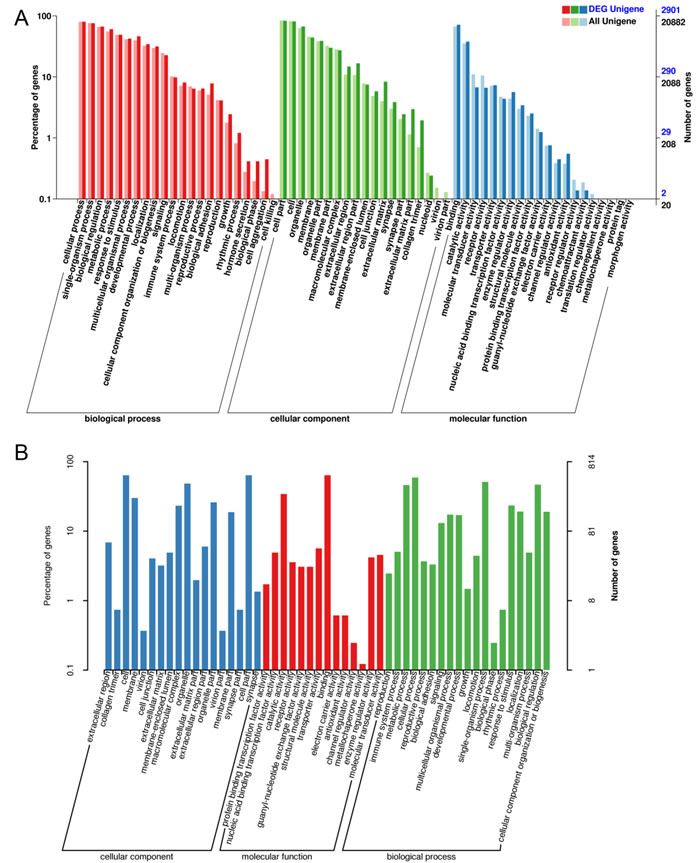
Figure 4: The differential expression of mRNA in aged GCs was analyzed by Gene Ontology (GO) annotation. A. GO analysis of differentially expressed genes in aged GCs. DEG Unigene: differentially expressed genes number in all annotation Biological Process GO term. All Unigene: Unigene number in all annotation Biological Process GO term. B. GO analysis of new detected genes.
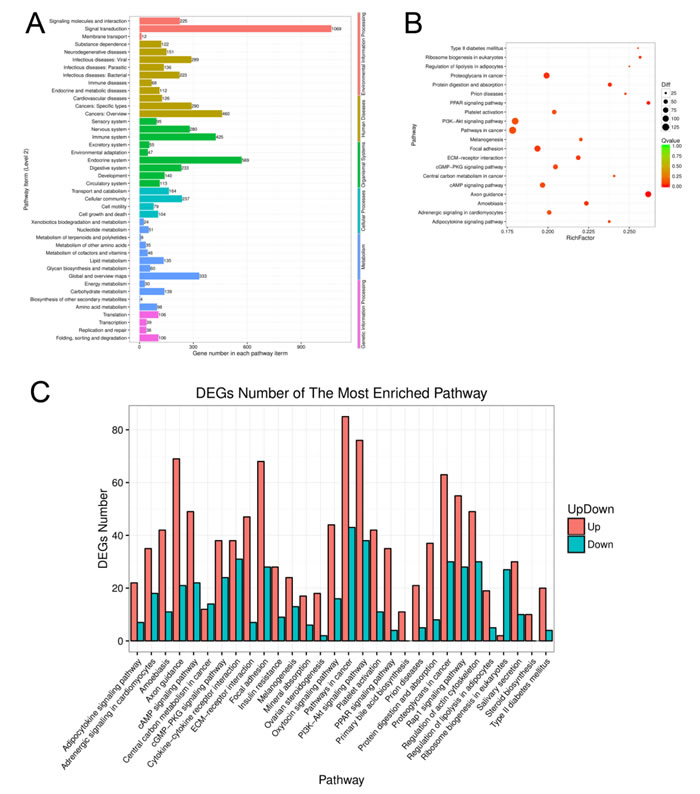
Figure 5: Function analysis of the differentially expressed genes of aging GCs. A. KEGG pathway enrichment analysis of differentially expressed genes from aging GCs. B. Pathway enrichment analysis among DEGs. Different colors indicate different enrichment factors. The size of the plot corresponds to the number of genes. C. The numbers of up- and down-regulated genes in the most enrichment pathways.
Validation of representative genes by QRT-PCR
Based on scanning electron microscopy and RNA-seq data, 15 genes of interest including genes associated with extracellular matrix remodeling (TIMP3, MMP2, MMP3, and CTGF), energy metabolism (PPARγ and SLC2A1), ovarian steroidogenesis (StAR, CYP11A1 and LHCGR) and 6 top differently expressed genes (CEBPB, CXCL12, ANGPT2, IGFBP3, AREG and BBOX1) were selected to be validated by QRT-PCR. As shown in Figure 6, 6 genes (CEBPB, CXCL12, StAR, MMP2, CYP11A1, and LHCGR) were significantly up-regulated, and 9 genes (PPARγ, SLC2A1, TIMP3, MMP3, CTGF, ANGPT2, AREG, BBOX1, and IGFBP3) were significantly down-regulated in aging GCs, which were consistent with the RNA-seq data. These results indicated that RNA-seq generated a reliable dataset for the transcriptome analysis of aging GCs.
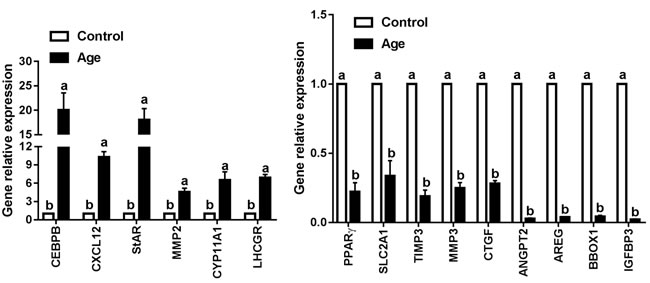
Figure 6: Validation the interested genes identified by RNA-seq using QRT-PCR. QRT-PCR was performed to make comparisons between control and aging GCs. Results are expressed as the mean ± SEM of at least 3 independent experiments and values with different letters are significantly different (P < 0.05).
Discussion
GCs surrounding the oocyte are defined as the immediate ovarian microenvironment, thus, the processes of GCs required for supporting oocyte development may be the underlying targets for endocrine perturbations associated with aging [32]. Although several studies have established the relationship between poor oocyte quality and GC dysfunction in human and animal models [12, 33, 34], the effects of aging on physiological functions in GCs and their molecular mechanisms have not been widely examined. In this study, we simulated the aging process by extending the culture time, which has been suggested to closely mimic the process of aging [35, 36].
RNA-seq is a powerful tool for characterizing and quantifying the transcriptomes. In the present study, transcriptome analysis revealed that 3411 genes were differentially expressed; 2193 genes were up-regulated and 1218 genes were down-regulated during in vitro aging in GCs. KEGG pathway analysis revealed that 25 pathways including pathway in cancer (128 DEGs), PI3K-Akt signaling pathway (114 DEGs), focal adhesion (96 DEGs), proteoglycans in cancer (93 DEGs), and cAMP signaling pathway (71 DEGs) were significantly changed (P < 0.01). Based on these results, we believe that these differentially expressed pathways may be the key pathways that affect GC functions during aging.
Aging contributes to processes such as metabolic dysfunction, DNA damage, and reactive oxygen species (ROS) generation and can be considered as the progressive failure of balance in the body, resulting in impaired functions, health decline, and diseases [37-39]. As described above, aging can reduce lipid metabolism in GCs. Lipids are essential for physiological processes such as the maintenance of membrane integrity [37]. ROS can cause lipid peroxidation, which is closely associated with impaired mitochondrial function and changes in lipid metabolism. In this study, we analyzed the extracellular ultrastructure of the aging GCs by scanning electron microscopy. The results showed that membrane integrity was significantly impaired in aging GCs. The membranes of aging cells were rough and had many cavitations. In addition, the formation of filopodia was reduced (Figure 1). It is well-known that polyunsaturated phospholipids are the major components of the membrane, ROS-induced lipid peroxidation can damage these lipids and reduce membrane fluidity [40], which may explain the reduced formation of filopodia in this study. Membrane fluidity also modulates the functions of membrane proteins, such as ion channels and transporters, as well as various types of membrane receptors [41-46]. Even slightly changes in membrane fluidity may cause cellular dysfunction or induce pathological processes [47, 48]. Similarly, a loss of filopodia has been observed in ROS-overexpressing human breast cancer cells and lung cancer cells [49, 50], while the suppression of ROS was found to enhance the formation of filopodia [51]. Taken together, aging could up-regulate ROS, leading to decreased mitochondrial function, and disruption of membrane integrity and fluidity via lipid peroxidation, which may affect GC functions and result in low fertility in elderly women.
In addition to the cell membrane, the extracellular matrix (ECM) was also affected by aging. The ECM is a collection of molecules secreted by cells. Because of its diverse nature and composition, the ECM has many functions, such as providing support, segregating tissues from one another, and regulating intercellular communication. The ECM is vital for supporting ovarian follicle growth and maintaining its function, and it is involved in follicle development, cell migration, proliferation, and growth. In the present study, RNA-seq analyses showed that the expression levels of genes related to the ECM were significantly altered in aging GCs. For example, connective tissue growth factor (CTGF), also known as CCN2, is a cysteine-rich ECM protein that plays important roles in a variety of cellular functions, including cell proliferation, differentiation, apoptosis, migration adhesion, and ECM remodeling [52]. Indeed, CTGF ovarian conditional knockout mice were found to exhibit multiple reproductive defects and severe sub-fertility [53]. In our study, the decrease in CTGF was confirmed by QRT-PCR. Similarly, other studies have also reported the aging-related down-regulation of CTGF and organ dysfunctions [54].
ECM metabolism (including remodeling, homeostasis and turnover) is primarily regulated by matrix metalloproteinases (MMPs) and their endogenous inhibitors, tissue inhibitors of metalloproteinase (TIMPs) [55]. For the precise remodeling of the ECM, a delicate balance must exist between the activities of MMPs and TIMPs. Situations in which this control is lost may lead to pathological conditions [55]. Based on our results, TIMP3 expression was significantly attenuated in aging GCs. MMP2, MMP15, MMP23B and MMP17 were up-regulated, and MMP1, MMP3, and MMP16 were down-regulated. These results suggest that the balance of MMPs and TIMPs may be disrupted in aging GCs. However, thus far few studies have investigated the expression patterns and functions of MMPs and TIMP3 in aging GCs.
Disturbances in metabolism can also impair GC functions in particular, a failure in energy metabolism would be fatal. It is well-documented that glucose is a major source of metabolic energy for all mammalian cells [56] and is primarily transported across the plasma membrane through glucose transporters (GLUTs), also known as solute carrier family 2 (SLC2) [57, 58]. Among these transporters, GLUT1 (also known as SLC2A1) is considered as the predominant isoform [59]. The deregulated expression of GLUTs has been implicated in several pathological processes. For example, up-regulated GLUTs increase glucose uptake and accelerate tumor cell growth, resulting in poor survival [60-63]. GLUT1 overexpression is also closely related to glomerulosclerosis development [64] and results in the excess production of ECM proteins [65]. Accordingly, the inhibition of GLUT1 could significantly reduce cell viability and proliferation [66, 67], and contribute to an anticancer effects [68]. Interestingly, the knock down of GLUT1 expression can result in low CTGF expression [69], this finding is in agreement with our results. According to the RNA-seq and QRT-PCR results in this study, the expression of GLUT1 was significantly decreased in GCs during aging. These results suggest that aging-induced GLUT1 down-regulated and glucose uptake suppression are factors that could impair GC functions.
GLUT1 expression is regulated by transcriptional factors that bind to the promoter sequence. Various studies have demonstrated that peroxisome proliferator pctivated peceptor-γ (PPARγ) is a key regulator of GLUT1 expression [70-73]. The relationship between ROS and PPARγ has been determined previously; for example, when treated with organophosphate compounds, salmon liver cells showed decreased PPARγ expression and increased ROS production [74], which were restored to normal levels following antioxidant treatment [75]. Moreover, aging was found to suppress PPARγ in aged mouse model [76]. The Klotho beta (KLB) gene, originally identified as an aging-suppressor gene, could promote cell proliferation and differentiation; the overexpression of KLB has been reported to significantly enhance the expression of PPARγ [77]. In our study, both PPARγ and KLB were significantly decreased in aging GCs. Therefore, we believe that aging/ROS-KLB-PPARγ-GLUT1 signaling pathway dysfunction maybe involved in aging GCs.
As previously reported, a characteristic of aging GCs is premature luteinization [78, 79]. CCAAT/enhancer binding proteins beta (CEBPB) is an essential regulator of luteinization [80]. CEBPB belongs to the CEBP basic-leucine zipper transcription factor family. It has been reported to increase following ovulations and hCG stimulation in porcine GCs [81, 82]. CEBPB has also been shown to participate in steroidogenic acute regulatory protein (StAR) regulations by interacting with an E-box in the stimulation of PKC/forskolin or gonadotropin/cAMP activation in GCs and luteal cells [83]. Furthermore, CEBPB plays an important role in cAMP-induced CYP11A1 and LHCGR expression [80, 84]. Based on our data, CEBPB was markedly increased in GCs during aging, accordingly, LHCGRR, StAR and CYP11A1 were increased. These results convert with that in elderly women and mares [85, 86]. These results suggested that CEBPB may play important roles in GC aging; however, further studies are required to confirm its function.
Insulin-like growth factor binding protein 3 (IGFPB3) has dual functions in regulating IGF activity; the soluble form of IGFBP3 inhibits the activity of IGF1 by suppressing receptor binding, whereas surface-associated IGFBP3 enhances the growth-promoting effects of IGF1 [87]. Aging has been reported is a factor that decreases IGFBP3 expressions in human columns cells [88], and low IGFBP3 levels always result in the arrest of oocyte or embryo development [89]. In addition, angiopoietin 2 (ANGPT2) is an angiogenic factor that plays an important role in the modulation of angiogenesis and vasculogenesis; thus, it is a vital factor in corpus luteum development. ANGPT2 expression has been reported to be increased by PKC and PKA activators in GCs [90] and in the early luteal phase [91]. Moreover, ANGPT2 expression was found to be increased by hCG in leydig cells [92], and decreased in aging endothelial cells [93]. In the present study, IGFBP3 and ANGPT2 were the two most down-regulated genes in aging GCs and were confirmed by QRT-PCR. These results revealed the involvement of both the IGFBP3 and ANGPT2 in aging in GCs via the suppression of oocyte development and angiogenesis.
In conclusion, we used RNA-seq to examine the gene expression profiles of aging GCs in vitro. Several DEGs were detected and the possible pathways were predicted by KEGG analyses. These results provide a foundation for further studies on aging. However, the precise functions of these pathways remain unknown; thus further studies are required to confirm our results.
MATERIALS AND METHODS
Granulosa cells isolation, cultivation and treatment
Ovaries of prepubertal gilts aged 170-180 days were obtained from a local slaughterhouse and transported to the laboratory in a vacuum thermos flask in sterile physiological saline at 37 °C within 2 h of isolation. After ovaries were thoroughly washed with sterile physiological saline at 37 °C, follicular fluid and GCs were aspirated from follicles with 6-8 mm in diameter that contained clear follicle fluid using 10 mL syringe with 20-gauge needle. The cells were then transferred to a 15 mL centrifuge tube, and 1 mL of 0.25% trypsin was added to digest cell lumps. Following incubation at 37 °C for 3-5 min to disperse clumps of cells, 1 mL of 10% fetal bovine serum (FBS)-supplemented Dulbecco’s modified Eagle’s medium/Ham’s F-12 nutrient mixture (DMEM/F12, without phenol red) was added to the tube to terminate trypsin digestion. The cells were then centrifuged at 800×g for 15 min to be precipitated and then washed twice with phosphate-buffered saline (PBS). Cell density was adjusted to 5 × 10⁶ cells in a 6 cm dish, in 2 mL of DMEM/F12 containing 10% FBS and 1 ng/mL porcine pituitary FSH (F2293, Sigma), with the supplementation of FSH, it can stimulates GCs growth and prevented from luteinization in vitro, and also inhibits the apoptosis [94]. The cells were incubated under a humidified atmosphere containing 5% CO2 at 37 °C for 24 h, and then washed with PBS to remove the unattached cells.
After an initial 24 h culture as described above, the cells were divided into two groups (control group and in vitro aging group) randomly. Then, the culture media were replaced with fresh DMEM/F12 containing 10% FBS, 0.1 μM 19-hydroxyandrostenedione (Sigma) and 1 ng/mL porcine pituitary FSH for further 3 h (control group) and 48 h (in vitro aging group) culture, respectively. Culture medium in aging group was changed at 24 h to diminish the negative effect of metabolic byproducts [95].
Ultrastructure observation by scanning electron microscope
GCs were cultured on coverslips and treated as described before. Then, the cultured GCs were fixed according to scanning electron microscopy (SEM) methods. Briefly, samples were fixed for 1 day in 2.5 % glutaraldehyde in 0.1 M phosphate buffer and rinsed briefly in distilled water at room temperature. Then the specimens were dehydrated in a series of graded concentrations of ethanol (50 %, 70 %, 80 %, and 90 % for 15 min each, finally at 100 % ethanol for 30 min, 3 times) and critical point dried in a K850 dryer (Quorum, UK). The dried specimens were mounted on metal stubs, coated with gold film (10 nm) using 108Auto Sputter Coater (Cressington, UK) and observed using a scanning electron microscope (Carl Zeiss, EVO LS10, DE) with an accelerating voltage of 10 kV.
RNA quantification, library construction and sequencing analysis
After treatment, cells were harvested using TRIzol reagent (Invitrogen, USA). Cell samples were collected from 3 separated experiments. After the total RNA were obtained, the degradation, DNA contamination and purity were monitored by 1.5% agarose gel and Nanodrop 2000 spectrophotometer (Thermo Fisher, Wilmington, DE), respectively. RNA integrity was assessed using RNA Nano 6000 Assay Kit and Agilent Bioanalyzer 2100 system (Agilent Technologies, CA, USA).
The 6 RNA-seq libraries (3 RNA-seq libraries for Control and 3 RNA-seq libraries for aging GCs) were generated using an Illumina TruSeqTMRNA Sample Preparation Kit (Illumina, San Diego, USA) as the manufacturer’s instructions. The libraries were sequenced by pair-end sequencing on an Illumina HiSeq 2000 platform and 100 bp paired end reads were generated. The base quality distribution of different RNA-seq library was summarized. Raw data (raw reads) of fastq format were firstly processed through in-house perl scripts. Clean data (clean reads) were obtained by removing reads containing adapter, reads containing ploy-N and low quality reads from raw data. At the same time, Q30, GC-content and sequence duplication levels of the clean data were calculated.
Identification of differentially expressed genes
Based on RNA sequencing, gene expression levels were measured as the number of reads per kb of exon regions per million mapped reads (RPKM). DEGs were detected with the R package DEGseq software. A corrected P-value of 0.05 and a |log2 (fold change)| of 1 were set as the threshold for statistically significant differential expression. For the genes that were differentially expressed in aging GCs, the unigene numbers were converted to Entrez Gene ID numbers using the online g: profile conversion tool (http://biit.cs.ut.ee/gprofiler/).
GO enrichment analysis and KEGG pathway enrichment analysis
To facilitate elucidating the biological functions of the differentially expressed genes (DEGs), Gene Ontology (GO) analysis was usually performed. The enrichment analysis of the DEGs was implemented using the topGO-R software packages. GO annotations were according to NCBI (http://www.ncbi.nlm.nih.gov), UniProt (http://www.uniprot.org/) and the Gene Ontology (http://www.geneontology.org/). GO terms with corrected P values less than 0.05 were considered significantly enriched [96]. Pathway analysis software KOBAS was used to test the statistical enrichment of differentially expressed genes according to the Kyoto Encyclopedia of Genes and Genomes (KEGG) database (http://www.genome.jp/kegg). A corrected P-value of 0.05 was set as the threshold to identify significantly different pathways [96] and P-values were adjusted by Benjamini-Hochberg method [97].
Validation of RNA-Seq data by quantitative real time RT-PCR assays
Real-time quantitative polymerase chain reaction was performed to quantify the mRNA expression levels of GAPDH, PCRs were carried out in a 20 μL reaction volume containing SYBR Green I Master Mix (TaKaRa, China) and 100ng cDNA template. An ABI 7500 system (Applied Biosystems; Foster City, CA, USA) was used to detect the amplification products. Upon completion of the real-time qPCR, threshold cycle (Ct) values were calculated by ABI 7500 software V.2.0.6 (Applied Biosystems; Foster City, CA, USA). The levels of gene expression were expressed in the comparative ΔCt method using the formula of 2-ΔΔCt and normalized to the expression levels of the GAPDH internal housekeeping gene. All the primers used in this study as shown in Supplementary Table 1. Three separate experiments were performed on different cultures, and each sample was assayed in triplicate.
Statistical analysis
Differences gene expressions in GCs between treated and control groups, were analyzed by one-way analysis of variance (ANOVA). Results are presented as the mean ± SEM of at least three separate experiments performed on different cultures. All statistical analyses were performed with SAS software Version 8.01 (SAS Institute Inc.; Cary, NC, USA). P < 0.05 was considered significantly different.
Author contributions
Hui Li and Zhendan Shi conceived the project and design the protocol; Hui Li, Shuangshuang Guo and Jianning Yu performed the experiments; Hui Li and Zhendan Shi wrote the manuscript. All authors read and approved the final manuscript.
ACKNOWLEDGMENTS
We are grateful to Total Genomics Solution Technologies Co. Ltd and Biomarker Technologies Co. Ltd for transcriptome sequencing and analysis.
CONFLICTS OF INTEREST
The authors have declared that no competing interests exist.
FUNDING
This study was supported by the National Science Foundation of China (grant no. 31402080), and Natural Science Foundation of Jiangsu Province (grant no. BK20151365).
REFERENCES
1. Tatone C, Amicarelli F, Carbone MC, Monteleone P, Caserta D, Marci R, Artini PG, Piomboni P, Focarelli R. Cellular and molecular aspects of ovarian follicle ageing. Hum Reprod Update. 2008; 14:131-142.
2. O’Connor KA, Holman DJ, Wood JW. Declining fecundity and ovarian ageing in natural fertility populations. Maturitas. 1998; 30:127-136.
3. Hull MG, Fleming CF, Hughes AO, McDermott A. The age-related decline in female fecundity: a quantitative controlled study of implanting capacity and survival of individual embryos after in vitro fertilization. Fertil Steril. 1996; 65:783-790.
4. Ito M, Muraki M, Takahashi Y, Imai M, Tsukui T, Yamakawa N, Nakagawa K, Ohgi S, Horikawa T, Iwasaki W, Iida A, Nishi Y, Yanase T, et al. Glutathione S-transferase theta 1 expressed in granulosa cells as a biomarker for oocyte quality in age-related infertility. Fertil Steril. 2008; 90:1026-1035.
5. Burwinkel TH, Buster JE, Scoggan JL, Carson SA. Basal follicle stimulating hormone (FSH) predicts response to controlled ovarian hyperstimulation (COH)-intrauterine insemination (IUI) therapy. J Assist Reprod Genet. 1994; 11:24-27.
6. Faddy MJ. Follicle dynamics during ovarian ageing. Mol Cell Endocrinol. 2000; 163:43-48.
7. de Bruin JP, Dorland M, Spek ER, Posthuma G, van Haaften M, Looman CW, te Velde ER. Age-related changes in the ultrastructure of the resting follicle pool in human ovaries. Biol Reprod. 2004; 70:419-424.
8. Broekmans FJ, Soules MR, Fauser BC. Ovarian aging: mechanisms and clinical consequences. Endocr Rev. 2009; 30:465-493.
9. Dumesic DA, Meldrum DR, Katz-Jaffe MG, Krisher RL, Schoolcraft WB. Oocyte environment: follicular fluid and cumulus cells are critical for oocyte health. Fertil Steri. 2015; 103:303-316.
10. Jancar N, Kopitar AN, Ihan A, Virant Klun I, Bokal EV. Effect of apoptosis and reactive oxygen species production in human granulosa cells on oocyte fertilization and blastocyst development. J Assist Reprod Genet. 2007; 24:91-97.
11. Denkova R, Bourneva V, Staneva-Dobrovski L, Zvetkova E, Baleva K, Yaneva E, Nikolov B, Ivanov I, Simeonov K, Timeva T, Yankov M. In vitro effects of inhibin on apoptosis and apoptosis related proteins in human ovarian granulosa cells. Endocr Regul. 2004; 38:51-55.
12. Matsuda F, Inoue N, Manabe N, Ohkura S. Follicular growth and atresia in mammalian ovaries: regulation by survival and death of granulosa cells. J Reprod Dev. 2012; 58:44-50.
13. Liu X, Qiao P, Jiang A, Jiang J, Han H, Wang L, Ren C. Paracrine Regulation of Steroidogenesis in Theca Cells by Granulosa Cells Derived from Mouse Preantral Follicles. Biomed Res Int. 2015; 2015:925691.
14. Thomas FH, Vanderhyden BC. Oocyte-granulosa cell interactions during mouse follicular development: regulation of kit ligand expression and its role in oocyte growth. Reprod Biol Endocrinol. 2006; 4:19.
15. Albertini DF, Combelles CM, Benecchi E, Carabatsos MJ. Cellular basis for paracrine regulation of ovarian follicle development. Reproduction. 2001; 121:647-653.
16. Su YQ, Sugiura K, Eppig JJ. Mouse oocyte control of granulosa cell development and function: paracrine regulation of cumulus cell metabolism. Semin Reprod Med. 2009; 27:32-42.
17. Sugiura K, Pendola FL, Eppig JJ. Oocyte control of metabolic cooperativity between oocytes and companion granulosa cells: energy metabolism. Dev Biol. 2005; 279:20-30.
18. Carabatsos MJ, Sellitto C, Goodenough DA, Albertini DF. Oocyte-granulosa cell heterologous gap junctions are required for the coordination of nuclear and cytoplasmic meiotic competence. Dev Biol. 2000; 226:167-179.
19. Eppig JJ, O’Brien M. In vitro maturation and fertilization of oocytes isolated from aged mice: a strategy to rescue valuable genetic resources. J Assist Reprod Genet. 1995; 12:269-273.
20. Zhu J, Lin FH, Zhang J, Lin J, Li H, Li YW, Tan XW, Tan JH. The signaling pathways by which the Fas/FasL system accelerates oocyte aging. Aging (Albany NY). 2016; 8:291–303. https://doi.org/10.18632/aging.100893.
21. Zhu J, Zhang J, Li H, Wang TY, Zhang CX, Luo MJ, Tan JH. Cumulus cells accelerate oocyte aging by releasing soluble Fas ligand in mice. Sci Rep. 2015; 5:8683.
22. Qiao TW, Liu N, Miao DQ, Zhang X, Han D, Ge L, Tan JH. Cumulus cells accelerate aging of mouse oocytes by secreting a soluble factor(s). Mol Reprod Dev. 2008; 75:521-528.
23. Miao YL, Liu XY, Qiao TW, Miao DQ, Luo MJ, Tan JH. Cumulus cells accelerate aging of mouse oocytes. Biol Reprod. 2005; 73:1025-1031.
24. Ben-Meir A, Yahalomi S, Moshe B, Shufaro Y, Reubinoff B, Saada A. Coenzyme Q-dependent mitochondrial respiratory chain activity in granulosa cells is reduced with aging. Fertil Steril. 2015; 104:724-727.
25. Hurwitz JM, Jindal S, Greenseid K, Berger D, Brooks A, Santoro N, Pal L. Reproductive aging is associated with altered gene expression in human luteinized granulosa cells. Reprod Sci. 2010; 17:56-67.
26. Iwata H. Age-associated changes in granulosa cells and follicular fluid in cows. J Reprod Dev. 2017; 63:339–45.
27. Sadraie SH, Saito H, Kaneko T, Saito T, Hiroi M. Effects of aging on ovarian fecundity in terms of the incidence of apoptotic granulosa cells. J Assist Reprod Genet. 2000; 17:168-173.
28. Tatone C, Carbone MC, Falone S, Aimola P, Giardinelli A, Caserta D, Marci R, Pandolfi A, Ragnelli AM, Amicarelli F. Age-dependent changes in the expression of superoxide dismutases and catalase are associated with ultrastructural modifications in human granulosa cells. Mol Hum Reprod. 2006; 12:655-660.
29. Zhang D, Zhang X, Zeng M, Yuan J, Liu M, Yin Y, Wu X, Keefe DL, Liu L. Increased DNA damage and repair deficiency in granulosa cells are associated with ovarian aging in rhesus monkey. J Assist Reprod Genet. 2015; 32:1069-1078.
30. Goto H, Iwata H, Takeo S, Nisinosono K, Murakami S, Monji Y, Kuwayama T. Effect of bovine age on the proliferative activity, global DNA methylation, relative telomere length and telomerase activity of granulosa cells. Zygote. 2013; 21:256-264.
31. McReynolds S, Dzieciatkowska M, McCallie BR, Mitchell SD, Stevens J, Hansen K, Schoolcraft WB, Katz-Jaffe MG. Impact of maternal aging on the molecular signature of human cumulus cells. Fertil Steril. 2012; 98:1574-1580 e1575.
32. Buccione R, Schroeder AC, Eppig JJ. Interactions between somatic cells and germ cells throughout mammalian oogenesis. Biol Reprod. 1990; 43:543-547.
33. Assou S, Haouzi D, De Vos J, Hamamah S. Human cumulus cells as biomarkers for embryo and pregnancy outcomes. Mol Hum Reprod. 2010; 16:531-538.
34. Huang Z, Wells D. The human oocyte and cumulus cells relationship: new insights from the cumulus cell transcriptome. Mol Hum Reprod. 2010; 16:715-725.
35. Gottfried C, Tramontina F, Goncalves D, Goncalves CA, Moriguchi E, Dias RD, Wofchuk ST, Souza DO. Glutamate uptake in cultured astrocytes depends on age: a study about the effect of guanosine and the sensitivity to oxidative stress induced by H(2)O(2). Mech Ageing Dev. 2002; 123:1333–40.
36. Klamt F, Gottfried C, Tramontina F, Dal-Pizzol F, Da Frota ML Jr, Moreira JC, Dias RD, Moriguchi E, Wofchuk S, Souza DO. Time-related increase in mitochondrial superoxide production, biomolecule damage and antioxidant enzyme activities in cortical astrocyte cultures. Neuroreport. 2002; 13:1515-1518.
37. Ademowo OS, Dias HK, Burton DG, Griffiths HR. Lipid (per) oxidation in mitochondria: an emerging target in the ageing process? Biogerontology. 2017.
38. Cho SJ, Moon JS, Lee CM, Choi AM, Stout-Delgado HW. Glucose Transporter 1-Dependent Glycolysis Is Increased during Aging-Related Lung Fibrosis, and Phloretin Inhibits Lung Fibrosis. Am J Respir Cell Mol Biol. 2017; 56:521-531.
39. Kudryavtseva AV, Krasnov GS, Dmitriev AA, Alekseev BY, Kardymon OL, Sadritdinova AF, Fedorova MS, Pokrovsky AV, Melnikova NV, Kaprin AD, Moskalev AA, Snezhkina AV. Mitochondrial dysfunction and oxidative stress in aging and cancer. Oncotarget. 2016; 7:44879–905. https://doi.org/10.18632/oncotarget.9821.
40. Garcia JJ, Lopez-Pingarron L, Almeida-Souza P, Tres A, Escudero P, Garcia-Gil FA, Tan DX, Reiter RJ, Ramirez JM, Bernal-Perez M. Protective effects of melatonin in reducing oxidative stress and in preserving the fluidity of biological membranes: a review. J Pineal Res. 2014; 56:225-237.
41. Emmerson PJ, Clark MJ, Medzihradsky F, Remmers AE. Membrane microviscosity modulates mu-opioid receptor conformational transitions and agonist efficacy. J Neurochem. 1999; 73:289-300.
42. Oghalai JS, Zhao HB, Kutz JW, Brownell WE. Voltage- and tension-dependent lipid mobility in the outer hair cell plasma membrane. Science. 2000; 287:658-661.
43. Parks JS, Huggins KW, Gebre AK, Burleson ER. Phosphatidylcholine fluidity and structure affect lecithin:cholesterol acyltransferase activity. J Lipid Res. 2000; 41:546-553.
44. Prasad R, Kumar V, Kumar R, Singh KP. Thyroid hormones modulate zinc transport activity of rat intestinal and renal brush-border membrane. Am J Physiol. 1999; 276:E774-782.
45. Sunshine C, McNamee MG. Lipid modulation of nicotinic acetylcholine receptor function: the role of membrane lipid composition and fluidity. Biochim Biophys Acta. 1994; 1191:59-64.
46. Tekpli X, Holme JA, Sergent O, Lagadic-Gossmann D. Role for membrane remodeling in cell death: implication for health and disease. Toxicology. 2013; 304:141-157.
47. Garcia-Gil FA, Albendea CD, Lopez-Pingarron L, Royo-Dachary P, Martinez-Guillen J, Piedrafita E, Martinez-Diez M, Soria J, Garcia JJ. Altered cellular membrane fluidity levels and lipid peroxidation during experimental pancreas transplantation. J Bioenerg Biomembr. 2012; 44:571-577.
48. Miana-Mena FJ, Piedrafita E, Gonzalez-Mingot C, Larrode P, Munoz MJ, Martinez-Ballarin E, Reiter RJ, Osta R, Garcia JJ. Levels of membrane fluidity in the spinal cord and the brain in an animal model of amyotrophic lateral sclerosis. J Bioenerg Biomembr. 2011; 43:181-186.
49. Bai H, Jin H, Yang F, Zhu H, Cai J. Apigenin induced MCF-7 cell apoptosis-associated reactive oxygen species. Scanning. 2014; 36:622-631.
50. Pongrakhananon V, Chunhacha P, Chanvorachote P. Ouabain suppresses the migratory behavior of lung cancer cells. PLoS One. 2013; 8:e68623.
51. Jiang J, Chuang DY, Zong Y, Patel J, Brownstein K, Lei W, Lu CH, Simonyi A, Gu Z, Cui J, Rottinghaus GE, Fritsche KL, Lubahn DB, et al. Sutherlandia frutescens ethanol extracts inhibit oxidative stress and inflammatory responses in neurons and microglial cells. PLoS One. 2014; 9:e89748.
52. Brigstock DR. The CCN family: a new stimulus package. J Endocrinol. 2003; 178:169-175.
53. Nagashima T, Kim J, Li Q, Lydon JP, DeMayo FJ, Lyons KM, Matzuk MM. Connective tissue growth factor is required for normal follicle development and ovulation. Mol Endocrinol. 2011; 25:1740-1759.
54. Falke LL, Kinashi H, Dendooven A, Broekhuizen R, Stoop R, Joles JA, Nguyen TQ, Goldschmeding R. Age-dependent shifts in renal response to injury relate to altered BMP6/CTGF expression and signaling. Am J Physiol Renal Physiol. 2016; 311:F926–34.
55. Curry TE Jr, Osteen KG. The matrix metalloproteinase system: changes, regulation, and impact throughout the ovarian and uterine reproductive cycle. Endocr Rev. 2003; 24:428–65.
56. Chen LQ, Cheung LS, Feng L, Tanner W, Frommer WB. Transport of sugars. Annu Rev Biochem. 2015; 84:865-894.
57. Mueckler M, Thorens B. The SLC2 (GLUT) family of membrane transporters. Mol Aspects Med. 2013; 34:121-138.
58. Thorens B. Glucose transporters in the regulation of intestinal, renal, and liver glucose fluxes. Am J Physiol. 1996; 270:G541-553.
59. Heilig CW, Liu Y, England RL, Freytag SO, Gilbert JD, Heilig KO, Zhu M, Concepcion LA, Brosius FC 3rd. D-glucose stimulates mesangial cell GLUT1 expression and basal and IGF-I-sensitive glucose uptake in rat mesangial cells: implications for diabetic nephropathy. Diabetes. 1997; 46:1030-1039.
60. Macheda ML, Rogers S, Best JD. Molecular and cellular regulation of glucose transporter (GLUT) proteins in cancer. J Cell Physiol. 2005; 202:654-662.
61. Pereira KM, Chaves FN, Viana TS, Carvalho FS, Costa FW, Alves AP, Sousa FB. Oxygen metabolism in oral cancer: HIF and GLUTs (Review). Oncol Lett. 2013; 6:311-316.
62. Szablewski L. Expression of glucose transporters in cancers. Biochim Biophys Acta. 2013; 1835:164-169.
63. Zhao FQ. Biology of glucose transport in the mammary gland. J Mammary Gland Biol Neoplasia. 2014; 19:3-17.
64. Heilig CW, Deb DK, Abdul A, Riaz H, James LR, Salameh J, Nahman NS Jr. GLUT1 regulation of the pro-sclerotic mediators of diabetic nephropathy. Am J Nephrol. 2013; 38:39–49.
65. Heilig CW, Concepcion LA, Riser BL, Freytag SO, Zhu M, Cortes P. Overexpression of glucose transporters in rat mesangial cells cultured in a normal glucose milieu mimics the diabetic phenotype. J Clin Invest. 1995; 96:1802-1814.
66. Chen Q, Meng YQ, Xu XF, Gu J. Blockade of GLUT1 by WZB117 resensitizes breast cancer cells to adriamycin. Anticancer Drugs. 2017; 28:880–87.
67. Zhao X, Lu C, Chu W, Zhang B, Zhen Q, Wang R, Zhang Y, Li Z, Lv B, Li H, Liu J. MicroRNA-124 suppresses proliferation and glycolysis in non-small cell lung cancer cells by targeting AKT-GLUT1/HKII. Tumour biology : the journal of the International Society for Oncodevelopmental Tumour Biol. 2017; 39:1010428317706215.
68. Gunnink LK, Alabi OD, Kuiper BD, Gunnink SM, Schuiteman SJ, Strohbehn LE, Hamilton KE, Wrobel KE, Louters LL. Curcumin directly inhibits the transport activity of GLUT1. Biochimie. 2016; 125:179-185.
69. Andrianifahanana M, Hernandez DM, Yin X, Kang JH, Jung MY, Wang Y, Yi ES, Roden AC, Limper AH, Leof EB. Profibrotic up-regulation of glucose transporter 1 by TGF-beta involves activation of MEK and mammalian target of rapamycin complex 2 pathways. FASEB J. 2016; 30:3733-3744.
70. Liao W, Nguyen MT, Yoshizaki T, Favelyukis S, Patsouris D, Imamura T, Verma IM, Olefsky JM. Suppression of PPAR-gamma attenuates insulin-stimulated glucose uptake by affecting both GLUT1 and GLUT4 in 3T3-L1 adipocytes. Am J Physiol Endocrinol Metab. 2007; 293:E219-227.
71. Mudaliar S, Henry RR. New oral therapies for type 2 diabetes mellitus: The glitazones or insulin sensitizers. Annu Rev Med. 2001; 52:239-257.
72. Hulstrom V, Hojlund K, Vinten J, Beck-Nielsen H, Levin K. Adiponectin and its response to thiazolidinediones are associated with insulin-mediated glucose metabolism in type 2 diabetic patients and their first-degree relatives. Diabetes Obes Metab. 2008; 10:1019-1028.
73. Li Q, Cai Y, Huang J, Yu X, Sun J, Yang Z, Zhou L. Resistin impairs glucose permeability in EA.hy926 cells by down-regulating GLUT1 expression. Mol Cell Endocrinol. 2016; 434:127-134.
74. Arukwe A, Carteny CC, Eggen T. Lipid peroxidation and oxidative stress responses in juvenile salmon exposed to waterborne levels of the organophosphate compounds tris(2-butoxyethyl)- and tris(2-chloroethyl) phosphates. J Toxicol Environ Health A. 2016; 79:515-525.
75. Katsuyama Y, Tsuboi T, Taira N, Yoshioka M, Masaki H. 3-O-Laurylglyceryl ascorbate activates the intracellular antioxidant system through the contribution of PPAR-gamma and Nrf2. J Dermatol Sci. 2016; 82:189-196.
76. Zhang Z, Yuan H, Zhao H, Qi B, Li F, An L. PPARgamma activation ameliorates postoperative cognitive decline probably through suppressing hippocampal neuroinflammation in aged mice. Int Immunopharmacol. 2017; 43:53-61.
77. Fan J, Sun Z. The Antiaging Gene Klotho Regulates Proliferation and Differentiation of Adipose-Derived Stem Cells. Stem Cells. 2016; 34:1615-1625.
78. Klein NA, Battaglia DE, Miller PB, Branigan EF, Giudice LC, Soules MR. Ovarian follicular development and the follicular fluid hormones and growth factors in normal women of advanced reproductive age. J Clin Endocrinol Metab. 1996; 81:1946-1951.
79. Klein NA, Soules MR. Endocrine changes of the perimenopause. Clin Obstet Gynecol. 1998; 41:912-920.
80. Fan HY, Liu Z, Johnson PF, Richards JS. CCAAT/enhancer-binding proteins (C/EBP)-alpha and -beta are essential for ovulation, luteinization, and the expression of key target genes. Mol Endocrinol. 2011; 25:253-268.
81. Sirois J, Richards JS. Transcriptional regulation of the rat prostaglandin endoperoxide synthase 2 gene in granulosa cells. Evidence for the role of a cis-acting C/EBP beta promoter element. J Biol Chem. 1993; 268:21931-21938.
82. Gillio-Meina C, Hui YY, LaVoie HA. Expression of CCAAT/enhancer binding proteins alpha and beta in the porcine ovary and regulation in primary cultures of granulosa cells. Biol Reprod. 2005; 72:1194-1204.
83. Silverman E, Eimerl S, Orly J. CCAAT enhancer-binding protein beta and GATA-4 binding regions within the promoter of the steroidogenic acute regulatory protein (StAR) gene are required for transcription in rat ovarian cells. J Biol Chem. 1999; 274:17987-17996.
84. Okada M, Lee L, Maekawa R, Sato S, Kajimura T, Shinagawa M, Tamura I, Taketani T, Asada H, Tamura H, Sugino N. Epigenetic Changes of the Cyp11a1 Promoter Region in Granulosa Cells Undergoing Luteinization During Ovulation in Female Rats. Endocrinology. 2016; 157:3344-3354.
85. Wu YG, Barad DH, Kushnir VA, Lazzaroni E, Wang Q, Albertini DF, Gleicher N. Aging-related premature luteinization of granulosa cells is avoided by early oocyte retrieval. J Endocrinol. 2015; 226:167-180.
86. Sessions-Bresnahan DR, Carnevale EM. Age-associated changes in granulosa cell transcript abundance in equine preovulatory follicles. Reprod Fertil Dev. 2015; 27:906-913.
87. Conover CA, Ronk M, Lombana F, Powell DR. Structural and biological characterization of bovine insulin-like growth factor binding protein-3. Endocrinology. 1990; 127:2795-2803.
88. Al-Edani T, Assou S, Ferrieres A, Bringer Deutsch S, Gala A, Lecellier CH, Ait-Ahmed O, Hamamah S. Female aging alters expression of human cumulus cells genes that are essential for oocyte quality. BioMed Res Int. 2014; 2014:964614.
89. Wang TH, Chang CL, Wu HM, Chiu YM, Chen CK, Wang HS. Insulin-like growth factor-II (IGF-II), IGF-binding protein-3 (IGFBP-3), and IGFBP-4 in follicular fluid are associated with oocyte maturation and embryo development. Fertil Steril. 2006; 86:1392-1401.
90. Witt PS, Pietrowski D, Keck C. PKA- and PKC-dependent regulation of angiopoietin 2 mRNA in human granulosa lutein cells. Horm Metab Res. 2004; 36:82-5.
91. Sugino N, Suzuki T, Sakata A, Miwa I, Asada H, Taketani T, Yamagata Y, Tamura H. Angiogenesis in the human corpus luteum: changes in expression of angiopoietins in the corpus luteum throughout the menstrual cycle and in early pregnancy. J Clin Endocrinol Metab. 2005; 90:6141-6148.
92. Haggstrom Rudolfsson S, Johansson A, Franck Lissbrant I, Wikstrom P, Bergh A. Localized expression of angiopoietin 1 and 2 may explain unique characteristics of the rat testicular microvasculature. Biol Reprod. 2003; 69:1231-1237.
93. Hohensinner PJ, Ebenbauer B, Kaun C, Maurer G, Huber K, Wojta J. Reduced Ang2 expression in aging endothelial cells. Biochem Biophys Res Commun. 2016; 474:447-451.
94. Shen M, Jiang Y, Guan Z, Cao Y, Li L, Liu H, Sun SC. Protective mechanism of FSH against oxidative damage in mouse ovarian granulosa cells by repressing autophagy. Autophagy. 2017; 13:1364–85.
95. Harman D. Free radical theory of aging: an update: increasing the functional life span. Ann N Y Acad Sci. 2006; 1067:10-21.
96. Anders S, Reyes A, Huber W. Detecting differential usage of exons from RNA-seq data. Genome Res. 2012; 22:2008-2017.
97. Benjamini Y, Hochberg Y. Controlling the false discovery rate: a practical and powerful approach to multiple testing. JSTOR. 1995; 57: 289-300.