
INTRODUCTION
Estrogen receptor (ER) is the ligand-dependent transcriptional factor. ER belongs to the nuclear receptor family. ERα and ERβ are the two major isoforms reported for ER [1–3]. The two isoforms have different functions with various concentrations in tissues. Compared to ERα, ERβ has wider tissue distribution [4]. ERβ has similar structure architecture with other nuclear receptor proteins and contains 3 distinct domains: (i) N-terminal domain (NTD), (ii) DNA-binding domain (DBD), and (iii) Ligand-binding domain (LDB) or C-terminal domain (CTD). The NTD and LBD contain ligand responsive transcriptional activation function 1 (AF1) and activation function 2 (AF2) domains. The AF1 and AF2 domains are responsible for the regulation of the transcriptional activity of ERβ [5]. ERβ DBD and LBD had shown more than 95% and 55% sequence similarity with ERα DBD and LBD, respectively. The ERβ NTD is shorter than the ERα NTD and shows a very low sequence homology [6]. ERβ presents in both the nucleus and cytoplasm of the normal and cancer cells while ERα which presents in nuclei of benign and cancer cells. The cytoplasmic ERβ binds with the estradiol or agonist and moves into the nucleus to form homo-dimer and then binds with the specific estrogen response elements (EREs) to activate the transcription process through the interaction between the transcriptional modulators and recruitment of the general transcriptional machinery [7]. ERβ may act as a marker in various types of cancers and a significant predictor in the breast cancer treated with tamoxifen [8]. ERβ is a potential cancer target, highly expressed in various cancers which are reported as a negative for ERα [9]. The gene expression of ERβ is different from ERα which plays an important role in the breast and uterine cancers. Due to the high similarity between the two isoforms, it is highly challenging to design or identify compounds which specifically target one subtype. Emerging data for ER indicates that the identification of selective agonist or antagonist for ERβ will help treat various cancers such as colon, breast, prostate, and lungs with lower side effects. Hence ERβ is considered as one of the emerging oncogene target.
Selective estrogen receptor modulator (SERM) is a drug or small molecule that acts as an agonist or antagonist by specifically binding to one of these two ER isoforms in the target tissues based on its specificity. The difference in binding activity to the two ER isoforms of a chemical is the metric for determination of chemicals that specifically bind for ERα or ERβ. The main mechanism of SERMs is to alter the estrogenic activity in the target tissues specificity. SERMs can selectively block the estrogens action in the breast cells and activate the estrogens action in bone, liver, and uterine cells. Hence, identification of selective estrogenic activity compound is an important task in drug discovery. Experimental identification of selective estrogenic activity compound is doable but very expensive and time consuming from a large pool of chemicals. Hence, in silico approaches for screening potential selective estrogenic activity compounds are in need. Some prediction models were developed using different in silico techniques such as pharmacophore model and molecular docking [10, 11].
Multiple quantitative structure activity relationship (QSAR) models have been developed for predicting ERα binding activity using large sets of chemicals to ensure prediction reliability [12, 13]. Previously, we developed an ERα predictive model using the data set from Estrogenic Activity Database (EADB) and validated the model using a large data set from ToxCast [13]. Some QSAR models have been developed for predicting ERβ binding activity based on small sizes of chemicals of the particular scaffolds that cover a small chemical space [14–22]. Many factors affect the quality of a QSAR model, including the number of compounds and their chemical space coverage used for training, the algorithm used to train the model, and the method for validation of the model. More reliable QSAR models for ERβ binding activity need to be developed using large sets of diverse chemicals covering a large chemical space. Hence, in this study, we developed a QSAR model for predicting ERβ binding activity using large sets of chemicals which covers a wide range of chemical space.
DF (Decision Forest) algorithm [23–25] was used for development of the ERβ binding activity prediction model. The large set of chemicals and their ERβ binding activity data were collected from EADB [26, 27] and used to train the QSAR model. The compounds from the ToxCast data were used as an application data set to estimate concordance between the ERβ model predictions by traditional assay and the high-throughput screening results. The important molecular descriptors for ERβ binding were identified using the cross validations. Prediction confidence was analyzed to provide an additional metric for application of the ERβ QSAR model.
RESULTS
Cross validations
One thousand 5-fold cross validations were conducted to assess the goodness and robustness of the ERβ predictive models constructed from the training set. The results of the cross validations were summarized in Figure 1 (the blue bars). The average prediction accuracy, sensitivity, and specificity values for the 1000 5-fold cross validations were 93.1%, 93.6%, and 55.2%, respectively, indicating the ERβ predictive models performed well. Moreover, the standard deviations of prediction accuracy, sensitivity, and specificity in the 1000 cross validations were 0.6%, 0.7%, and 6.1%, respectively. The small fluctuation in the performance of the models in the cross validations demonstrated the robustness of the ERβ predictive models generated in the cross validations. Not surprisingly, the average specificity was low because much fewer ERβ non-binders than binders were included in the training data set. It is expected that specificity could be improved when more ERβ non-binders were identified for training the model.
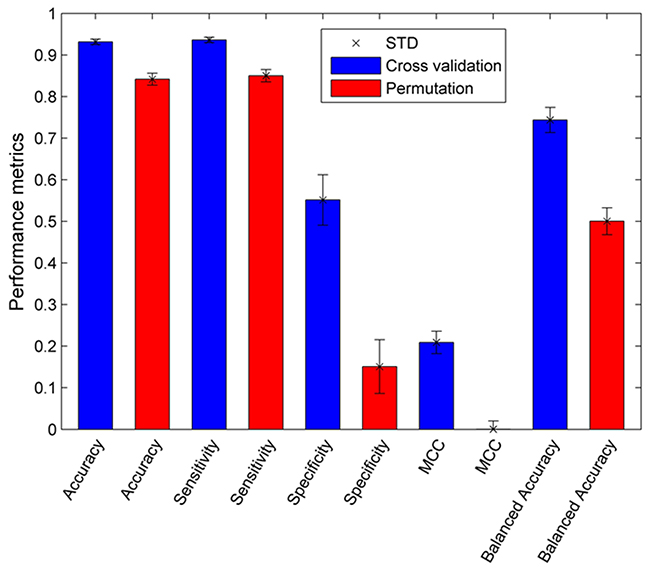
Figure 1: Performance of the 5-fold cross validations (blue bars) and permutation tests (red bars). Standard deviations were given on top of the bars. Performance metrics are indicated at the x-axis.
Permutation tests
The same performance metrics (prediction accuracy, sensitivity, and specificity) were calculated for the ERβ prediction models constructed in the 1000 permutation tests and were plotted as the red bars in Figure 1. The predictive accuracy, sensitivity, specificity, MCC, and balanced accuracy values for the 1000 permutation tests were 84.2%, 85.0%, 15.1%, 0.0%, and 50.0%, respectively, and their corresponding standard deviations were 1.5%, 1.5%, 6.5%, 2.0%, and 3.2%, respectively. The 0.0% MCC and 50.0% balanced accuracy obtained from the permutations matched the expectation for modeling random data sets, confirming the modeling process should be implemented correctly. The performance comparison between the 5-fold cross validations and permutation tests revealed that the 5-fold cross validations much outperformed the permutation tests, demonstrating the ERβ predictive models constructed from the training set had a good predictive power and were obtained unlikely solely by chance.
Prediction confidence
The confidence analysis was performed on the predictions from the 5-fold cross validations. The predictions near evenly distributed in the 10 prediction confidence bins as shown by the black diamonds in Figure 2. When the prediction confidence increased, the performance of the corresponding predictions was also improved (accuracy, sensitivity, and specificity were all increased as depicted by the red, blue, and cyan circles, respectively). It is worth to note that when prediction confidence reached 0.8 or higher, the predictions were extremely accurate, close to 100% (95% for specificity). The prediction confidence analysis demonstrated that prediction confidence could be an additional metric for real application of the ERβ predictive model developed in this study.
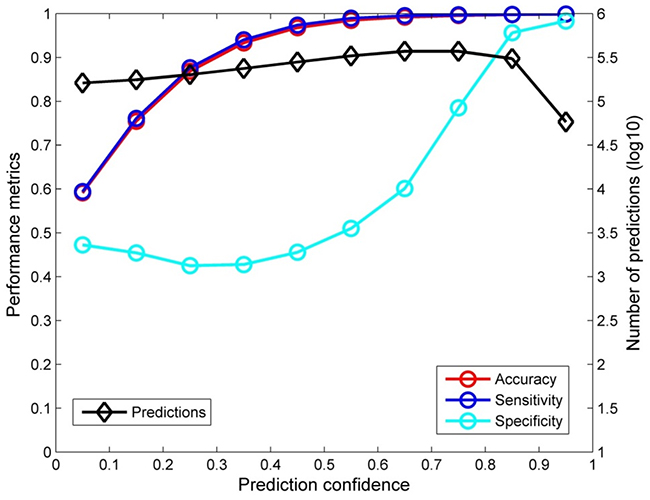
Figure 2: Confidence analysis result. The accuracy (red circles), sensitivity (blue circles), and specificity (cyan circles) were given at the left y-axis and the numbers of predictions were plotted as black diamonds at the right y-axis for 10 even prediction confidence bins that were indicated at the x-axis.
Informative descriptors
The 447 molecular descriptors in the training set were used in different predictive ERβ models generated in the 5-fold cross validations. The frequency (number of models) of each descriptor in the cross validations were calculated. These 447 molecular descriptors were then ranked by their frequency values. The top 18 descriptors were shown in Supplementary Table 1. Close up at the 18 descriptors revealed three physical chemical properties (atomic polarizability, electronegative, and van der Waals) were informative to the prediction models and should play major roles in ERβ binding of chemicals. The findings are consistent with our previously developed ERα model that revealed molecular weight, van der Waals volume, polarizability, and aromatic rings are important for a chemical to bind ERα [13]. Comparative analysis on structures of the two proteins showed that the binding sites are similar for ERβ and ERα. Off the 23 residues in the binding pockets, only two (ERβ M336 and I373 versus ERα L384 and M421) are different (Supplementary Figure 1), confirming the similar chemical structural features for binding of the two receptors with a subtle difference (electronegative is important for ERβ binding and aromatic ring is vital to ERα binding).
Concordance between EADB and ToxCast
The experimental data of the 21 common compounds were compared to calculate the concordance between ToxCast ERβ dimerization assays activity and EADB ERβ binding activity. The 21 common compounds were all binders in EADB. ToxCast OT_ER_ERβERβ_0480 ERβ dimerization assay showed 15 actives and 6 inactives (Table 1), while ToxCast OT_ER_ERβERβ_1440 ERβ dimerization assay found 18 actives and 3 inactives (Table 2). If the experimental ERβ binding assay data in EADB were used to predict ToxCast ERβ dimerization data for the 21 common compounds, the prediction accuracy would be 71.4% and 85.7% for ToxCast OT_ER_ERβERβ_0480 and OT_ER_ERβERβ_1440 assays, respectively.
Table 1: Comparison between EADB and ToxCast data of common compounds
OT_ER_ERβERβ_0480 Assay |
Active |
Inactive |
Total |
|
|---|---|---|---|---|
Binder |
15 |
6 |
21 |
|
EADB |
Non-binder |
0 |
0 |
0 |
Total |
15 |
6 |
21 |
|
Table 2: Comparison between EADB and ToxCast data of common compounds
OT_ER_ERβERβ_1440 Assay |
Active |
Inactive |
Total |
|
|---|---|---|---|---|
Binder |
18 |
3 |
21 |
|
EADB |
Non-binder |
0 |
0 |
0 |
Total |
18 |
3 |
21 |
|
Applications to ToxCast data
The 1805 compounds that were tested using ToxCast OT_ER_ERβERβ_0480 assay and the 1800 compounds that were tested using ToxCast OT_ER_ERβERβ_1440 assay were predicted using the ERβ binding prediction model generated based on EADB data. Overall prediction accuracy for ERβ dimerization activity using the model was low, 28.4% and 26.7% for OT_ER_ERβERβ_0480 and OT_ER_ERβERβ_1440, respectively. Prediction confidence analysis showed that high confidence predictions performed better than low confidence predictions (Figure 3). As the training data set had much less non-binders than binders, it is expected that the model would have better prediction on ERβ binders than non-binders (Figure 1). We examined the performance of the model on actives in ERβ dimerization. Of the 175 actives from OT_ER_ERβERβ_0480 assay, 162 were predicted as ERβ binders (Table 3). The sensitivity 92.6% was very comparable to the sensitivity 93.6% in cross validations and 100% concordance for experimental actives and binders (Table 1). Of the 150 actives from OT_ER_ERβERβ_1440 assay, 135 were predicted as ERβ binders (Table 4). Again, the sensitivity 90% was close to the cross validation and experimental data comparison (Table 2). The prediction on actives in ToxCast ERβ dimerization assays indicated that the ERβ predictive model trained using ERβ binding activity data from EADB could be extrapolated well to predict actives in ERβ dimerization. As expected, extrapolation of the model to inactives should be very cautious as very low specificity was yield in the applications: 21.5% and 21.0% for OT_ER_ERβERβ_0480 and OT_ER_ERβERβ_1440 assays, respectively.
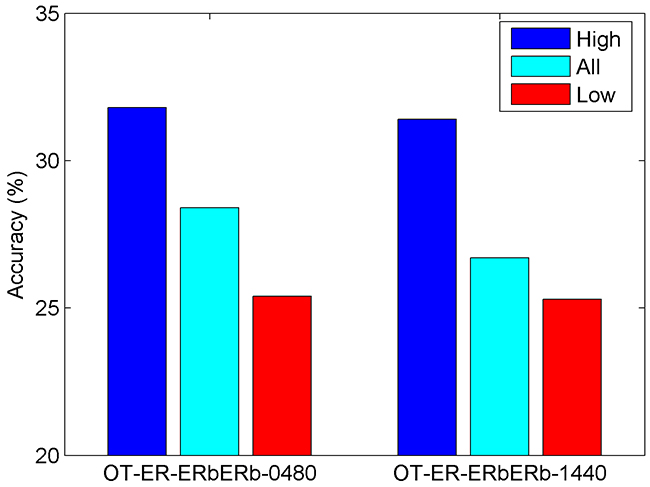
Figure 3: Result of application of the developed ERβ binding activity prediction model to the dimerization assays (labeled at the x-axis) in ToxCast. Overall prediction accuracy (cyan) and prediction accuracy for high confidence predictions (blue) and low confidence predictions (red) were plotted as bars.
Table 3: Predictions on OT_ER_ERβERβ_0480 assay data
OT_ER_ERβERβ_0480 |
Active |
Inactive |
Total |
|
|---|---|---|---|---|
Binder |
162 |
1280 |
1442 |
|
Prediction |
Non-binder |
13 |
350 |
363 |
Total |
175 |
1630 |
1805 |
|
Table 4: Predictions on OT_ER_ERβERβ_1440 assay data
OT_ER_ERβERβ_1440 |
Active |
Inactive |
Total |
|
|---|---|---|---|---|
Binder |
135 |
1304 |
1439 |
|
Prediction |
Non-binder |
15 |
346 |
361 |
Total |
150 |
1650 |
1800 |
|
DISCUSSION
The training set compounds were collected from the EADB with a well-defined end point (LogRBA) value which covers a wide range of ERβ binding activity. Multiple data points for the same compound were merged to a single value to classify the compound as an ERβ binder or non-binder. The training set has imbalanced distribution of ERβ binders (98.8%) and non-binders (1.2%). The high imbalance in samples is a challenging issue in machine learning. Even with the robust algorithm DF, the performance of the developed model is expected to be different between ERβ binders and non-binders. The analysis of performance of the 5-fold cross validations yielded a very high sensitivity (93.6%) and a low specificity (55.2%) are consistent with the expectation. The permutation tests results also confirmed that the bias to prediction on ERβ binders because of imbalanced samples even there were no signals in the data sets (randomly permuted samples). In addition to the difference in numbers of ERβ binders and non-binders, different chemical spaces covered by ERβ binders and non-binders were observed (Figure 4). The ERβ binders not only covered larger chemical space than non-binders but also had much higher density in the covered chemicals as shown in Figure 4. Much more chemical knowledge on ERβ binders than non-binders were learned by DF to generate the prediction model. It is not surprising that the prediction model had much better performance on ERβ binders than non-binders. Therefore, it is expected that including more non-binders in the training set would increase the chemical space of non-binders and improve performance of the prediction model based on a more balanced training set.
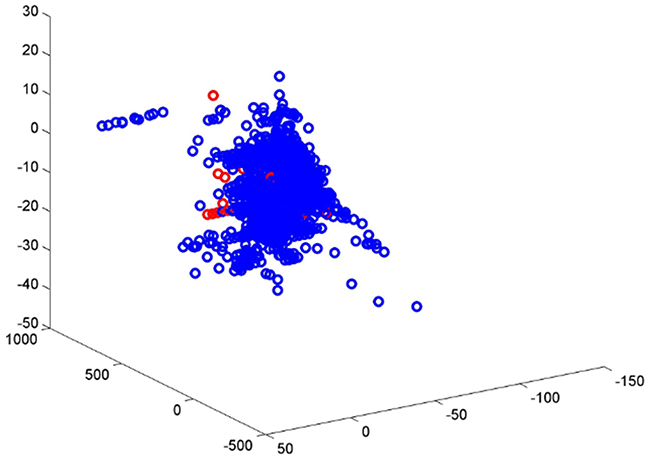
Figure 4: Chemical space of ERβ binders (blue circles) and non-binders (red circles).
We not only demonstrated overall goodness of the ERβ binding prediction model but also conducted prediction confidence analysis to provide an additional metric that can be used in real applications of the model. The confidence analysis of the cross validation results (Figure 2) revealed that the ERβ predictive models showed high accuracy for the predictions with high confidence, while the predictions with low confidence did not perform well, especially for the predictions with confidence less than 0.3 (Figure 2). Therefore, in real applications of our ERβ binding activity prediction model, utilization of predictions with low confidence should be cautious.
We applied the ERβ binding activity prediction model to the ERβ related active data in ToxCast to assess the capability of extrapolation of the model to other ERβ related endpoints such as the two ERβ dimerization assays. The application results revealed that the ERβ predictive model trained using the binding activity data from EABD was able to predict most of the actives from the two ERβ dimerization assays (Tables 3 and 4). However, as expected the ERβ predictive model did not show a good performance for predicting inactives from two ERβ dimerization assays. One of the reasons for the poor performance of the ERβ predictive model on the inactive chemicals in the dimerization assays might be due to the difference in the assays for the training data and application data. The gene expression modulated by ERβ is a cascade of events: ligand binding ERβ induces ERβ dimerization, translocation of ERβERβ dimers to the nucleus, and recognition of Estrogen Response Elements (EREs) on DNA. Binding assays and dimerization assays measure a chemical activity on two different events in the function mechanism. Therefore, extrapolation of the developed model to prediction of inactives from other ERβ related endpoints such as dimerization should be very cautious. The model could be improved by adding more inactive compounds in training to increase chemical space for inactivs.
Comparison between the cross validations and the applications revealed that extrapolation to ERβ dimerization assay data yield less accurate predictions than the cross validations, especially for the predictions on the inactives. The reasons for that could be (i) all the ERβ binders play a role in the dimerization of ERβ,(ii) the EADB reported binders are not necessary to lead a dimerization signal to be observed in the ERβ dimerization assays, and (iii) the traditional ERβ binding assays are different from the high-throughput screening assays.
The ERβ binding activity prediction model was developed and its prediction performance and extrapolation to other ERβ related endpoints data were demonstrated. Comparison of ERβ binding activity predicted by the model developed in this study with ERα binding activity estimated using our previous ERα model [13] could identify chemicals that specifically bind ERα or ERβ, facilitating drug discovery and development.
MATERIALS AND METHODS
Study design
The study design was depicted in Figure 5. The data sets were collected from two large data sources: EADB [26] and ToxCast databases [28, 29]. The compounds from EADB were used to develop the ERβ predictive model using DF. The ERβ binding affinity data from EADB (recorded as logarithmic value of relative binding activity (logRBA)) were used to determine ERβ binders or non-binders for the training compounds. The activity values for 1812 compounds from two ERβ related assays in the ToxCast were used to assess concordance between EADB and ToxCast data as well as to estimate the performance of the QSAR model for predicting ToxCast results. The common compounds contained in both EADB and ToxCast databases were used for assessing the concordance. The compounds only assayed in ToxCast were used for estimating the goodness of extrapolation of the QSAR model to high-through screening assays. The Mold2 software [30] was used to generate the molecular descriptors for compounds in the training and application sets. The generated molecular descriptors were preprocessed to remove the less informative descriptors. The preprocessed training data set were used to develop the ERβ predictive model using DF [2, 23, 31–33]. Robustness of performance of the ERβ predictive models were estimated through 5-fold cross-validations. Prediction confidence of the 5-fold cross-validation results was analyzed. The critical molecular descriptors to ERβ binding were identified by the analysis of their frequency in the models during the cross validations. Predictive power and chance correlation of the models were assessed using permutation tests. The developed model was then used to predict ERβ activity of chemical assayed in ToxCast.
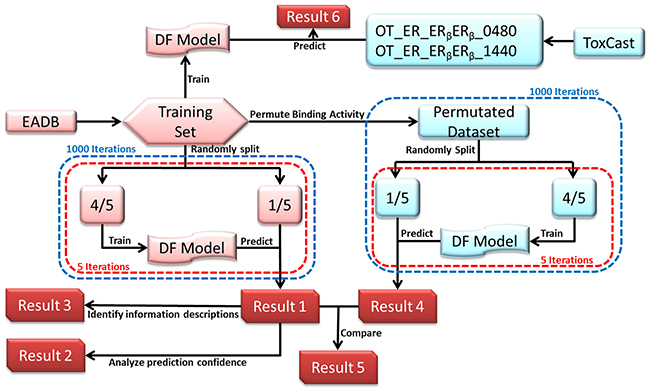
Figure 5: Study design. Data from EADB was used as a training set. Mold2 in-house software was used to generate the molecular descriptors for all compounds. Decision Forest (DF) classification method was used to generate ERβ predictive models. Five-fold cross validations (red dashed boxes) were conducted 1000 times (blue dashed boxes) in cross validations (left panel and Result 1) and permutation tests (right panel and Result 4). Based on the 5-fold cross validations, prediction confidence analysis was conducted (Result 2) and informative descriptor were identified (Result 3). ToxCast data of 2 dimerization assays were used assess the capability of the model (Result 6).
Data sets preparations
Training data set
The training set compounds were extracted from the FDA’s EADB [24, 26, 27, 31, 33-36]. The ERβ binding activity (binder or non-binder) for 2492 compounds were determined based on their logRBA (Relative Binding Affinity) values. The binding assays measure ERβ binding affinity of chemicals. Most of the ERβ binding activity data in EADB are determined using competitive binding assays. A competitive binding assay works by measuring how well a chemical competes with the radiolabeled ligand for the receptor ERβ and the binding affinity of the chemical is given as an IC50 value. For the experiments with the same reference chemical tested, the binding affinity IC50 values were converted into logRBA values. A compound was assigned as an ERβ binder if its logRBA value is equal to or greater than -5; otherwise the compound was determined as a non-binder (Figure 6). If a compound contains more than one logRBA value, it was assigned as an ERβ binder or non-binder based on the consensus. Of the 2492 training compounds, 2462 were determined as ERβ binders and only 30 were non-binders. The determination of ERβ binder or non-binder for the 2492 compounds was given in Supplementary Table 2.
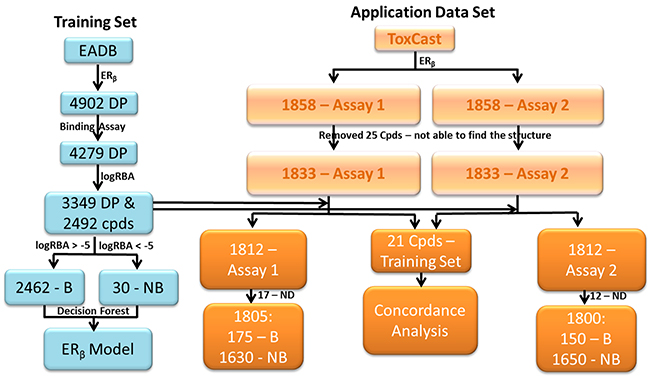
Figure 6: Data sets used in this study. Training data set was collected from EADB (left blue panel). Common data set contained 21 chemicals that had data in both ToxCast and EADB (middle of the right light brown panel). Application data sets were extracted from the two ERβ dimerization assays data in ToxCast (the right light brown panel) and not contained in the training data set. Assay 1- OT_ER_ERβERβ_0480 and Assay 2 – OT_ER_ERβERβ_1440. B – Binder and NB – Non-binder.
Application data sets
There are 1858 compounds in the ToxCast database that were tested by ERβ dimerization assays (http://epa.gov/ncct/toxcast/data.html, accessed on March 2, 2016) [28, 29, 37, 38] such as OT_ER_ERβERβ_0480 and OT_ER_ERβERβ_1440. These two assays use a yellow fluorescent protein reporter that is dissected into two fragments and fused to two ERβ to interact within a signaling complex. The reporter is fully assembled when ERβ dimerize. Therefore, when the ERβ molecules are physically separated, no signal is detected; however, when two ERβ are in close physical proximity, the two fragments from the reporter interact to elicit a signal. Changes in signal intensity and location are used to measure dimerization activity of a chemical. Twenty-five compounds which do not have CAS numbers were removed. Twenty one compounds were contained in both the training set and ToxCast. They were used for assessing the concordance between the ERβ binding assays in EADB and the high-throughput screening ERβ dimerization assays in ToxCast. After removed the 21 compounds, the remaining compounds and their ERβ dimerization assay data [39] from ToxCast were used as the application data sets for estimating the extrapolation capability of the ERβ binding activity prediction model. Among the 1812 compounds that were not included in the training set, 17 and 12 compounds were reported as not determined in OT_ER_ERβERβ_0480 and OT_ER_ERβERβ_1440 assays, respectively. The compounds in the application data sets were classified as active if their AC50 values are recorded in the ToxCast database; otherwise they were determined as inactive. Finally, 1805 (175 binders and 1630 non-binders) compounds for OT_ER_ERβERβ_0480 and 1800 (150 binders and 1650 non-binders) compounds for OT_ER_ERβERβ_1440 were used in the application data sets.
Mold2: Descriptor generation
Mold2 (http://www.fda.gov/ScienceResearch/BioinformaticsTools/Mold2) software [30] was used to generate molecular descriptors for the compounds in the training and application sets. Compounds in the SDF files were input into Mold2. Totally, 777 molecular descriptors were generated for each compound. Mold2 generates one-dimensional (e.g., molecular weight) and two dimensional (e.g., structural and bond information) descriptors. The generated molecular descriptors were pre-processed to remove the less informative descriptors (i.e., the same value for most of the chemicals in the training set). Out of 777 molecular descriptors, 330 descriptors are removed as they were considered as less informative (Supplementary Figure 2). Finally, 447 descriptors were subjected to the DF algorithm to generate the ERβ predictive model.
DF
DF is a powerful algorithm that combines multiple decision tree models to generate a consensus predictive model with high accuracy [23–25]. Each decision tree model is generated using a different set of molecular descriptors. The algorithm of DF consists of four steps. Initially, it constructs an individual decision tree using a pool of molecular descriptors; the molecular descriptors used in the previously generated decision tree model are then removed from the pool of molecular descriptors; the above two steps are repeated until no improvement can be achieved by adding more decision tree models; and finally, it combines all the decision tree models to make a final predictive model. DF is different from the Random Forests algorithm [40]. DF uses less decision trees that are constructed using all samples and variables. Therefore the trees are deep and accurate. In contract, Random Forests combines a large number of decision trees that are built using part of samples through bootstrapping and a small fraction of variables randomly selected. Thus, the trees are shallow and not accurate. The diversity of decision trees that is achieved by using different variables is the key to DF, while Random Forests ensures contributions of independent variables by randomization that requires a large number of such shallow trees.
Performance metrics
The performance of the ERβ predictive model can be measured using different metrics. Prediction accuracy, sensitivity, selectivity, Matthews’s correlation coefficient (MCC), and balanced accuracy were used in this study. The above mentioned metrics are computed using the following equations:
Balanced accuracy = (Sensitivity + Specificity) / 2
In the above equations, TP indicates true positives (number of actual binders are predicted as binders); TN represents true negatives (number of actual non-binders are predicted as non-binders); FP means false positives (number of actual non-binders are predicted as binders); and FN is false negatives (number of actual binders are predicted as non-binders).
Cross validation
Five-fold (5-fold) cross validations were used to evaluate the performance of ERβ predictive models. In a 5-fold cross validation, the training set was randomly divided into five equal subsets. Four subsets were used to generate a DF model and the remaining one subset was used to test the generated DF model. This process was repeated for each of the five subsets once and only once. The prediction results from the five subsets were then average to assess the prediction performance of the five DF models. To avoid possible chance correlation in the random division of a data set into five subsets, the 5-fold validation was repeated for 1000 times using different random divisions to reach a statistically reliable validation.
Permutation test
Permutation tests were used to estimate the predictive power of the generated models. In a permutation test, the ERβ binding activity data in the training data set were randomly scrambled to generate a permuted data set. A 5-fold cross validation test was performed on the permuted data set. The accuracy, specificity, and sensitivity of the 5-fold cross validation test were calculated to measure the chance correlation. To reach a statistically reliable estimation, this process was repeated for 1000 times to generate the 1000 permuted data sets for running 5-fold cross validations.
Prediction confidence analysis
Prediction confidence analysis was carried out not only to classify the compounds as ERβ binder and non-binder but also to estimate the probability of the compounds to be an ERβ binder or non-binder. Hence, the models were assessed based on not only the overall prediction performance but also the relationship between the prediction confidence levels and their performance. The prediction confidence value was calculated using the below equation.
Where P represents the probability of a chemical being an ERβ binder (0.5 <= P <=1) or non-binder (0 < P < 0.5). Prediction confidence is a value between 0 and 1. The larger the prediction confidence is, the more confident the prediction is. To conduct confidence analysis, the prediction confidence was calculated for each of the predictions from the 1000 iterations of 5-fold cross validations at first. The predictions were then put into 10 even bins based on their prediction confidence values. Prediction performance metrics were finally calculated for the predictions in each of the prediction confidence bins according to their actual and predicted ERβ binding activity.
Identification of informative descriptors
The importance of molecular descriptors in ERβ binding was estimated based on the frequency distribution of the descriptors used in the models in the 5-fold cross validations. A frequency value in the models from 5-fold cross validations was calculated for each of the molecular descriptors. The molecular descriptors were then ranked based on their frequency values. The descriptors that were used in more than 90% of the models were finally selected as the informative descriptors for the ERβ models.
Concordance between EADB and ToxCast
The two ERβ dimerization assays from ToxCast reported the estrogenic activity for >1800 compounds. Among the >1800 compounds, 21 had ERβ binding data in EADB. The ERβ binding data in EADB and the estrogenic activity data from high-throughput screening assays in ToxCast (Supplementary Table 3) were compared for the 21 common compounds to assess the correlation between the two types of assays (traditional and high-throughput screening assays). This analysis could help to understand how well the ERβ binding predictive model would be applied to data from different assays. The balanced accuracy was calculate for the two different ERβ dimerization assays in ToxCast relative to EADB, where EADB was used as a primary metrics to measure the activity data agreement between EADB and ToxCast assays.
Applications
The application data sets were used to assess the goodness of the ERβ binding activity prediction model in extrapolation to predicting chemicals for their high-throughput screening ERβ dimerization assays activity. The application data sets contain 1805 and 1800 compounds for OT_ER_ERβERβ_0480 and OT_ER_ERβERβ_1440 ERβ dimerization assays from ToxCast. The constructed ERβ binding activity predictive model was used to predict ERβ binders and non-binders for the chemicals in the application data sets. The accuracy, sensitive, selectivity, and balanced accuracy were calculated to assess the goodness of the ERβ binding activity predictive model, when the model was extrapolated to predicting outcome from high-throughput screening ERβ dimerization assays.
Disclaimer
The views expressed in this manuscript do not necessarily represent those of the U.S. Food and Drug Administration.
CONCLUSIONS
The ERβ predictive model was developed and cross validated using a large data set from EADB. The cross validations demonstrated the predictive power of the ERβ predictive model. The prediction confidence provides an additional metric for application of the ERβ predictive model. The important molecular descriptors linked to the knowledge of ligand binding to ER were identified. Applications of the developed model to ERβ dimerization assays data in ToxCast demonstrated the capability of extrapolation to other ERβ related endpoints data. Combination of the model developed in this study with our previous ERα binding activity prediction model could help to design or identify the selective compounds for ERβ and ERα which would be crucial in drug discovery and safety evaluation.
Abbreviations
ER – Estrogen receptor; SERMs – Selective estrogen receptor modulators; DF – Decision forest; EADB – Estrogenic Activity Database; NTD – N-terminal domain; DBD – DNA-binding domain; LBD – Ligand-binding domain; CTD – C-terminal domain; AF1 – Activation function 1; AF2 – Activation function 2; ERE – Estrogen response element; SERM – Selective estrogen receptor modulator; QSAR – Quantitative structure activity relationship; MCC – Matthew’s correlation coefficient; TP – True positive; TN – True negative; FP – False positive; FN – False negative.
ACKNOWLEDGMENTS
The content of this study is solely the responsibility of the authors, as the findings and conclusions in this article have not been formally disseminated by the U.S. Food and Drug Administration (FDA) and should not be construed to represent the FDA determination or policy.
CONFLICTS OF INTEREST
The authors declare that they have no conflicts of interest.
FUNDING
The work for this article was funded by NCTR-appropriated funds. This research was supported in part by an appointment to the Research Participation Program at the National Center for Toxicological Research (S.S and C.S) administered by the Oak Ridge Institute for Science and Education through an interagency agreement between the U.S. Department of Energy and the U.S. Food and Drug Administration.
REFERENCES
1. Farooq A. Structural and Functional Diversity of Estrogen Receptor Ligands. Curr Top Med Chem. 2015; 15:1372-84.
2. Shiau AK, Barstad D, Radek JT, Meyers MJ, Nettles KW, Katzenellenbogen BS, Katzenellenbogen JA, Agard DA, Greene GL. Structural characterization of a subtype-selective ligand reveals a novel mode of estrogen receptor antagonism. Nat Struct Biol. 2002; 9:359-64. https://doi.org/10.1038/nsb787.
3. Ng HW, Perkins R, Tong W, Hong H. Versatility or promiscuity: the estrogen receptors, control of ligand selectivity and an update on subtype selective ligands. Int J Environ Res Public Health. 2014; 11:8709-42. https://doi.org/10.3390/ijerph110908709.
4. Zhao C, Dahlman-Wright K, Gustafsson JA. Estrogen receptor beta: an overview and update. Nucl Recept Signal. 2008; 6:e003. https://doi.org/10.1621/nrs.06003.
5. Beato M. Gene regulation by steroid hormones. Cell. 1989; 56:335-44.
6. Kumar R, Zakharov MN, Khan SH, Miki R, Jang H, Toraldo G, Singh R, Bhasin S, Jasuja R. The dynamic structure of the estrogen receptor. J Amino Acids. 2011; 2011:812540. https://doi.org/10.4061/2011/812540.
7. Smith CL, O’Malley BW. Coregulator function: a key to understanding tissue specificity of selective receptor modulators. Endocr Rev. 2004; 25:45-71. https://doi.org/10.1210/er.2003-0023.
8. Haldosén LA, Zhao C, Dahlman-Wright K. Estrogen receptor beta in breast cancer. Mol Cell Endocrinol. 2014; 382:665-72. http://dx.doi.org/10.1016/j.mce.2013.08.005.
9. Gallo D, De Stefano I, Grazia Prisco M, Scambia G, Ferrandina G. Estrogen receptor beta in cancer: an attractive target for therapy. Curr Pharm Des. 2012; 18:2734-57.
10. Chen L, Wu D, Bian HP, Kuang GL, Jiang J, Li WH, Liu GX, Zou SE, Huang J, Tang Y. Selective ligands of estrogen receptor β discovered using pharmacophore mapping and structure-based virtual screening. Acta Pharmacologica Sinica. 2014; 35:1333-41. https://doi.org/10.1038/aps.2014.69.
11. Shen J, Jiang J, Kuang G, Tan C, Liu G, Huang J, Tang Y. Discovery and structure-activity analysis of selective estrogen receptor modulators via similarity-based virtual screening. Eur J Med Chem. 2012; 54:188-96. https://doi.org/10.1016/j.ejmech.2012.04.041.
12. Mansouri K, Abdelaziz A, Rybacka A, Roncaglioni A, Tropsha A, Varnek A, Zakharov A, Worth A, Richard AM, Grulke CM, Trisciuzzi D, Fourches D, Horvath D, et al. CERAPP: Collaborative Estrogen Receptor Activity Prediction Project. Environ Health Perspect. 2016; 124:1023-33. https://doi.org/10.1289/ehp.1510267.
13. Ng HW, Doughty SW, Luo H, Ye H, Ge W, Tong W, Hong H. Development and Validation of Decision Forest Model for Estrogen Receptor Binding Prediction of Chemicals Using Large Data Sets. Chem Res Toxicol. 2015; 28:2343-51. https://doi.org/10.1021/acs.chemrestox.5b00358.
14. Taha MO, Tarairah M, Zalloum H, Abu-Sheikha G. Pharmacophore and QSAR modeling of estrogen receptor beta ligands and subsequent validation and in silico search for new hits. J Mol Graph Model. 2010; 28:383-400. https://doi.org/10.1016/j.jmgm.2009.09.005.
15. Niu AQ, Xie LJ, Wang H, Zhu B, Wang SQ. Prediction of selective estrogen receptor beta agonist using open data and machine learning approach. Drug Des Devel Ther. 2016; 10:2323-31. https://doi.org/10.2147/dddt.s110603.
16. Zhang L, Sedykh A, Tripathi A, Zhu H, Afantitis A, Mouchlis VD, Melagraki G, Rusyn I, Tropsha A. Identification of putative estrogen receptor-mediated endocrine disrupting chemicals using QSAR- and structure-based virtual screening approaches. Toxicol Appl Pharmacol. 2013; 272:67-76. https://doi.org/10.1016/j.taap.2013.04.032.
17. Islam MA, Mukherjee A, Saha A. Molecular mapping of heterocyclic diazene derivatives for estrogen receptor modulation. Indian J Biochem Biophys. 2012; 49:236-45.
18. Dong X, Hilliard SG, Zheng W. Structure-based quantitative structure--activity relationship modeling of estrogen receptor beta-ligands. Future Med Chem. 2011; 3:933-45. https://doi.org/10.4155/fmc.11.49.
19. Luan F, Liu HT, Ma WP, Fan BT. Classification of estrogen receptor-beta ligands on the basis of their binding affinities using support vector machine and linear discriminant analysis. Eur J Med Chem. 2008; 43:43-52. https://doi.org/10.1016/j.ejmech.2007.03.002.
20. Salum LB, Polikarpov I, Andricopulo AD. Quantitative structure-activity relationships for a series of selective estrogen receptor-beta modulators. SAR QSAR Environ Res. 2007; 18:711-27. https://doi.org/10.1080/10629360701698811.
21. Zhu BT, Han GZ, Shim JY, Wen Y, Jiang XR. Quantitative structure-activity relationship of various endogenous estrogen metabolites for human estrogen receptor alpha and beta subtypes: Insights into the structural determinants favoring a differential subtype binding. Endocrinology. 2006; 147:4132-50. https://doi.org/10.1210/en.2006-0113.
22. Chen Y, Cheng F, Sun L, Li W, Liu G, Tang Y. Computational models to predict endocrine-disrupting chemical binding with androgen or oestrogen receptors. Ecotoxicol Environ Saf. 2014; 110:280-7. https://doi.org/10.1016/j.ecoenv.2014.08.026.
23. Tong W, Hong H, Fang H, Xie Q, Perkins R. Decision forest: combining the predictions of multiple independent decision tree models. J Chem Inf Comput Sci. 2003; 43:525-31. https://doi.org/10.1021/ci020058s.
24. Hong H, Tong W, Perkins R, Fang H, Xie Q, Shi L. Multiclass Decision Forest--a novel pattern recognition method for multiclass classification in microarray data analysis. DNA Cell Biol. 2004; 23:685-94. https://doi.org/10.1089/dna.2004.23.685.
25. Hong H, Tong W, Xie Q, Fang H, Perkins R. An in silico ensemble method for lead discovery: decision forest. SAR QSAR Environ Res. 2005; 16:339-47. https://doi.org/10.1080/10659360500203022.
26. Shen J, Xu L, Fang H, Richard AM, Bray JD, Judson RS, Zhou G, Colatsky TJ, Aungst JL, Teng C, Harris SC, Ge W, Dai SY, et al. EADB: an estrogenic activity database for assessing potential endocrine activity. Toxicol Sci. 2013; 135:277-91. https://doi.org/10.1093/toxsci/kft164.
27. Ding D, Xu L, Fang H, Hong H, Perkins R, Harris S, Bearden ED, Shi L, Tong W. The EDKB: an established knowledge base for endocrine disrupting chemicals. BMC Bioinformatics. 2010; 11:S5. https://doi.org/10.1186/1471-2105-11-s6-s5.
28. Filer D, Patisaul HB, Schug T, Reif D, Thayer K. Test driving ToxCast: endocrine profiling for 1858 chemicals included in phase II. Curr Opin Pharmacol. 2014; 19:145-52. https://doi.org/10.1016/j.coph.2014.09.021.
29. Kavlock R, Chandler K, Houck K, Hunter S, Judson R, Kleinstreuer N, Knudsen T, Martin M, Padilla S, Reif D, Richard A, Rotroff D, Sipes N, et al. Update on EPA’s ToxCast program: providing high throughput decision support tools for chemical risk management. Chem Res Toxicol. 2012; 25:1287-302. https://doi.org/10.1021/tx3000939.
30. Hong H, Xie Q, Ge W, Qian F, Fang H, Shi L, Su Z, Perkins R, Tong W. Mold(2), molecular descriptors from 2D structures for chemoinformatics and toxicoinformatics. J Chem Inf Model. 2008; 48:1337-44. https://doi.org/10.1021/ci800038f.
31. Xie Q, Ratnasinghe LD, Hong H, Perkins R, Tang ZZ, Hu N, Taylor PR, Tong W. Decision forest analysis of 61 single nucleotide polymorphisms in a case-control study of esophageal cancer; a novel method. BMC Bioinformatics. 2005; 6:S4. https://doi.org/10.1186/1471-2105-6-s2-s4.
32. Hong H, Branham WS, Dial SL, Moland CL, Fang H, Shen J, Perkins R, Sheehan D, Tong W. Rat alpha-Fetoprotein binding affinities of a large set of structurally diverse chemicals elucidated the relationships between structures and binding affinities. Chem Res Toxicol. 2012; 25:2553-66. https://doi.org/10.1021/tx3003406.
33. Fang H, Tong W, Branham WS, Moland CL, Dial SL, Hong H, Xie Q, Perkins R, Owens W, Sheehan DM. Study of 202 natural, synthetic, and environmental chemicals for binding to the androgen receptor. Chem Res Toxicol. 2003; 16:1338-58. https://doi.org/10.1021/tx030011g.
34. Shi L, Tong W, Fang H, Xie Q, Hong H, Perkins R, Wu J, Tu M, Blair RM, Branham WS, Waller C, Walker J, Sheehan DM. An integrated “4-phase” approach for setting endocrine disruption screening priorities--phase I and II predictions of estrogen receptor binding affinity. SAR QSAR Environ Res. 2002; 13:69-88. https://doi.org/10.1080/10629360290002235.
35. Tong W, Xie Q, Hong H, Shi L, Fang H, Perkins R. Assessment of prediction confidence and domain extrapolation of two structure-activity relationship models for predicting estrogen receptor binding activity. Environ Health Perspect. 2004; 112:1249-54.
36. Tong W, Xie Q, Hong H, Shi L, Fang H, Perkins R, Petricoin EF. Using decision forest to classify prostate cancer samples on the basis of SELDI-TOF MS data: assessing chance correlation and prediction confidence. Environ Health Perspect. 2004; 112:1622-7.
37. Rotroff DM, Dix DJ, Houck KA, Knudsen TB, Martin MT, McLaurin KW, Reif DM, Crofton KM, Singh AV, Xia M, Huang R, Judson RS. Using in vitro high throughput screening assays to identify potential endocrine-disrupting chemicals. Environ Health Perspect. 2013; 121:7-14. https://doi.org/10.1289/ehp.1205065.
38. Judson R, Houck K, Martin M, Knudsen T, Thomas RS, Sipes N, Shah I, Wambaugh J, Crofton K. In vitro and modelling approaches to risk assessment from the U.S. Environmental Protection Agency ToxCast programme. Basic Clin Pharmacol Toxicol. 2014; 115:69-76. https://doi.org/10.1111/bcpt.12239.
39. Rotroff DM, Martin MT, Dix DJ, Filer DL, Houck KA, Knudsen TB, Sipes NS, Reif DM, Xia M, Huang R, Judson RS. Predictive endocrine testing in the 21st century using in vitro assays of estrogen receptor signaling responses. Environ Sci Technol. 2014; 48:8706-16. https://doi.org/10.1021/es502676e.
40. Breiman L. Random Forests. Machine Learning 2001; 45:5–32. https://doi.org/10.1023/A:1010933404324.