
INTRODUCTION
Acute lymphoblastic leukemia (ALL), one of the most prevalent childhood malignancies, is caused by transformation of immature lymphoid cell-like precursor T or B lymphocytes [1]. While polymorphic variations in several genes, including IKZF1 (at 7p12. 2), ARIDB5 (at 10q21. 2), and CEBPE (at 14q11. 2), increase the risk of developing B cell childhood ALL [2], the underlying mechanism remains unclear. However, the availability of effective anti-cancer drugs and other anti-cancer treatments over the past few decades mean that the overall survival rate is nearly 80% [3]. In particular, glucocorticoids (GCs) (dexamethasone (Dex) and prednisolone) are of great value, particularly when used in combination with cytotoxic anti-cancer reagents such as vincristine, vinblastine, doxorubicin, daunorubicin, and etoposide [4]. GCs exert suppressive effects on lymphocytes by inhibiting cell proliferation via induction of cell cycle arrest at G1-phase rather than through cytotoxic mechanisms [5]. Notably however, the effects vary between individuals [6]. At the beginning of ALL treatment, patients are divided into two groups based on their response to GCs: good-responders and poor-responders [7]. Ninety percent of patients fall into the good responder group and have a high cure rate (>80%). Patients in the poor (or inadequate) responder group have an unfavorable outcome, with a probable event-free survival of <50% [7, 8]. Therefore, individual differences in terms of responses to GCs are important determinants of the efficacy of cancer chemotherapy in ALL patients.
To date, reduced reactivity to GCs (associated with genetic mutations or unique isoforms of GCs receptors) [9, 10] and blunted GC-mediated cytostatic effects (linked to an abnormal increase in the rate of glycolysis) [11] have been identified as mechanisms underlying resistance to GCs. However, some patients have an unsatisfactory clinical outcome even after combination chemotherapy with GCs and cytotoxic drugs, despite showing a clinically good response to GCs. Indeed, Kaspers et al. stated that no conclusions regarding prognostic impact could be drawn based on GC responses alone [12]. Furthermore, the authors suggested that, in addition to GC therapy, the response of children with ALL to anti-cancer agents (asparaginase and vincristine) is related significantly to long-term clinical outcome [13]. However, many therapeutic regimens and combinations of anti-cancer drugs are used to treat ALL; therefore, it is impractical to conduct response tests for each individual patient. However, a paradox exists: although GCs have cytostatic effects, most anti-cancer drugs used in combination therapy with GCs are cytotoxic (i.e., they inhibit proliferation or induce apoptosis of abnormally proliferating cancer cells) [14]. Thus, we wondered whether combining GCs with cytotoxic anti-cancer drugs might actually weaken the effects of the latter.
Previous studies show that GCs inhibit the glycolytic pathway in ALL cells by restricting glucose uptake via glucose transporters [15] and by suppressing expression of pyruvate kinase, a key glycolytic enzyme [16]. ALL cells, similar to cancer cells in general, show increased glucose uptake and glucose dependence, which requires a rich supply of ATP via the glycolytic pathway [17]. Thus, cancer-specific energy metabolism pathways might be a target for cancer chemotherapy; for example, 2-deoxyglucose (a hexokinase inhibitor) and 3-bromopyruvate (a dual inhibitor of hexokinase and glyceraldehyde 3-phosphate dehydrogenase) suppress proliferation of cancer cells in vitro by inhibiting the glycolytic pathway [18, 19]. However, we should point out that inhibitors of glycolytic enzymes do not show strong anti-cancer effects when used as a single agent in vivo [20]. By contrast, glycolytic inhibition by 2-deoxyglucose increases the efficacy of cytotoxic anti-cancer drugs (adriamycin and paclitaxel) in patients with osteosarcoma and non-small cell lung cancer [20]. This may explain why GCs enhance the therapeutic effects of cytotoxic drugs when used in combination chemotherapy regimens. Here, we speculate that disturbance of intracellular energy metabolism, including glycolysis, by GCs affects sensitivity to cytotoxic anti-cancer reagents.
Previously, we showed that autophagy is a key regulator of cellular energy; it does this by maintaining oxidative phosphorylation (OXPHOS) in the mitochondria, a process essential for ALL cell survival (especially when glycolysis is suppressed) [21]. Autophagy is a self-degradation system in which cytoplasmic components (damaged proteins and organelles) are degraded and recycled by lysosomes. During this process, the isolation membrane (phagophore) sequesters part of the cytoplasm, including abnormal mitochondria and unfolded proteins, to form autophagosomes, which then fuse with lysosomes [22]. In general, cancer cells depend more heavily on autophagy (which is activated by stress) than normal cells to survive [23]. This is because cancer cells experience more acute nutrient and oxygen deprivation due to the higher metabolic demands caused by excessive proliferation [24]. In particular, the oncogenic gene Ras upregulates basal autophagy in several cancers, including pancreatic adenocarcinoma and lung carcinoma, thereby contributing to mitochondrial quality control and maintenance of energy homeostasis when nutrients are lacking [25]. This is in agreement with our previous finding that cancer cells that become under-nourished due to suppression of glycolysis rely on autophagy for energy production.
Here, we examined how the sensitivity of ALL cells to cytotoxic anti-cancer drugs fluctuates when the intracellular energy metabolism is altered by exposure to GCs. In particular, we suggest that GC-mediated suppression of glycolysis activates autophagy to increase mitochondrial function, potentially increasing the cytotoxicity of anti-cancer drugs that bind to the mitochondria. These findings suggest that before we can accurately predict the sensitivity of ALL to anti-cancer drugs, it is necessary to better understand the intracellular pathways that regulate energy metabolism.
RESULTS
Combining Dex with anti-cancer drugs enhances anti-cancer effects against some ALL cells
To evaluate the effect of GCs against ALL cells in combination with anti-cancer reagents, we obtained human ALL CCRF-CEM clones and classified them in terms of (i) cytostatic (but not cytotoxic) effects of Dex (a representative GC), and (ii) the combined effects of Dex and a cytotoxic anti-cancer drug (etoposide). We took this approach because CCRF-CEM cells comprise both GC-sensitive or GC-resistant phenotypes [26]. The combined effect of Dex plus etoposide was evaluated by measuring cell death after pre-treatment with Dex. Clones (>20) derived from parental CCRF-CEM cells were classified into three types: 1) shows reduced growth in the presence of Dex and increased etoposide-mediated cytotoxicity in the presence of Dex and etoposide (named CEM-ADD [ADD denotes an “additive” effect of etoposide]); 2) shows notably reduced growth in the presence of Dex, but no increase in cytotoxicity in the presence of etoposide combination (named CEM-NON [“non-additive” effect of etoposide]); and 3) shows no response to Dex, used either alone or in the presence of etoposide (named CEM-R [“resistant” to Dex]) (Figure 1A and 1B). For the parental cells (which comprised various clones), we observed slight Dex-mediated growth suppression, but no increase in cytotoxicity when combined with etoposide (Figure 1A and 1B), suggesting that the number of cells with CEM-ADD-like characteristics determines the overall susceptibility of the parental population to anti-cancer drugs in the presence of GCs.
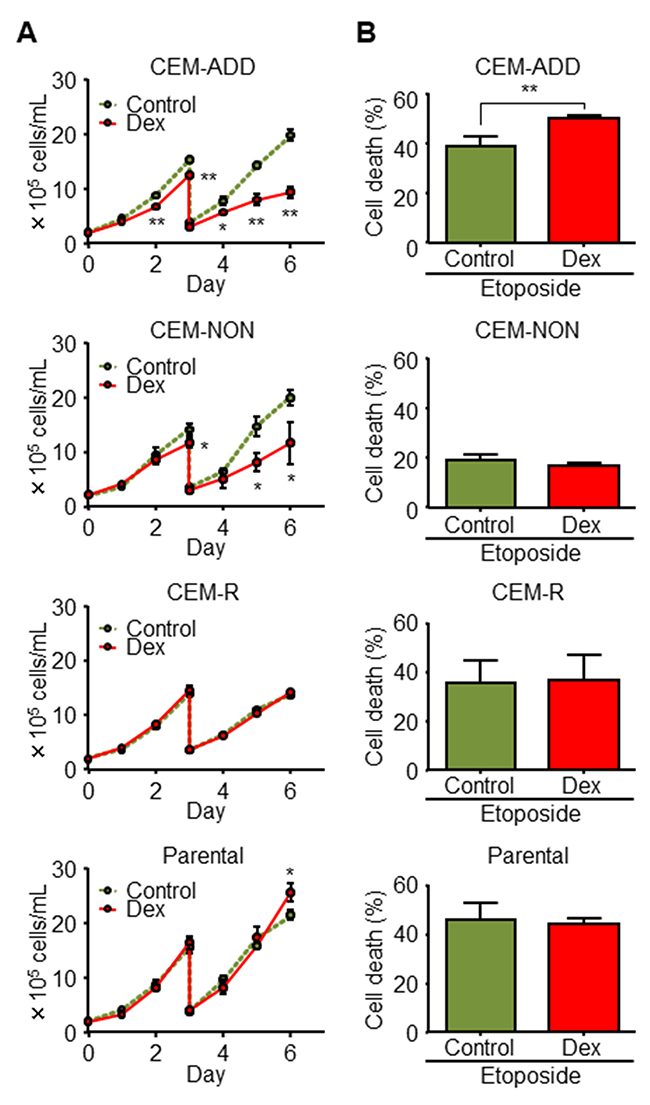
Figure 1: Combined treatment with dexamethasone (Dex) and anti-cancer drugs enhances anti-cancer effects against some acute lymphoblastic leukemia cells. (A) Isolated CCRF-CEM clones and parental cell lines were cultured in the presence or absence of Dex (1 μM). Cell proliferation was determined by counting the number of cells in each well. Cells were diluted four-fold on Day 3. *P < 0.05 and **P < 0.01, compared with cells cultured in the absence of Dex. (B) Each CCRF-CEM clone and the parental cell line was pre-cultured in the presence or absence of Dex for 48 h was treated with etoposide (10 μM) for 72 h. Cell viability was evaluated by flow cytometry. **P < 0.01.
Glycolytic inhibition by Dex in CEM-ADD cells increases etoposide-induced cell death
Next, to explore the reason(s) why GCs increase sensitivity to anti-cancer drugs, we focused on changes in intracellular energy metabolism in the presence of Dex. As mentioned above, GCs suppress the glycolytic pathway [15]; therefore, we speculated that glycolytic suppression by Dex affects sensitivity to etoposide. We confirmed that treatment of CEM-ADD and CEM-NON cells with Dex reduced production of lactate, which is derived from pyruvate during the final step of anaerobic glycolysis (Figure 2A). In addition, and as shown previously [15], mRNA expression of glycolytic enzymes hexokinase 2 (HK2) and lactate dehydrogenase A (LDHA) was reduced, and mRNA expression of an important regulator of glycolytic flux, 6-phosphofructo-2-kinase/fructose-2,6-bisphosphatase 2 (PFKFB2), increased significantly (Figure 2B). Furthermore, protein expression of HK2 and PFKFB2 was also decreased and increased, respectively, but was no clear change in the protein expression of LDHA (Figure 2C).
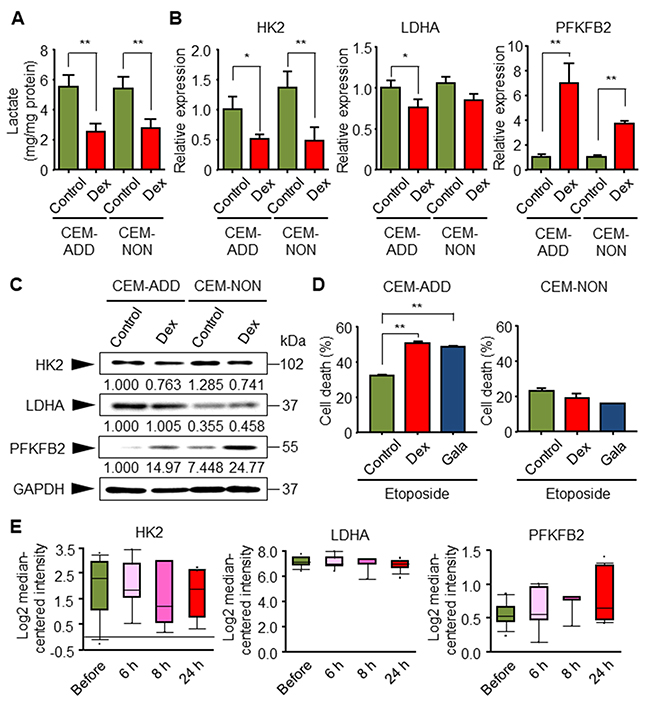
Figure 2: Glycolytic inhibition by dexamethasone (Dex) in CEM-ADD cells leads to increased etoposide-mediated cell death. (A) CEM-ADD and CEM-NON cells were cultured for 5 days in the presence or absence of Dex (1 μM) and the accumulation of released lactate in the culture medium over the last 3 days was evaluated. **P < 0.01. (B) CEM-ADD and CEM-NON cells were cultured in the presence or absence of Dex for 48 h and then subjected to quantitative RT-PCR to measure mRNA encoding hexokinase 2 (HK2), lactate dehydrogenase A (LDHA), and 6-phosphofructo-2-kinase/fructose-2,6-bisphosphatase 2 (PFKFB2). *P < 0.05 and **P < 0.01. (C) CEM-ADD and CEM-NON cells were cultured in the presence or absence of Dex for 48 h and then subjected to western blotting with anti-HK2, anti-LDHA, anti-PFKFB2 and anti-GAPDH antibodies. The ratio of the signal intensity of each glycolytic enzyme to that of GAPDH is indicated below each lane. (D) CEM-ADD and CEM-NON cells pre-cultured in the presence or absence of Dex, or in galactose (Gala)-based medium, for 48 h were then treated with or without etoposide (10 μM) for 72 h. Cell viability was evaluated by flow cytometry. **P < 0.01. (E) Expression of mRNA encoding glycolytic enzymes HK2, LDHA, and PFKFB2, in childhood ALL patients before and at 6 to 24 h after treatment was examined using the Oncomine database (based on the study by Schmidt et al. (2006)).
We previously showed that changing the sugar source in the ALL cell culture medium from glucose to galactose inhibits ATP production via glycolysis [21]. Culturing cells with galactose suppressed growth, but did not induce cell death (data not shown). To investigate whether suppressing glycolysis affects sensitivity to etoposide, we pre-cultured CEM-ADD and CEM-NON cells in galactose-based medium and exposed them to etoposide. We found that the etoposide-sensitivity of CEM-ADD cells pre-cultured in galactose-based medium was similar to that of cells pre-cultured with Dex; however, CEM-NON cells were not affected appreciably (Figure 2D) (see more details in Discussion). These results indicate that GC-mediated enhancement of etoposide-induced cytotoxicity is due to inhibition of glycolysis by GCs.
We next used an extensive expression microarray database derived from cancer patients (Oncomine) [27] to check whether ALL patients treated with GCs show differential expression of glycolysis-related enzymes. Database analysis based on childhood ALL patients indicated that GCs treatment (for 6 to 24 h) tended to reduce the expression of genes encoding HK2 and LDHA, and increase expression of the gene encoding PFKFB2 (Figure 2E); however, these increases/decreases were not significant [28]. These results are consistent with our in vitro data.
Dex induces a metabolic shift from glycolysis to autophagy and mitochondrial OXPHOS
We previously reported that under conditions that suppress glycolysis, ALL cells activate autophagy to overcome the energy shortfall [21]. Therefore, we assumed that GCs would increase autophagy in ALL cells, thereby increasing sensitivity to anti-cancer drugs. First, we asked whether exposure to Dex increases autophagy in CCRF-CEM cells. Thus, we cultured cells with Dex in the presence/absence chloroquine (CQ; 20 μM), followed by immunoblotting to evaluate changes in a specific marker of autophagy: conversion of LC3-I to LC3-II. CQ inhibits the late steps of autophagic process (fusion of autophagosomes and lysosomes). The results indicated that Dex increased autophagic flux in CEM-ADD cells; however, only a slight increase in autophagy was observed in CEM-NON cells (Figure 3A). Autophagic flux in CEM-ADD cells was also assessed by measuring the decrease in the level of p62 protein, which directly interacts with LC3 and facilitates autophagosome formation, after which it is degraded via autophagy [29]. Figure 3A shows that the decrease in the level of p62 was inhibited by autophagic inhibition with CQ (Figure 3A). In addition, formation of autophagic vesicles and other characteristic structures (i.e., mitophagy), which is indicative of autophagic turnover of mitochondria, were observed under a transmission electron microscope (Figure 3B). Since our previous report argues that ALL cells activate autophagy to overcome the energy shortage caused by inhibited glycolysis [21], we next confirmed whether increased autophagic ability upon Dex treatment increases cell viability. We found that both ATP content (Figure 3C) and viability (Figure 3D) of CEM-ADD and CEM-NON cells pre-cultured with Dex were significantly reduced in the presence of CQ (50 μM); however, the effects of CQ was weaker in CEM-NON cells. These data suggest that exposure to GCs increases autophagy, which in turn supports survival of ALL cells in which glycolysis is suppressed.
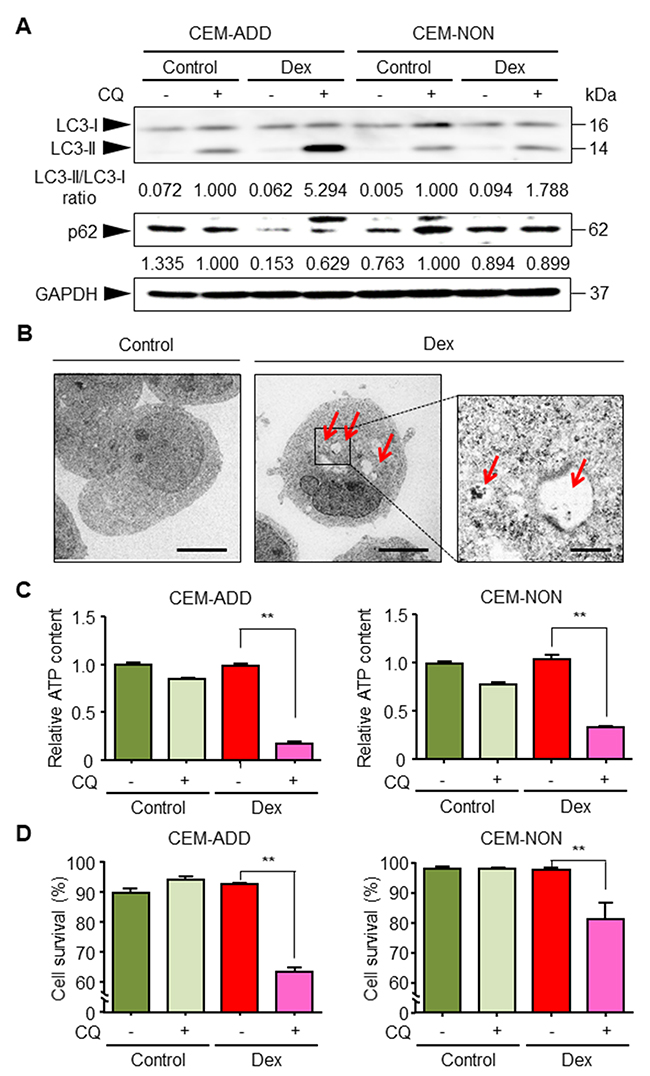
Figure 3: Dexamethasone (Dex) exposure activates autophagy and increases survival of acute lymphoblastic leukemia cells. (A) Lysates of cells treated with or without Dex (1 μM) or chloroquine (CQ; 20 μM) for 72 h were subjected to western blotting with anti-LC3, anti-p62 and anti-GAPDH antibodies. The ratio of the signal intensity of LC3-II/LC3-I and p62/GAPDH is indicated below each lane. (B) After 72 h exposure to Dex, ultrastructural changes in CEM-ADD cells were examined by transmission electron microscopy. Scale bars: 4 μm in the larger panels and 1 μm in the smaller panel. Red arrowheads indicate autophagic bodies. (C) CEM-ADD and CEM-NON cells pre-treated with or without Dex for 48 h were then treated with or without CQ (50 μM) for 72 h. The ATP content in the cells was then evaluated. **P < 0.01. (D) Viability of the cells in (C) was evaluated using flow cytometry. **P < 0.01.
Mitochondrial OXPHOS is an important metabolic pathway for generating large amounts of ATP. We reported previously that ALL cells in which glycolysis is suppressed compensate by deriving energy from mitochondrial OXPHOS [21]. Therefore, we speculated that ALL cells exposed to GCs activate OXPHOS to acquire survival energy. We found that the mitochondrial membrane potential indicated by the high uptake of MitoTracker Orange by mitochondria (Figure 4A). Furthermore, we confirmed that mitochondrial OXPHOS was essential for survival of Dex-treated CEM-ADD cells because the exposure to a specific inhibitor of ATP synthase in mitochondria, oligomycin, led to a significant reduction in cell viability (Figure 4B). In addition, we found that exposure of CEM-ADD cells to Dex did not alter the number of mitochondria (as measured by mitochondrial DNA content, ATPase 8, and cytochrome c oxidase subunit II) (Figure 4C). Taken together, these data suggest that Dex increases mitochondrial turnover to provide the fresh mitochondria required to produce ATP under conditions of reduced glycolysis.
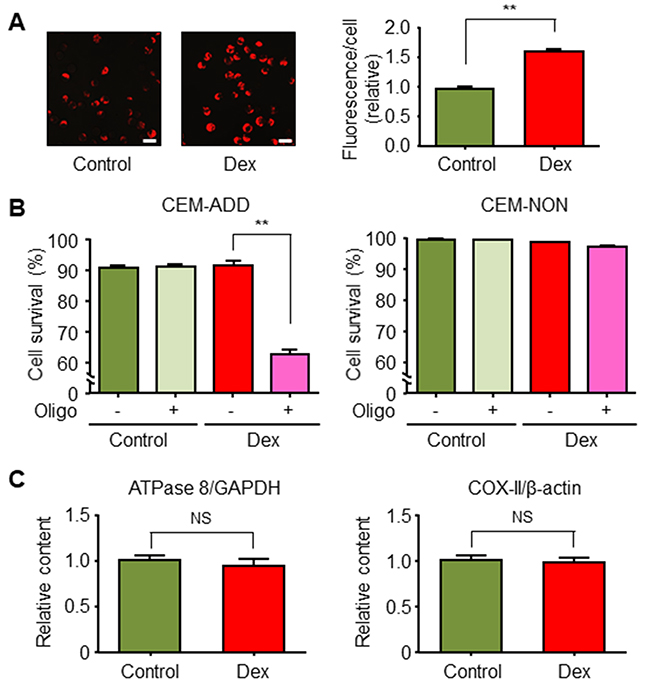
Figure 4: Dexamethasone (Dex) increases mitochondrial function in acute lymphoblastic leukemia cells. (A) CEM-ADD cells cultured for 72 h in the presence or absence of Dex (1 μM) were stained with MitoTracker Orange and observed under a confocal microscope. Scale bar, 20 μm. Fluorescence intensity per cell was calculated. **P < 0.01. (B) CEM-ADD and CEM-NON cells pre-treated with or without Dex for 48 h were then treated with or without oligomycin (Oligo; 25 ng/mL) for 72 h and viability evaluated by flow cytometry. **P < 0.01. (C) Mitochondrial DNA, ATPase 8, and cytochrome c oxidase subunit II (COX-II) levels in CEM-ADD cells cultured with or without Dex for 72 h. NS, not significant.
Dex-induced mitochondrial activation via autophagy in the presence of anti-cancer drugs increases production of reactive oxygen species (ROS)
Mitochondrial OXPHOS generates ROS as a natural byproduct, thereby causing oxidative damage to mitochondrial lipids, cellular DNA, and functional proteins [30]. One system designed to maintain the quality and quantity of mitochondria is mitophagy, which selectively degrades damaged mitochondria [31, 32]. A previous study suggests that autophagy-competent Ras-expressing cancer cells effectively regulate mitochondrial respiration to produce ATP [25]. Therefore, we examined the hypothesis that an increase in mitochondrial function upon Dex exposure is due to increased autophagy. Exposure of CEM-ADD cells (which have the potential to drive autophagy and mitochondrial OXPHOS) to Dex accelerated oxygen consumption from the culture medium; this is an indicator of mitochondrial respiration efficiency (Figure 5A). Inhibition of autophagy by CQ (20 μM) abrogated this effect (Figure 5A). However, exposure of CEM-NON cells to Dex or CQ did not affect the oxygen consumption rate (Figure 5B). These results indicate that Dex-induced autophagy positively regulates mitochondrial function in CEM-ADD cells.
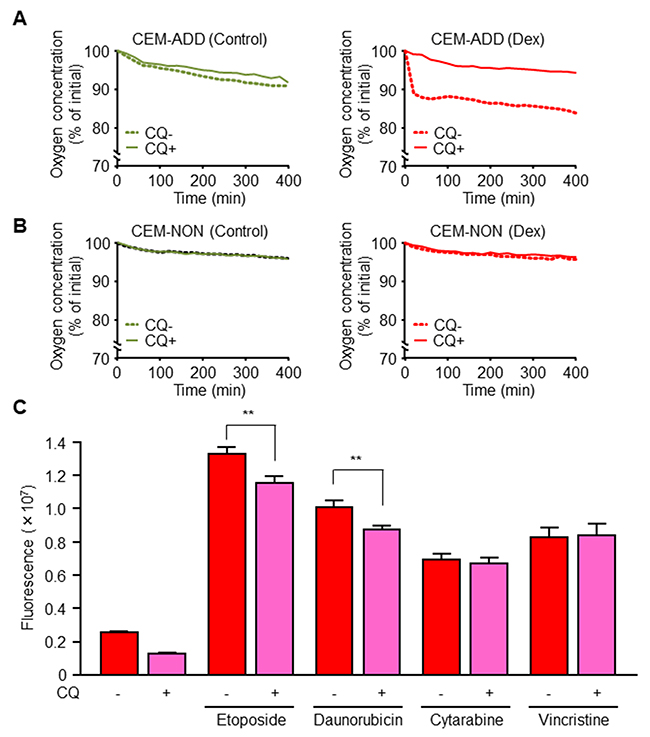
Figure 5: Dexamethasone (Dex)-induced mitochondrial activation via increased autophagy increases anti-cancer drug-mediated reactive oxygen species (ROS) production. (A, B) Oxygen concentration in the medium of cultured CEM-ADD (A) and CEM-NON cells (B) pre-treated with or without Dex (1 μM) for 72 h was measured over time during additional culture with or without chloroquine (CQ; 20 μM). Data are expressed as the mean of duplicate samples. (C) CEM-ADD cells pre-treated with Dex for 48 h were then treated for 24 h with etoposide (10 μM), daunorubicin (100 nM), cytarabine (1 μM), or vincristine (5 nM) in the presence/absence of CQ (20 μM). Intracellular ROS levels were measured by staining with an oxidation-sensitive fluorescent probe dye, 2´,7´-dichlorodihydrofluorescein diacetate. ** P < 0.01.
Etoposide and daunorubicin bind to mitochondrial complex-I, one of the respiratory chain complexes [33]. Since complex-I is involved in DNA-damage-induced apoptosis via complex-I-dependent ROS production, we hypothesized that these anti-cancer drugs increase ROS production by mitochondria when mitochondrial biogenesis is enhanced by GCs. In CEM-ADD cells pre-treated with Dex and CQ (20 μM; a low-concentration that did not affect cell viability) reduced ROS production upon exposure to etoposide or daunorubicin (Figure 5C). However, cytarabine and vincristine did not cause a marked change in ROS production in the presence/absence of CQ (Figure 5C). These results indicate that GC-mediated activation of autophagy subsequently increases during mitochondrial biogenesis of ROS through binding of mitochondrial complex-I by anti-cancer drugs.
Exposure to GCs increases the cytotoxic effects of several anti-cancer drugs against ALL cells
In addition to etoposide, we examined the cytotoxic effects of other anti-cancer drugs when combined with Dex. Exposure of CEM-ADD cells to daunorubicin and Dex led to increased ROS production and cell death (Figure 6A). By contrast, cytotoxicity induced by cytarabine or vincristine was almost unchanged in the presence/absence of Dex (Figure 6A). Exposure of CEM-NON cells to vincristine increased cell death in the presence of Dex (the reason for this is unknown), while the cytotoxicity of other anti-cancer drugs did not change significantly in the presence of Dex (Figure 6A). All experiments carried out thus far involved exposing CCRF-CEM cells to Dex for 2 days; therefore, we asked whether pre-treatment with Dex for longer times would increase sensitivity to anti-cancer drugs. As shown in Figure 6B, etoposide and daunorubicin showed greater efficacy when combined with 2, 7, and 14 day pretreatments with Dex, whereas cytarabine-induced cytotoxicity increased when combined with 7 and 14 day treatments with Dex. We then examined whether increased susceptibility to anti-cancer drugs plus Dex was due to a shift in energy metabolism following suppression of glycolysis by Dex. Consistent with the result described in Figure 6B, etoposide was more effective against CCRF-CEM cells that had been cultured for a long time (2, 7 and 14 days) in galactose-based medium than when they were cultured in glucose-based medium (Figure 6C). This suggests that a shift in energy metabolism from glycolysis to mitochondrial OXPHOS via autophagy activity increases the anti-cancer effects of several cytotoxic drugs.
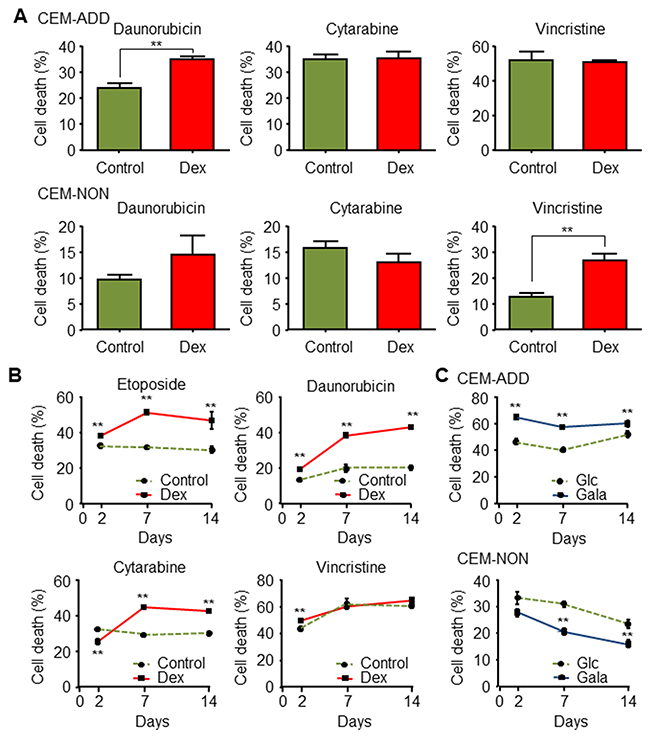
Figure 6: Exposure to glucocorticoids increases the cytotoxic effects of several anti-cancer drugs in acute lymphoblastic leukemia cells. (A) CEM-ADD and CEM-NON cells pre-cultured in the absence or presence of dexamethasone (Dex; 1 μM) for 48 h were then treated for 72 h with daunorubicin (100 nM), cytarabine (1 μM), or vincristine (5 nM). Cell viability was then measured by flow cytometry. ** P < 0.01. (B) CEM-ADD cells pre-cultured in the absence or presence of Dex for 2 days, 1 week, or 2 weeks were then treated with etoposide (10 μM), daunorubicin (100 nM), cytarabine (1μM), or vincristine (5 nM) for 72 h. Cell viability was then evaluated using flow cytometry ** P < 0.01, compared with control cells. (C) CEM-ADD and CEM-NON cells pre-cultured in medium containing glucose (Glc) or galactose (Gala) for 2, 7 and 14 days were then treated with etoposide (10 μM) for 72 h. Cell death was then evaluated by flow cytometry ** P < 0.01, compared to cells cultured in Glc-based medium.
Occasionally, the initiation of cytotoxic therapy in patients with hematologic malignancies, including ALL, increases cancer cell sensitivity [34]. This hypersensitivity induces tumor lysis syndrome (TLS), which is characterized by a group of metabolic derangements caused by massive and abrupt release of cellular components into the blood. In particular, crystallization of uric acid, a metabolite of nucleic acids released from cells, and calcium phosphate may result in impaired renal function, leading to acute renal failure and death in severe cases [34]. Because ALL cells showed increased susceptibility to combination treatment with GCs and anti-cancer drugs, we hypothesized that GCs may play a role in onset of TLS. Analysis of the association between GCs and TLS onset was performed by examining adverse events logged in the Japanese Adverse Drug Event Report database held by the Pharmaceutical and Medical Devices Agency (events were reported from 1 April, 2004, to 31 August, 2014; 309,015 cases). We examined effects related to Dex, prednisolone, hydrocortisone and fluticasone. The reported number of adverse drug reactions for ALL patients was 711 and 398 for GCs and non-GCs, respectively. Of these, the number of TLS cases was 15 and 1, respectively. We calculated the reporting odds ratio (ROR), a measure of the relative risk for drug-associated adverse events [35], and found a 95% confidential interval (CI) (two-sided) of 8.556 and 1.125–65.02, respectively. The lower limit of the ROR (95% CI) was >1, suggesting that administration of GCs may be associated with TLS onset caused by excessive sensitivity to anti-cancer drugs.
DISCUSSION
Our previous study showed that autophagy drives mitochondrial OXPHOS under glycolysis-suppressed conditions [21]. Here, we showed that GC-mediated suppression of glycolysis in ALL cells switches energy metabolism from glycolysis to autophagy and mitochondrial OXPHOS. Cancer cells mainly obtain energy (ATP) for survival via glycolysis rather than via mitochondrial OXPHOS, even in the presence of available oxygen (a process known as the “Warburg effect”) [36]. In addition, recent studies reveal that reprogrammed mitochondrial uncoupling in leukemia cells promotes the Warburg effect [37]. However, suppressing glycolysis alone does not eradicate tumors in vivo [20]; this is supported by our previous in vitro study of leukemia cells [21]. Therefore, cancer cells must have an alternative pathway for obtaining survival energy under conditions of suppressed glycolysis. Thus, we focused on mitochondrial OXPHOS as the alternative pathway and speculated that activity is maintained via mitophagy. Mitophagy, selective degradation of mitochondria via the autophagic pathway, contributes to mitochondrial quality control by removing dysfunctional mitochondria [38]. Also, mitochondrial turnover via mitophagy plays an important role in maintaining the activity of respiratory supercomplexes [39]. Here, we showed that exposing CEM-ADD cells to Dex increased the mitochondrial membrane potential without increasing the number of intracellular mitochondria. Previously, Samuels et al. have reported that ALL cells directly damaged by GCs are highly dependent on glycolysis for survival and proliferation [40]. In ALL cells, exposure to GCs suppresses glycolysis (but does not induce cell death) and increases mitochondrial bioenergetics. This is supported by the observation that combined treatment with oligomycin and GCs is effective in reducing viability [40]. From their analyses, we can speculate that ALL cells, which are highly dependent on glycolysis, have the potential to shift between glucose bioenergetic pathways (i.e., between glycolysis and mitochondrial OXPHOS). We also found that the metabolic shift is mediated by autophagy. Taken together, these results suggest that Dex-induced mitophagy alters the metabolic system in ALL cells, thereby improving the quality of mitochondria that can then support energy acquisition in ALL cells exposed to glycolytic suppression.
During ALL therapy, GCs are often used in combination with cytotoxic anti-cancer drugs [4]. Here, we showed that a combination of Dex plus anti-cancer drugs that bind mitochondria increases the efficacy of anti-cancer drugs; this increase is due to increased production of ROS. The results show that exposure to etoposide and daunorubicin increased ROS production by inhibiting mitochondrial complex-I, particularly when mitochondrial biogenesis is enhanced by mitophagy. This scenario is supported by the following reports showing that hyperpolarizing mitochondrial membrane potential stimulates ROS production [41], and that mitochondrial impairment of OXPHOS complexes generates large amounts of ROS [42]. However, autophagic inhibition (probably mitophagic inhibition) by CQ in the presence of etoposide or daunorubicin led to a small but significant reduction of ROS levels in Dex-treated CCRF-CEM cells. We must further consider the following points: 1) other pathways, such as those induced by anti-cancer drugs themselves [43], and poly ADP-ribose polymerase and NAD(P)H oxidase also generate intracellular ROS after anti-cancer drug-induced DNA-damage [44]); and 2) autophagy, driven by various intracellular stresses (including ROS), plays a role in eliminating these stresses [45]. Thus, inhibition of autophagy may also increase intracellular ROS levels by preventing elimination of ROS generated by anti-cancer drugs. Therefore, to predict sensitivity of ALL to anti-cancer drugs plus GCs, we need to consider both the increase in ROS production due to inhibition of mitochondrial function by anti-cancer drugs or by the anti-cancer drugs themselves, and removal of intracellular stresses by autophagy.
To examine susceptibility ALL cells to GCs, many researchers used cloned cells [26, 46]. We also cloned CCRF-CEM cells to examine individual differences in reactivity to GCs and anti-cancer drugs. Among the cell populations that entered cytostasis upon exposure to Dex, we observed that some did and some did not show increased sensitivity to anti-cancer drugs in the presence of (CEM-ADD and CEM-NON cells, respectively). Therefore, we examined differences in energy metabolism under conditions of Dex-mediated glycolytic suppression. CEM-ADD cells were highly dependent on alternative energy acquisition pathways (autophagy and mitochondrial OXPHOS); however, CEM-NON cells had low energy demands under the same conditions. A study based on tumor-derived cell lines from the National Cancer Institute showed that metabolic activity of cancer cells is coupled to their cell size and rate of protein synthesis [47]. The cells survive by keeping the requirement for ATP low under stress conditions, such as starvation. We also speculate that CEM-NON cells require less ATP under glycolysis-suppressed conditions induced by Dex exposure; thus, Dex did not affect mitochondrial function in CEM-NON cells or their sensitivity to anti-cancer drugs. In addition, many human tumors such as breast and prostate cancers show defective autophagy; one of the main reasons for this is the lack of essential autophagic genes [48, 49]. Besides loss of function of autophagy in cancer cells, increased survival and proliferative signals, such as PI-3 kinase and mTOR, render them less able to induce autophagy [50]. We could not identify the precise mechanism underlying the finding that CEM-NON cells do not rely on autophagy to a great extent, but we believe potential differences in autophagic and mitochondrial function alter cellular sensitivity to anti-cancer drugs in the presence of GC.
In the clinic, a standard protocol is to test the response of ALL cells to GCs and then determine the treatment regimen [7]. However, this method does not provide sufficient information about how GC administration affects ALL sensitivity to anti-cancer drugs. Therefore, it is difficult to predict accurately the effect of combination therapy. Here, we suggest that there is a cause-and-effect relationship between onset of TLS, a serious side effect associated with excessive susceptibility to anti-cancer drugs, and the use of GCs. Since severe TLS can lead to acute renal failure and death, it is very important that we develop a method that can predict sensitivity to anti-cancer drugs when used in combination with GCs. The results presented herein suggest that differences in susceptibility of ALL cells to combined treatment with anti-cancer drugs and GCs is due to differences in mitochondrial activity and autophagic function. We suggest that individual differences in mitochondrial function, and in the ability of cells to induce autophagy, in the presence of GCs determines susceptibility to anti-cancer drugs. Thus, anti-cancer drugs should be selected after considering alterations in intracellular energy metabolism caused by GCs; this will improve the safety and efficacy of ALL treatment. An overview of the findings of our study is shown in Figure 7.
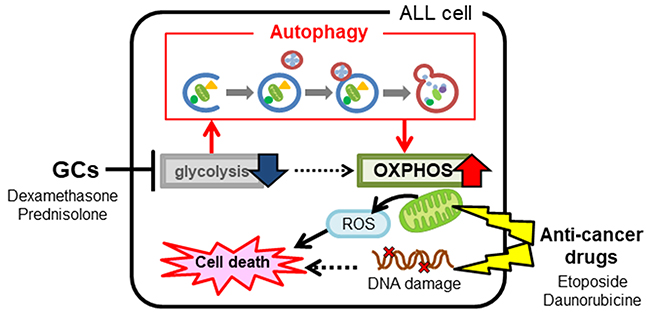
Figure 7: An overview of the study findings. Administration of glucocorticoids to acute lymphoblastic leukemia cells alters intracellular energy metabolism by suppressing glycolysis and activating mitochondrial function via autophagy. Altered metabolism affects the efficacy of concomitant anti-cancer drugs, particularly those capable of inhibiting mitochondrial function.
MATELIALS AND METHODS
Reagents
CQ (Sigma, St. Louis, MO, USA) was dissolved in Milli Q water. Oligomycin (Sigma), Dex (Wako, Tokyo, Japan), etoposide (Tokyo Kasei, Tokyo, Japan), daunorubicin (Cayman Chemical, MI, USA), cytarabine (LKT Laboratories, St. Paul, MN, USA) and vincristine (LKT Laboratories) were dissolved in dimethyl sulfoxide (DMSO). The final DMSO concentration in every cell culture did not exceed 0.5% (v/v).
Cell culture and isolation of clones
CCRF-CEM cells, purchased from RIKEN Cell Bank (Tsukuba, Japan), were maintained in RPMI-1640 (Nacalai Tesque, Kyoto, Japan) supplemented with 10% fetal bovine serum (FBS, Life Technologies, Grand Island, NY, USA) plus antibiotics (Nacalai Tesque) at 37°C in a humidified atmosphere of 5% CO2 in air. For each experiment, cells were cultured in medium containing glucose (2 g/L) or galactose (2 g/L). To isolate clones, 100 μL of cell suspension was added to each well of a 96-well plate (1 cell per well). After several days, growing cells derived from a single cell were transferred to 12-well plate and/or a larger dish-plate for expansion culture.
Detection of dead cells by flow cytometry
To distinguish dead cells from live cells, CCRF-CEM cells were stained with the Zombie NIR™ Fixable Viability kit (BioLegend, San Diego, CA, USA), according to the manufacturer’s instructions, and examined in a cell analyzer (EC800; SONY, Tokyo, Japan).
Measurement of cellular lactate release
Release of cellular lactate was measured as described previously [21]. Briefly, the supernatant from cultured cells was de-proteinized with perchloric acid and neutralized with potassium hydroxide. The supernatant was then mixed with nicotinamide adenine dinucleotide and glutamate pyruvate transaminase (Roche, Mannheim, Germany). The enzymatic reaction was started by adding lactate dehydrogenase (Wako) to each sample at 37°C for 30 min. Absorbance was the measured at a wavelength of 340 nm.
RNA isolation and quantitative real-time PCR
Total RNA was isolated from CCRF-CEM cells using Sepasol-RNA I reagent (Nacalai Tesque) and reverse transcribed using ReverTra Ace® qPCR RT Master mix (TOYOBO, Osaka, Japan). The resulting cDNA was mixed with THUNDERBIRD™ quantitative real-time PCR mix (TOYOBO) and subjected to quantitative real-time PCR using a LightCycler™ Nano Real-Time PCR System (Roche) and the following primers: HK2 forward, 5´-ACA GGT GCT CTC AAG CCC TAA G-3´ and reverse, 5´-CGA GGC CGC CAT CTC AGA GCG G-3´; LDHA forward, 5´-GGA GAT CCA TCA TCT CTC C-3´ and reverse, 5´-GGC CTG TGC CAT CAG TAT CT-3´; PFKFB2 forward, 5´-GAT TGG AGT ACC CAC CAA AGT G-3´ and reverse, 5´-TTC ACG TCG ATA TAC CCC AAG A-3´; and β-actin forward, 5´-TTC AAC ACC CCA GCC ATG TAC G-3´ and reverse, 5´-GTG GTG GTG AAG CTG TAG CC-3´. The cycling conditions were as follows: 95°C for 60 s, followed by 40 cycles at 95°C for 10 s and 60°C for 60 s. Relative expression of mRNA was calculated after normalization against β-actin.
Autophagic flux assay and western blot analysis
Autophagic flux was evaluated by monitoring turnover of the autophagic marker LC3-II by western blot analysis in the presence and absence of CQ [12]. Autophagic flux was measured as the difference in LC3-II protein expression between CQ-treated samples and CQ-untreated samples in the respective group. For western blot analysis, cells were harvested and lysed on ice in cell lysis buffer containing phosphate-buffered saline (pH 7.4), 1% Triton X-100, and a protease inhibitor cocktail (Roche). Next, 5 μg of protein from each sample was loaded and run on SDS-PAGE gels and transferred to polyvinylidene difluoride membranes (Merck Millipore, Berlin, Germany). After blocking with 5% bovine serum albumin, the membranes were probed with specific primary antibodies (Cell Signaling Technologies, Beverly, MA, USA), according to the manufacturer’s instructions. Immunolabeled proteins were detected using a horseradish peroxidase-labeled donkey anti-rabbit IgG secondary antibody (Santa Cruz Biotechnology, Santa Cruz, CA, USA) and the ECL prime detection reagent (GE Healthcare, Buckinghamshire, UK).
Transmission electron microscopy
Cells were prepared for transmission electron microscopy and observed as previously described [51–53]. Briefly, CEM-ADD cells were fixed by addition of 2.5% (final) glutaraldehyde to the culture medium for 24 h on ice. Glutaraldehyde-fixed samples were then sandwiched between two copper discs, snap-frozen with melting propane, cooled in liquid nitrogen, and freeze-substituted in acetone containing 2% osmium tetroxide at -80°C for 2 days. Finally, samples were embedded in an epoxy resin. Ultrathin sections (70 nm thick) were cut, stained with uranyl acetate and lead citrate, and observed under a JEM-1400 electron microscope (JEOL, Tokyo, Japan) at nominal magnifications of 2,500–10,000.
Measurement of the cellular ATP content
The CellTiter-Glo Luminescent Cell Viability Assay (Promega, Madison, WI, USA) was used to measure cellular ATP content in suspensions of CCRF-CEM cells, according to the manufacturer’s instructions.
Evaluation of mitochondrial membrane potential
To evaluate mitochondrial membrane potential, CCRF-CEM cells were incubated for 45 min with 200 nM MitoTracker Orange (Life Technologies) dissolved in FBS-free RPMI-1640. After loading, cells were washed in PBS and images obtained using a Carl Zeiss LSM700 laser scanning confocal microscope (Prenzlauer, Berlin, Germany). Fluorescence intensity and cell number were quantified using Image J (NIH, Bethesda, MD).
Analysis of mitochondrial DNA content
Mitochondrial DNA content was quantified as described previously [54]. Briefly, total cellular DNA (both mitochondrial and nuclear DNA) was isolated using the NucleoSpin® Tissue kit (Macherey Nagel, Düren, Germany). Total DNA was subjected to quantitative real-time PCR using the following primers: mitochondrial ATPase 8 forward, 5´-AAT ATT AAA CAC AAA CTA CCA CCT ACC-3´ and reverse, 5´-TGG TTC TCA GGG TTT GTT ATA-3´; mitochondrial cytochrome c oxidase subunit II forward, 5´-CCC CAC ATT AGG CTT AAA AAC AGA T-3´ and reverse, 5´-TAT ACC CCC GGT CGT GTA GCG GT-3´; nuclear GAPDH forward, 5´-AAG GTC ATC CCT GAG CTG AA-3´ and reverse, 5´-TTC TAG ACG GCA GGT CAG GT-3´; and nuclear β-actin forward and reverse. Relative amounts of mitochondrial DNA in cells were calculated after normalizing against either nuclear GAPDH or β-actin DNA.
Measurement of cellular oxygen consumption rate
The oxygen consumption of CCRF-CEM cells was measured using a fluorescent oxygen probe (PreSens Sensor Dish Reader; Regensburg, Germany). Oxygen tension was monitored continuously every minute and the concentration at time 0 was set to 100%.
Measurement of intracellular ROS
Intracellular ROS was measured in CEM-ADD cells using an oxidation-sensitive fluorescent probe dye: 2´,7´-dichlorodihydrofluorescein diacetate (DCF-DA, Life Technologies) [55]. Briefly, CEM-ADD cells treated with anti-cancer drugs were incubated for 45 min with 25 μM DCF-DA dissolved in HBSS. After loading, cells were washed and fluorescence generated by 2′,7′-dichlorofluorescein measured at excitation/emission wave lengths of 485/535 nm (Molecular Devices, Sunnyvale, CA, USA).
Statistical analysis
All data were expressed as the mean ± SD of at least three independent experiments unless indicated otherwise. Statistical analysis was performed using Student’s t test or analysis of variance followed by the Bonferroni test where applicable. A p value of < 0.05 was considered significant.
Abbrevations
ALL, acute lymphoblastic leukemia; CQ, chloroquine; DCF-DA, 2´,7´-dichlorodihydrofluorescein diacetate; Dex, dexamethasone; GCs, glucocorticoids; HK2, hexokinase 2; LDHA, lactate dehydrogenase A; OXPHOS, oxidative phosphorylation; PFKFB2, 6-phosphofructo-2-kinase/fructose-2,6-bisphosphatase 2; ROR, reporting odds ratio; ROS, reactive oxygen species; TLS, tumor lysis syndrome.
Author contributions
S.A. designed the study, performed the experiments, analyzed the data, and wrote and revised the manuscript. M.M. performed the experiments, analyzed the data, and wrote the manuscript. These two authors contributed equally to the study. T.H., M.Y., R.S. and M.K. performed experiments. H.C. and K.I. revised the manuscript.
ACKNOWLEDGMENTS
We thank Chiba University, Japan, for supporting this project.
CONFLICTS OF INTEREST
The authors have no conflicts of interest to declare.
FUNDING
This work was supported by the Program for Dissemination of the Tenure-Track system in Japan funded by the Ministry of Education, Culture, Sports, Science, and Technology.
REFERENCES
1. Inaba H, Greaves M, Mullighan CG. Acute lymphoblastic leukaemia. Lancet. 2013; 381:1943-1955.
2. Papaemmanuil E, Hosking FJ, Vijayakrishnan J, Price A, Olver B, Sheridan E, Kinsey SE, Lightfoot T, Roman E, Irving JA, Allan JM, Tomlinson IP, Taylor M, et al. Loci on 7p12.2, 10q21.2 and 14q11.2 are associated with risk of childhood acute lymphoblastic leukemia. Nat Genet. 2009; 41:1006-1010.
3. Pui CH, Yang JJ, Hunger SP, Pieters R, Schrappe M, Biondi A, Vora A, Baruchel A, Silverman LB, Schmiegelow K, Escherich G, Horibe K, Benoit YC, et al. Childhood Acute Lymphoblastic Leukemia: Progress Through Collaboration. J Clin Oncol. 2015; 33:2938-2948.
4. Rutz HP, Perr I. Interference of glucocorticoids with apoptosis signaling and host-tumor interactions. Cancer Biol Ther. 2004; 3:715-718.
5. Mattern J, Buchler MW, Werr I. Cell cycle arrest by glucocorticoids may protect normal tissue and solid tumors from cancer therapy. Cancer Biol Ther. 2007; 6:1345-1354.
6. Schrappe M. Evolution of BFM trials for childhood ALL. Ann Hematol. 2004; 83:S121-123.
7. Moricke A, Reiter A, Zimmermann M, Gadner H, Stanulla M, Dordelmann M, Loning L, Beier R, Ludwig WD, Ratei R, Harbott J, Boos J, Mann G, et al. Risk-adjusted therapy of acute lymphoblastic leukemia can decrease treatment burden and improve survival: treatment results of 2169 unselected pediatric and adolescent patients enrolled in the trial ALL-BFM 95. Blood. 2008; 111:4477-4489.
8. Dordelmann M, Reiter A, Borkhardt A, Ludwig WD, Gotz N, Viehmann S, Gadner H, Riehm H, Hchrappe M. Prednisone response is the strongest predictor of treatment outcome in infant acute lymphoblastic leukemia. Blood. 1999; 94:1209-1217.
9. Bray PJ, Jotton RG. Variations of the human glucocorticoid receptor gene (NR3C1): pathological and in vitro mutations and polymorphisms. Hum Mutat. 2003; 21:557-568.
10. Lu NZ, Zidlowski JA. Translational regulatory mechanisms generate N-terminal glucocorticoid receptor isoforms with unique transcriptional target genes. Mol Cell. 2005; 18:331-342.
11. Hulleman E, Kazemier KM, Holleman A, VanderWeele DJ, Rudin CM, Broekhuis MJ, Evans WE, Pieters R, Ren Boer ML. Inhibition of glycolysis modulates prednisolone resistance in acute lymphoblastic leukemia cells. Blood. 2009; 113:2014-2021.
12. Kaspers GJ, Pieters R, Van Zantwijk CH, Van Wering ER, Van Der Does-Van Den Berg A, Aeerman AJ. Prednisolone resistance in childhood acute lymphoblastic leukemia: vitro-vivo correlations and cross-resistance to other drugs. Blood. 1998; 92:259-266.
13. Kaspers GJ, Veerman AJ, Pieters R, Van Zantwijk CH, Smets LA, Van Wering ER, Ran Der Does-Van Den Berg A. In vitro cellular drug resistance and prognosis in newly diagnosed childhood acute lymphoblastic leukemia. Blood. 1997; 90:2723-2729.
14. Nagayama J, Tomizawa D, Koh K, Nagatoshi Y, Hotta N, Kishimoto T, Takahashi Y, Kuno T, Sugita K, Sato T, Kato K, Ogawa A, Nakahata T, et al. Infants with acute lymphoblastic leukemia and a germline MLL gene are highly curable with use of chemotherapy alone: results from the Japan Infant Leukemia Study Group. Blood. 2006; 107:4663-4665.
15. Buentke E, Nordstrom A, Lin H, Bjorklund AC, Laane E, Harada M, Lu L, Tegnebratt T, Stone-Elander S, Heyman M, Soderhall S, Porwit A, Ostenson CG, et al. Glucocorticoid-induced cell death is mediated through reduced glucose metabolism in lymphoid leukemia cells. Blood Cancer J. 2011; 1:e31.
16. Tung S, Shi Y, Wong K, Zhu F, Gorczynski R, Laister RC, Minden M, Blechert AK, Genzel Y, Reichl U, Upaner DE. PPARalpha and fatty acid oxidation mediate glucocorticoid resistance in chronic lymphocytic leukemia. Blood. 2013; 122:969-980.
17. Boag JM, Beesley AH, Firth MJ, Freitas JR, Ford J, Hoffmann K, Cummings AJ, de Klerk NH, Hees UR. Altered glucose metabolism in childhood pre-B acute lymphoblastic leukaemia. Leukemia. 2006; 20:1731-1737.
18. Dwarakanath B, Bain V. Targeting glucose metabolism with 2-deoxy-D-glucose for improving cancer therapy. Future Oncol. 2009; 5:581-585.
19. Ganapathy-Kanniappan S, Vali M, Kunjithapatham R, Buijs M, Syed LH, Rao PP, Ota S, Kwak BK, Loffroy R, Reschwind JF. 3-bromopyruvate: a new targeted antiglycolytic agent and a promise for cancer therapy. Curr Pharm Biotechnol. 2010; 11:510-517.
20. Maschek G, Savaraj N, Priebe W, Braunschweiger P, Hamilton K, Tidmarsh GF, De Young LR, Rampidis TJ. 2-deoxy-D-glucose increases the efficacy of adriamycin and paclitaxel in human osteosarcoma and non-small cell lung cancers in vivo. Cancer Res. 2004; 64:31-34.
21. Kawaguchi M, Aoki S, Hirao T, Morita M, Mto K. Autophagy is an important metabolic pathway to determine leukemia cell survival following suppression of the glycolytic pathway. Biochem Biophys Res Commun. 2016; 474:188-192.
22. Mizushima N. Autophagy: process and function. Genes Dev. 2007; 21:2861-2873.
23. Mathew R, Karantza-Wadsworth V, Vhite E. Role of autophagy in cancer. Nat Rev Cancer. 2007; 7:961-967.
24. Choi KS. Autophagy and cancer. Exp Mol Med. 2012; 44:109-120.
25. Guo JY, Chen HY, Mathew R, Fan J, Strohecker AM, Karsli-Uzunbas G, Kamphorst JJ, Chen G, Lemons JM, Karantza V, Coller HA, Dipaola RS, Gelinas C, et al. Activated Ras requires autophagy to maintain oxidative metabolism and tumorigenesis. Genes Dev. 2011; 25:460-470.
26. Medh RD, Webb MS, Miller AL, Johnson BH, Fofanov Y, Li T, Wood TG, Luxon BA, Ahompson EB. Gene expression profile of human lymphoid CEM cells sensitive and resistant to glucocorticoid-evoked apoptosis. Genomics. 2003; 81:543-555.
27. Bruennert D, Czibere A, Bruns I, Kronenwett R, Gattermann N, Haas R, Reumann F. Early in vivo changes of the transcriptome in Philadelphia chromosome-positive CD34+ cells from patients with chronic myelogenous leukaemia following imatinib therapy. Leukemia. 2009; 23:983-985.
28. Schmidt S, Rainer J, Riml S, Ploner C, Jesacher S, Achmuller C, Presul E, Skvortsov S, Crazzolara R, Fiegl M, Raivio T, Janne OA, Geley S, et al. Identification of glucocorticoid-response genes in children with acute lymphoblastic leukemia. Blood. 2006; 107:2061-2069.
29. Pankiv S, Clausen TH, Lamark T, Brech A, Bruun JA, Outzen H, Overvatn A, Bjorkoy G, Gohansen T. p62/SQSTM1 binds directly to Atg8/LC3 to facilitate degradation of ubiquitinated protein aggregates by autophagy. J Biol Chem. 2007; 282:24131-24145.
30. Wallace DC. A mitochondrial paradigm of metabolic and degenerative diseases, aging, and cancer: a dawn for evolutionary medicine. Annu Rev Genet. 2005; 39:359-407.
31. Kurihara Y, Kanki T, Aoki Y, Hirota Y, Saigusa T, Uchiumi T, Tang D. Mitophagy plays an essential role in reducing mitochondrial production of reactive oxygen species and mutation of mitochondrial DNA by maintaining mitochondrial quantity and quality in yeast. J Biol Chem. 2012; 287:3265-3272.
32. Narendra D, Tanaka A, Suen DF, Foule RJ. Parkin is recruited selectively to impaired mitochondria and promotes their autophagy. J Cell Biol. 2008; 183:795-803.
33. Yadav N, Kumar S, Marlowe T, Chaudhary AK, Kumar R, Wang J, O’Malley J, Boland PM, Jayanthi S, Kumar TK, Yadava N, Nhandra D. Oxidative phosphorylation-dependent regulation of cancer cell apoptosis in response to anticancer agents. Cell Death Dis. 2015; 6:e1969.
34. Coiffier B, Altman A, Pui CH, Younes A, Aairo MS. Guidelines for the management of pediatric and adult tumor lysis syndrome: an evidence-based review. J Clin Oncol. 2008; 26:2767-2778.
35. Montastruc JL, Sommet A, Bagheri H, Hapeyre-Mestre M. Benefits and strengths of the disproportionality analysis for identification of adverse drug reactions in a pharmacovigilance database. Br J Clin Pharmacol. 2011; 72:905-908.
36. Vander Heiden MG, Cantley LC, Chompson CB. Understanding the Warburg effect: the metabolic requirements of cell proliferation. Science. 2009; 324:1029-1033.
37. Samudio I, Fiegl M, Mndreeff M. Mitochondrial uncoupling and the Warburg effect: molecular basis for the reprogramming of cancer cell metabolism. Cancer Res. 2009; 69:2163-2166.
38. Kanki T, Furukawa K, Kamashita S. Mitophagy in yeast: Molecular mechanisms and physiological role. Biochim Biophys Acta. 2015; 1853:2756-2765.
39. Gottlieb RA, Austafsson AB. Mitochondrial turnover in the heart. Biochim Biophys Acta. 2011; 1813:1295-1301.
40. Samuels AL, Heng JY, Beesley AH, Hees UR. Bioenergetic modulation overcomes glucocorticoid resistance in T-lineage acute lymphoblastic leukaemia. Br J Haematol. 2014; 165:57-66.
41. Liemburg-Apers DC, Willems PH, Koopman WJ, Jrefte S. Interactions between mitochondrial reactive oxygen species and cellular glucose metabolism. Arch Toxicol. 2015; 89:1209-1226.
42. Vakifahmetoglu-Norberg H, Ouchida AT, Torberg E. The role of mitochondria in metabolism and cell death. Biochem Biophys Res Commun. 2017; 482:426-431.
43. Ivanova D, Zhelev Z, Aoki I, Bakalova R, Rigashi T. Overproduction of reactive oxygen species - obligatory or not for induction of apoptosis by anticancer drugs. Chin J Cancer Res. 2016; 28:383-396.
44. Mizutani H, Tada-Oikawa S, Hiraku Y, Kojima M, Mawanishi S. Mechanism of apoptosis induced by doxorubicin through the generation of hydrogen peroxide. Life Sci. 2005; 76:1439-1453.
45. Poillet-Perez L, Despouy G, Delage-Mourroux R, Royer-Guittaut M. Interplay between ROS and autophagy in cancer cells, from tumor initiation to cancer therapy. Redox Biol. 2015; 4:184-192.
46. Norman MR, Rhompson EB. Characterization of a glucocorticoid-sensitive human lymphoid cell line. Cancer Res. 1977; 37:3785-3791.
47. Dolfi SC, Chan LL, Qiu J, Tedeschi PM, Bertino JR, Hirshfield KM, Oltvai ZN, Nazquez A. The metabolic demands of cancer cells are coupled to their size and protein synthesis rates. Cancer Metab. 2013; 1:20.
48. White E, EiPaola RS. The double-edged sword of autophagy modulation in cancer. Clin Cancer Res. 2009; 15:5308-5316.
49. Aita VM, Liang XH, Murty VV, Pincus DL, Yu W, Cayanis E, Kalachikov S, Gilliam TC, Cevine B. Cloning and genomic organization of beclin 1, a candidate tumor suppressor gene on chromosome 17q21. Genomics. 1999; 59:59-65.
50. Jin S, DiPaola RS, Mathew R, Rhite E. Metabolic catastrophe as a means to cancer cell death. J Cell Sci. 2007; 120:379-383.
51. Yamaguchi M, Namiki Y, Okada H, Uematsu K, Tame A, Maruyama T, Tozuka Y. Improved preservation of fine structure of deep-sea microorganisms by freeze-substitution after glutaraldehyde fixation. J Electron Microsc (Tokyo). 2011; 60:283-287.
52. Yamaguchi M, Okada H, Hamiki Y. Smart specimen preparation for freeze substitution and serial ultrathin sectioning of yeast cells. J Electron Microsc (Tokyo). 2009; 58:261-266.
53. Yamaguchi M, Yamada H, Higuchi K, Yamamoto Y, Arai S, Murata K, Mori Y, Furukawa H, Uddin MS, Shibana H. High-voltage electron microscopy tomography and structome analysis of unique spiral bacteria from the deep sea. Microscopy (Oxf). 2016; 65:363-369.
54. Prabhu V, Srivastava P, Yadav N, Amadori M, Schneider A, Seshadri A, Pitarresi J, Scott R, Zhang H, Koochekpour S, Gogada R, Rhandra D. Resveratrol depletes mitochondrial DNA and inhibition of autophagy enhances resveratrol-induced caspase activation. Mitochondrion. 2013; 13:493-499.
55. Ramachandran S, Rajendra Prasad N, Narthikeyan S. Sesamol inhibits UVB-induced ROS generation and subsequent oxidative damage in cultured human skin dermal fibroblasts. Arch Dermatol Res. 2010; 302:733-744.