
INTRODUCTION
Lung cancer is the most frequently diagnosed lethal malignancies in the world. As the poor 5-year survival rate, lung cancer has become the leading cause of death among females in more developed countries and males in the whole world. As is known to all, smoking is regarded as a common risk factor of lung cancer. Global cancer statistics state that 15% of men and 53% of women with lung cancer were not caused by smoking [1]. Smoking rates in Chinese women are lower than some European countries, but the incidence of lung cancer in China is relatively high [2]. This suggested us that some other factors may be involved in lung cancer in Chinese female population.
Caveolae is a plasma membrane invagination and juxtamembrane vesicles, which play a role in the macromolecular vesicle transportand can be regarded as a kind of lipid raft. Due to the ubiquitous tissue distribution of caveolae, it has been confirmed that caveolae involved a large number of cellular functions. Caveolin-1 (CAV1) protein is a principal structural component of caveolae and found in the cytosolic surface of caveolae, which called caveolar coat protein. In mammalian cells, CAV1 protein is quite small and highly conserved which can recruit many signaling molecules to caveloae and regulate their activity [3-5].
CAV1 has been found to be involved in a variety of cancer-associated biological processes, including cell migration and metastasis, cell transformation, angiogenesis, multidrug resistance [6-9]. CAV1 is an interesting gene for cancer as it may play different roles in different types of cancer at different stages. No consistent results regarding whether CAV1 is an oncogene or tumor suppressor gene. Most studies suggest that CAV1 may play a positive role in the early stages of cancer onset. In advanced tumors, CAV1 is frequently associated with poor prognosis and drug resistance [10].
Single nucleotide polymorphism (SNP) is a kind of single nucleotide change widely distributed in the human genome. There is increasing evidence suggesting that SNPs may play a critical role in the genesis and development of cancer [11-14]. The relationship between SNPs in CAV1 and cancer risk has not been extensively studied. In the present study, we performed a case-control study to assess the relationship between SNPs in CAV1 and the risk or survival of lung cancer in Chinese female non-smokers.
RESULTS
Basic characteristics of subjects
Table 1 listed the basic information of the subjects. A total of 923 subjects were included in the present study, including 468 lung cancer cases and 455 age-matched controls. All subjects were Chinese female nonsmokers, and there was no significant difference between cases and controls with regard to age (P=0.861). Among cases, there were 402 non-small cell lung cancer (NSCLC) and 66 small cell lung cancer (SCLC). Among the cases with NSCLC, there were 322 cases with adenocarcinoma, 66 cases with squamous cell carcinoma and 14 cases with a variety of different rare pathologies.
Table 1: Characteristics of included subjects
Variables |
Cases (%) |
Controls (%) |
P value |
|---|---|---|---|
Females |
468 |
455 |
|
Mean age (years) |
56.16±11.73 |
56.3±11.46 |
0.861 |
Histological |
|
|
|
Adenocarcinoma |
322 (68.8%) |
|
|
Squamous cell carcinoma |
66 (14.1%) |
|
|
Small cell lung cancer |
66 (14.1%) |
|
|
Othersa |
14 (3.0%) |
|
|
Stageb |
|
|
|
I |
10(2.3) |
|
|
II |
109(24.7) |
|
|
III |
267(60.5) |
|
|
IV |
55(12.5) |
|
|
aIncluding adenosquamous carcinoma, mixed cell carcinoma, large cell carcinoma and undifferentiated carcinoma.
bThere are missing values.
The effect of SNP on the risk of lung cancer
First we evaluated the relationship between the two SNPs and lung cancer risk. The results were summarized in Table 2. Genotype distributions of rs1049337 and rs926198 in control group were all in accordance with the HWE (P>0.05). Subjects carrying rs1049337 CC genotypes showed a decreased risk of lung cancer compared to the subjects carrying homozygous TT genotype (adjusted OR=0.691, 95%CI=0.482-0.990, p=0.044). Recessive model showed that take TT+TC genotype as reference group, CC genotype was the protective genotype of lung cancer risk (adjusted OR=0.688, 95%CI=0.510-0.929, P=0.015). Further analyses were carried on by allele comparison, the result indicated that compared with T allele, C allele was a protective allele of lung cancer risk (adjusted OR=0.829, 95%CI=0.691-0.995, P=0.045). For rs926198, taking rs926198-TT genotype as reference group, TC genotype showed a decreased risk of lung cancer (adjusted OR=0.552, 95%CI=0.367-0.830, P=0.004). Dominant model and additive model of rs926198 also showed statistically significant results (adjusted OR=0.557, 95%CI=0.372-0.834, P=0.005, adjusted OR=0.583, 95%CI=0.396-0.860, P=0.006, respectively).
Table 2: Genetic polymorphisms and risk of lung cancer
|
Genotype |
Lung cancer cases (%) |
Controls (%) |
P of HWE |
Adjusted OR a |
95% CI |
P |
|---|---|---|---|---|---|---|---|
Rs1049337 |
TT |
133 (28.4) |
118(25.9) |
0.061 |
Ref |
|
|
|
TC |
234 (50.0) |
207(45.5) |
|
1.006 |
0.738,1.373 |
0.968 |
|
CC |
101 (21.6) |
130(28.6) |
|
0.691 |
0.482,0.990 |
0.044* |
Dominant model |
|
|
|
|
0.882 |
0.659,1.179 |
0.395 |
Recessive model |
|
|
|
|
0.688 |
0.510,0.929 |
0.015* |
Additive model |
C allele |
|
|
|
0.829 |
0.691,0.995 |
0.045* |
Rs926198 |
TT |
425(90.8) |
385(84.6) |
0.506 |
Ref |
|
|
|
TC |
42(9.0) |
69(15.2) |
|
0.552 |
0.367,0.830 |
0.004* |
|
CC |
1(0.2) |
1(0.2) |
|
0.910 |
0.056,14.674 |
0.947 |
Dominant model |
|
|
|
|
0.557 |
0.372,0.834 |
0.005* |
Recessive model |
|
|
|
|
1.007 |
0.251,4.042 |
0.992 |
Additive mode |
C allele |
|
|
|
0.583 |
0.396,0.860 |
0.006* |
aAdjusted for age, ORs and 95% CIs were calculated by logistic regression. * P<0.05.
The results of stratified analysis were showed in Table 3 and Supplementary Table 1. In NSCLC cases and controls, rs926198 showed remarkable results. Compared with subjects carrying TT genotype, those whom carrying TC genotype had an adjusted OR of 0.551 (95%CI=0.359-0.846, P=0.006) for developing NSCLC. Dominant model and additive model of rs926198 also showed significant results.
Table 3: Genetic polymorphisms and risk of NSCLC
|
Genotype |
Controls (%) |
NSCLC (%) |
Adjusted OR a |
95% CI |
P |
Adenocarcinoma (%) |
Adjusted OR a |
95% CI |
P |
|---|---|---|---|---|---|---|---|---|---|---|
Rs1049337 |
TT |
118(25.9) |
114(28.4) |
Ref |
|
|
93(28.9) |
Ref |
|
|
|
TC |
207(45.5) |
201(50.0) |
1.008 |
0.984,1.011 |
0.962 |
167(51.9) |
1.028 |
0.731,1.444 |
0.875 |
|
CC |
130(28.6) |
87(21.6) |
0.694 |
0.477,1.009 |
0.056 |
62(19.3) |
0.605 |
0.402,0.909 |
0.015* |
Dominant model |
|
|
|
0.884 |
0.653,1.195 |
0.421 |
|
0.862 |
0.626,1.187 |
0.363 |
Recessive model |
|
|
|
0.692 |
0.506,0.946 |
0.021* |
|
0.594 |
0.421,0.839 |
0.003* |
Additive model |
C allele |
|
|
0.830 |
0.686,1.003 |
0.054 |
|
0.782 |
0.638,0.957 |
0.017* |
Rs926198 |
TT |
385(84.6) |
365(90.8) |
Ref |
|
|
286(88.8) |
Ref |
|
|
|
TC |
69(15.2) |
36(9.0) |
0.551 |
0.359,0.846 |
0.006* |
35(10.9) |
0.683 |
0.442,1.055 |
0.085 |
|
CC |
1(0.2) |
1(0.2) |
1.081 |
0.067,17.459 |
0.956 |
1(0.3) |
1.317 |
0.0781,21.289 |
0.846 |
Dominant model |
|
|
|
0.559 |
0.366,0.853 |
0.007* |
|
0.692 |
0.450,1.964 |
0.093 |
Recessive model |
|
|
|
1.176 |
0.073,18.967 |
0.909 |
|
1.406 |
0.087,22.699 |
0.810 |
Additive model |
C allele |
|
|
0.588 |
0.392,0.882 |
0.010* |
|
0.720 |
0.477,1.086 |
0.117 |
aAdjusted for age, ORs and 95% CIs were calculated by logistic regression. * P<0.05.
The results of analysis in patients with lung adenocarcinoma and controls indicated that recessive model and additive model of rs1049337 showed decreased lung adenocarcinoma risk (adjusted OR=0.594, 95%CI=0.421-0.839, P=0.003, adjusted OR=0.782, 95%CI=0.638-0.957, P=0.017, respectively). Compared with rs1049337-TT genotype, CC genotype was a protective genotype of lung adenocarcinoma (adjusted OR=0.605, 95%CI=0.402-0.909, P=0.015). In squamous cell carcinoma, rs926198 showed significant results, as the small sample size of squamous cell carcinoma patients, the results need to be verified in the future.
Haplotype analyses of the SNPs and lung cancer risk
We analyzed the relationship between haplotype and lung cancer risk. The haplotypes were constructed by rs1049337 and rs926198 (Table 4), four common haplotypes were observed. The linkage Disequilibrium (LD) plots are shown in Figure 1. C-C haplotye was a protective haplotype in lung cancer and NSCLC (OR=0.495, 95%CI=0.329-0.744, P<0.001; OR=0.510, 95%CI=0.334-0.780, P=0.001; respectively). Compared with the combination of all the other haplotypes, T-T haplotype showed an increased risk of adenocarcinoma (OR=1.261, 95%CI=1.030-1.545, P=0.025).
Table 4: Haplotypes and the risk of lung cancer (rs1049337-rs926198)
Haplotypea |
Controls (%) |
Lung cancer |
NSCLC |
Adenocarcinoma |
||||||
|---|---|---|---|---|---|---|---|---|---|---|
|
|
N (%) |
OR (95%CI) |
P |
N (%) |
OR (95%CI) |
P |
N (%) |
OR (95%CI) |
P |
CC |
71(7.8) |
37(4.0) |
0.495(0.329-0.744) |
<0.001* |
33(4.1) |
0.510(0.334-0.780) |
0.001* |
32(5.0) |
0.627(0.408-0.963) |
0.032* |
CT |
396(43.5) |
399(42.6) |
0.975(0.811-1.172) |
0.787 |
342(42.5) |
0.971(0.801-1.176) |
0.762 |
259(40.2) |
0.883(0.719-1.084) |
0.234 |
TC |
0(--) |
7(0.7) |
-- |
-- |
5(0.6) |
-- |
-- |
5(0.7) |
-- |
-- |
TT |
443(48.7) |
493(52.7) |
1.193(0.993-1.432) |
0.059 |
424(52.7) |
1.192(0.986-1.442) |
0.070 |
348(54.1) |
1.261(1.030-1.545) |
0.025* |
aFrequency of haplotypes <3% were excluded from the final analysis.* P<0.05
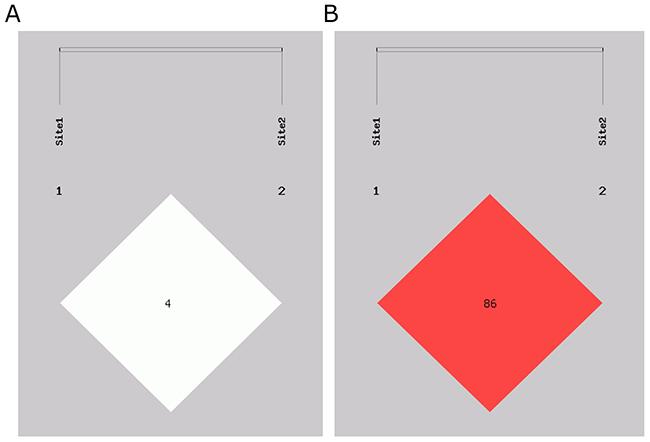
Figure 1: Linkage disequilibrium structure of two SNPs in CAV1. Site1 is rs104937. Site2 is 926198. (A) D’ linkage map of two SNPs in CAV1. (B) R2 linkage map of two SNPs in CAV1.
The effect of SNPs on the overall survival of lung cancer
The results of the relationship between genetic polymorphisms and survival time were summarized in Table 5, Supplementary Table 2 and Supplementary Figure 1. We have not observed any statistically significant association between rs1049337, rs926198 and lung cancer survival time.
Table 5: Distribution of genotypes and survival time of lung cancer patients
SNP |
Genotype |
Lung cancer (%) |
MST (mon) |
Log-rank P |
Adjusted HR a |
95% CI |
|---|---|---|---|---|---|---|
Rs1049337 |
TT |
97(27.6) |
24.5 |
|
Ref |
|
|
TC |
175(49.9) |
24.5 |
0.889 |
1.012 |
0.775,1.321 |
|
CC |
79(22.5) |
25.8 |
|
0.952 |
0.688,1.316 |
Dominant model |
|
254(72.4) |
24.9 |
0.952 |
0.991 |
0.770,1.275 |
Recessive model |
|
272(77.5) |
24.5 |
0.636 |
0.935 |
0.710,1.231 |
Rs926198 |
TT |
317(90.3) |
28.3 |
|
Ref |
|
|
TC+CC |
34(9.7) |
24.4 |
0.247 |
0.791 |
0.535,1.168 |
a Adjusted for age, HRs and 95% CIs were calculated by Cox regression.
Luciferase reporter assay
Supplementary Table 3 listed the predication results of microRNAs those may bind to CAV1 mRNA around rs1049337. Considering the predication score, finally hsa-miR-612 was selected to verify its relationship with rs1049337.
The result showed that rs1049337 can affect the binding affinity of CAV1 mRNA to some microRNAs (Figure 2). In the A549 cell line and the H1299 cell line, we got essentially identical results. Compared with C allele, T allele had a relatively decreased relative luciferase activity. When miR-612 mimics existed in cell, T allele had a lower expression level of CAV1 compared with C allele. Compared with mimics negative control, the relative luciferase activity of vectors containing C allele and T allele was significantly decreased when miR-612 mimics existed. The results indicated that rs1049337 can affect the binding affinity of CAV1 mRNA to the corresponding microRNA, these microRNAs include miR-612.
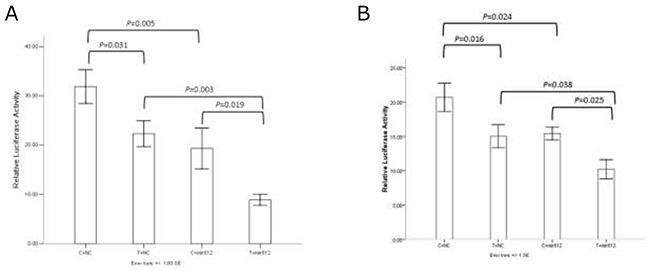
Figure 2: The results of dual luciferase reporter assay. (A) Results in A549 cell line. (B) Results in H1299 cell line.
The association of CAV1 expression level and lung cancer
Finally, we screened four datasets in GEO database which were suitable for our study. The results of the analysis of the relationship between CAV1 expression level and NSCLC were listed in Table 6. We found that compared with paired normal adjacent tissue or normal lung tissue, lung cancer tissue showed a relatively low level of CAV1 mRNA (P<0.001, P<0.001, respectively). In three datasets (GSE19804, GSE27716 and GSE40275), we found that referring to those patients at early stage of lung cancer, the expression level of CAV1 in patients at late stage was relatively low (P=0.007, P=0.005, P=0.001, respectively). In GSE27716, a borderline statistical difference was found in the comparison of CAV1 mRNA levels in noninvasive lung adenocarcinoma patients and invasive lung adenocarcinoma patients (P=0.08).
Table 6: The association of CAV1 expression level and lung cancer
GEO dataset |
Variable |
N |
Mediana |
P |
|---|---|---|---|---|
GSE19804 |
Tissue |
|
|
|
|
Paired normal adjacent tissue |
60 |
13.192 |
<0.001* |
|
NSCLC tissue |
60 |
10.728 |
|
|
Stage |
|
|
|
|
I |
34 |
11.093 |
0.007* |
|
II / III / IV |
26 |
10.054 |
|
GSE27716 |
Invasive |
|
|
|
|
Noninvasive lung adenocarcinoma specimen |
17 |
8.717 |
0.080 |
|
Invasive lung adenocarcinoma specimen |
23 |
7.450 |
|
|
Stage |
|
|
|
|
Ia |
23 |
8.355 |
0.005* |
|
Ib / II / III |
17 |
7.437 |
|
GSE29013 |
Histological |
|
|
|
|
Squamous cell carcinoma |
25 |
8.097 |
0.001* |
|
Adenocarcinoma |
30 |
7.398 |
|
|
Stage |
|
|
|
|
I |
24 |
7.852 |
0.519 |
|
II / III |
31 |
7.689 |
|
|
Chemotherapy |
|
|
|
|
Yes |
34 |
7.598 |
0.100 |
|
No |
21 |
7.954 |
|
GSE40275 |
Subjects |
|
|
|
|
Normal lung sample |
43 |
9.577 |
<0.001* |
|
NSCLC sample |
18 |
7.963 |
|
|
SCLC sample |
23 |
5.883 |
|
|
Gender |
|
|
|
|
Female |
36 |
9.464 |
<0.001* |
|
Male |
48 |
7.963 |
|
|
Stage |
|
|
|
|
I |
20 |
7.772 |
0.001* |
|
II / III |
21 |
5.795 |
|
aExpression level of CAV1. * P<0.05.
DISCUSSION
The role of CAV1 in cancer is oncogene or tumor suppressor gene hasn’t been agreed yet, and the role of CAV1 in lung cancer has rarely been studied [3, 4, 7]. We conducted a study to explore the relationship between CAV1 gene polymorphism, expression level and lung cancer. We found that the CAV1-rs1049337, CAV1-rs926198 may affect the susceptibility of lung cancer in the Chinese female non-smokers. Further experiments revealed that compared with rs1049337-T allele, the increased relative luciferase activity was found in C allele. It was proved that the different allele of rs1049337 could affect the binding affinity of CAV1 to the corresponding microRNA. We also found that CAV1 expression may play a positive role in lung cancer.
MicroRNA is a class of single stranded noncoding RNA which is considered to regulate large number of genes at post transcriptional level. The regulatory effect of microRNA on gene expression is achieved by microRNA seed region complementary base pairing to the 3’UTR region of the target gene [15, 16]. Any nucleotide change in 3’UTR region of target gene can affect the affinity of target gene and microRNA, and further influence the expression level of target gene. Rs1049337 is located at 3’UTR region of CAV1 gene. Our study found that compared with rs1049337-T allele, C allele was a protective allele for risk of lung cancer. Further investigation demonstrated that rs1049337 can affect the binding affinity of CAV1 mRNA to the corresponding microRNAs. Finally, we found that CAV1 expression may play a positive role in lung cancer. As far as we know, there are very few studies on the relationship between rs1049337 and disease. A study on the relationship between genetic variation in CAV1 and long-term pancreas transplant function found that rs1049337 is a tag SNP of CAV1, but there’s no significant correlation between long-term graft function, long-term pancreas function and rs1049337 was observed in donors and recipients respectively [17]. The MuTHER study was found that rs1049337 is an expression Quantitative Trait Loci (eQTL), and another study based on the MuTHER study revealed that rs1049337 is an eQTL with an age-by-genotype interaction effect associated to GWAS hits [18, 19]. Although we have studied the mechanism of how rs1049337 affects lung cancer, considering racial differences and the credibility of a single study, multicenter replication studies still need to be done.
Rs926198 is located at intron region of CAV1. Although we haven’t figured out how does intron SNPs play a role in disease, a large number of genome-wide association study (GWAS) have confirmed that intron SNPs are associated with a variety of diseases in a quite robust P value [20-22]. In our study, we found that compared with rs926198-T allele, C allele was a protective allele for lung cancer risk. To the best of our knowledge, it’s the first study to explore the relationship between rs926198 and cancer. Previous studies indicated that rs926198 is associated with metabolic syndrome, fasting insulin levels, insulin resistance, hyperinsulinemic, hypertension and systemic sclerosis [23-26]. After further study, Rene Baudrand et al. found that in inadipose tissues, rs926198 minor allele is associated with a lower expression level of CAV1 [24]. So it is necessary to further explore the mechanism of how rs926198 plays a role in the disease.
CAV1 is localized to 7q31.2, closed to D7S522 locus which is a fragile site that is frequently absent in cancer and is thought to be a suspected tumor suppressor locus [27]. Indeed, CAV1 is considered to play a positive role in some cancer studies, but the results of some other studies were exactly the opposite. Whether in vitro or in animal or in cancer patients, CAV1 is a tumor promoter gene or tumor suppressor gene that has not been consistent. Breast cancer is the most widely studied cancer with CAV1. One study found that compared with normal mammary epithelial counterparts, CAV1 showed a significant decrease in breast cancer cell, and loss of CAV1 expression was found in P53 deficient cells [28]. CAV1 can inhibit the growth and metastasis of breast cancer [29]. The molecular mechanism study revealed that in human breast cancer-associated fibroblasts, down regulated CAV1 expression play a key role in maintaining the abnormal phenotype [30, 31]. Breast cancer patients with loss CAV1 expression in stromal cells were associated with shorter survival time, increased risk of early tumor recurrence, higher recurrence rate and metastasis, higher CAV1 expression in tumor cells were associated with poor survival [32-37]. Other studies have suggested that CAV1 plays a negative role in breast cancer. In human breast cancer cell, CAV1 accumulates at invadopodia and its knockdown inhibits invadopodia formation [38]. CAV1 is thought to be a potential causative factor of trastuzumab resistance generation in breast cancer cells [39]. In prostate cancer cell, CAV1 is thought to promote metastatic activities, proangiogenic activities, promote tumor progression and promotes lymphangiogenesis [40-43]. In prostate cancer stroma, loss of CAV1 associated with reduced relapse-free survival [44]. The positive expression of CAV1 was more observed in high grade urothelial carcinoma and bladder cancer patients [45, 46]. In human transitional bladder cancer cell with drug resistance, the expression level of CAV1 was found to be elevated [47]. But one study has found that compared with normal tissue, CAV1 had a decreased expression in bladder cancer tissues [48]. The expression of CAV1 in colon carcinoma was up-regulated or down-regulated, the results of different studies have been quite different [49-51]. In Apc (min/+) mice with deficiency of CAV1, a promoted colorectal tumorigenesis was observed [52]. A meta analysis showed that overexpression of CAV1 was associated with a better overall survival in gastric cancer patients [53].
In CAV1 null (CAV-1 -/-) mouse model, hypercellularity with thickened alveolar septa was observed in lung parenchyma, disorganize and multilayer was observed in alveolar wall [54, 55]. In lung cancer cell lines, there is controversy about whether CAV1 is expressed. Compared with lung epithelial cell, one study showed that the expression of CAV1 was reduced in lung adenocarcinoma cell lines [56]. In another study, CAV1 was found to be reduced in small cell lung cancer cell lines, but in 76% of NSCLC cell lines, it is still expressed [57]. In lung cancer patients, compared with the adjacent tissues or normal lung tissue, the expression of CAV1 was down-regulated in cancer tissues [58-62]. But CAV1 was more frequently expressed in NSCLC patients those with drug resistance and poor prognosis [60, 63-65]. In our study, CAV1 may be considered to play a positive role in the genesis and development of lung cancer. Further study on the relationship between CAV1 and cancer is urgently needed
MATERIALS AND METHODS
Study subject
This study is approved by the ethics committee of China Medical University. Each participant signed an informed consent before participating in the study. All of the participants were unrelated Chinese Han population and non-smoking women. Patients with lung cancer were recruited from the First Affiliated Hospital of China Medical University and Liaoning Cancer Hospital& Institute. All of the patients were newly detected and had not received any radiotherapy or chemotherapy. Over the same period, controls were recruited from the health examination center of the same hospital and frequency-matched to cases in age.
Data collection and SNP genotyping
Clinical information of patients was collected from patients’ medical records. By face-to-face interviews, we obtained the personal information from each subject. The data was recorded age, status of smoking, family history of cancer, etc. Subjects who had smoked less than 100 cigarettes in their lifetime were defined as non-smokers. Each subject was collected 10ml of venous blood. DNA was extracted from whole blood using standard Phenol-chloroform Method and was stored at -20°C for subsequent experiments. We carried out the follow up by telephone among the patients once every three months. SNPs were genotyped by using the Illumina 660W SNP microarray (Illumina Inc., San Diego, CA).
Cell culture and transfection
We purchased A549 and H1299 cell line from Shanghai Institute of Biochemistry and Cell Biology, Chinese Academy of Sciences. A549 and H1299 cell lines were cultured in RPMI-1640 medium (Biological Industries, Israel) supplemented with 10% fetal bovine serum (Biological Industries, Israel), 80U/ml penicilin and 0.08mg/ml streptomycin, followed by incubation with 5% CO2 at 37°C. A549 and H1299 cell lines transiently transfected using Opti-MEM (Gibco, USA) and Lipofectamine 3000 (Invitrogen, USA) according to the manufacturer’s instructions.
Luciferase reporter assay
In order to screen out those microRNAs that may binding to 3’UTR region of CAV1 mRNA around rs1049337, we adopted 4 database for microRNA predication, including MirSNP [66], miRNASNP [67], PolymiRTS Database 3.0 [68], SNPinfo web server [69].
MicroRNA mimics were purchased from GenePharma (GenePharma, China). A 602-bp fragment of CAV1 3’UTR containing rs1049337-C or rs1049337-T were amplified and cloned in GV272 vector (GeneChem, China). All reporter plasmid were verified by direct sequencing. Cell were cultured in 24-well plates, transient transfection was performed at the logarithmic phase. 48 hours after transfection, the firefly luciferase and renilla luciferase were quantified by Dual-Luciferase Reporter Assay System (Promega, USA). We performed three independent experiments and each was done in triplicate.
The association of CAV1 expression level and lung cancer
In order to evaluate whether the expression level of CAV1 can affect the progression and prognosis of lung cancer patients, we systematically searched the GEO database to obtain the NSCLC gene expression profile datasets with prognostic information [70, 71]. Data extraction were using GEO2R web tool in GEO database. If there are multiple probes corresponding to the same gene, the average value of these probes was calculated as the expression level of the gene.
Statistical analysis
Student’s t-test (for continuous variable) and chi-squared test (for categorical variables) were used to measure the difference between two groups in the distribution of demographic characteristics. Comparison of continuous variables between three or more groups were used one-way analysis of variance (ANOVA). In control group, the Pearson chi-squared test was adopted to determine whether the genotype frequencies follow Hardy-Weinberg equilibrium (HWE). Unconditional logistic regression model was applied to calculate the odds ratios (ORs) and their 95% confidence intervals (CIs) to evaluate the relationship between SNPs and lung cancer risk with adjustment for age. The haplotypes frequency estimation and the analysis of association between haplotypes and lung cancer risk were using SHEsis online web-server [72, 73]. Statistical analyses were carried out using SPSS 22.0 software (IBM, USA). All p value were two sided and p<0.05 was considered statistically significant.
Author contributions
Conceived and designed the experiment: BZ ZY XF. Performed the experiments: XF XL XQ. Analyzed the data: XF XL. Contributed reagents/materials/analysis tools: BZ ZY YZ. Wrote the paper: XF BZ. Statistical analysis and interpretation: XF ZY XL.
ACKNOWLEDGMENTS
We thank the GEO database for making the data public. Heartfelt thanks to each author’s and subjects’s contribution.
CONFLICTS OF INTEREST
There is no potential conflict of interest in this study.
FUNDING
This study was supported by grants No. 81272293 from the National Natural Science Foundation of China.
REFERENCES
1. Parkin DM, Bray F, Ferlay J, Pisani P. Global cancer statistics, 2002. Ca-Cancer J Clin. 2005; 55:74-108.
2. Torre LA, Bray F, Siegel RL, Ferlay J, Lortet-Tieulent J, Jemal A. Global Cancer Statistics, 2012. Ca-Cancer J Clin. 2015; 65:87-108. https://doi.org/10.3322/caac.21262.
3. Shatz M, Liscovitch M. Caveolin-1: A tumor-promoting role in human cancer. Int J Radiat Biol. 2008; 84:177-89. https://doi.org/10.1080/09553000701745293.
4. Goetz JG, Lajoie P, Wiseman SM, Nabi IR. Caveolin-1 in tumor progression: the good, the bad and the ugly. Cancer Metast Rev. 2008; 27:715-35. https://doi.org/10.1007/s10555-008-9160-9.
5. Cohen AW, Hnasko R, Schubert W, Lisanti MP. Role of caveolae and caveolins in health and disease. Physiol Rev. 2004; 84:1341-79. https://doi.org/10.1152/physre.00046.2003.
6. Williams TM, Lisanti MP. Caveolin-1 in oncogenic transformation, cancer, and metastasis. Am J Physiol-Cell Ph. 2005; 288:C494-C506. https://doi.org/10.1152/ajpcell.00458.2004.
7. Navarro A, Anand-Apte B, Parat MO. A role for caveolae in cell migration. Faseb J. 2004; 18:1801-11. https://doi.org/10.1096/fj.04-2516rev.
8. Ravid D, Maor S, Werner H, Liscovitch M. Caveolin-1 inhibits cell detachment-induced p53 activation and anoikis by upregulation of insulin-like growth factor-I receptors and signaling. Oncogene. 2005; 24:1338-47.
9. Yang G, Addai J, Wheeler TM, Frolov A, Miles BJ, Kadmon D, Thompson TC. Correlative evidence that prostate cancer cell-derived caveolin-1 mediates angiogenesis. Hum Pathol. 2007; 38:1688-95. https://doi.org/10.1016/j.humpath.2007.03.024.
10. Senetta R, Stella G, Pozzi E, Sturli N, Massi D, Cassoni P. Caveolin-1 as a promoter of tumour spreading: when, how, where and why. J Cell Mol Med. 2013; 17:325-36. https://doi.org/10.1111/jcmm.12030.
11. Fang X, Yin Z, Li X, Xia L, Zhou B. Polymorphisms in GEMIN4 and AGO1 Genes Are Associated with the Risk of Lung Cancer: A Case-Control Study in Chinese Female Non-Smokers. International journal of environmental research and public health. 2016; 13.
12. Yin ZH, Cui ZG, Guan P, Li XL, Wu W, Ren YW, He QC, Zhou BS. Interaction between Polymorphisms in Pre-MiRNA Genes and Cooking Oil Fume Exposure on the Risk of Lung Cancer in Chinese Non-Smoking Female Population. PloS one. 2015; 10:e0128572. https://doi.org/10.1371/journal.pone.0128572.
13. Gao F, Xiong XY, Pan WT, Yang XY, Zhou CC, Yuan QP, Zhou LQ, Yang M. A Regulatory MDM4 Genetic Variant Locating in the Binding Sequence of Multiple MicroRNAs Contributes to Susceptibility of Small Cell Lung Cancer. PloS one. 2015; 10:e0135647. https://doi.org/10.1371/journal.pone.0135647.
14. Wang XC, Ren H, Zhao T, Ma W, Dong J, Zhang S, Xin W, Yang S, Jia L, Hao J. Single nucleotide polymorphism in the microRNA-199a binding site of HIF1A gene is associated with pancreatic ductal adenocarcinoma risk and worse clinical outcomes. Oncotarget. 2016; 7:13717-29. https://doi.org/10.18632/oncotarget.7263.
15. Lewis BP, Burge CB, Bartel DP. Conserved seed pairing, often flanked by adenosines, indicates that thousands of human genes are microRNA targets. Cell. 2005; 120:15-20. https://doi.org/10.1016/j.cell.2004.12.035.
16. Ambros V. The functions of animal microRNAs. Nature. 2004; 431:350-5. https://doi.org/10.1038/nature02871.
17. Hamilton A, Mittal S, Barnardo MCNM, Fuggle SV, Friend P, Gough SCL, Simmonds MJ. Genetic Variation in Caveolin-1 Correlates With Long-Term Pancreas Transplant Function. Am J Transplant. 2015; 15:1392-9. https://doi.org/10.1111/ajt.13104.
18. Grundberg E, Small KS, Hedman AK, Nica AC, Buil A, Keildson S, Bell JT, Yang TP, Meduri E, Barrett A, Nisbett J, Sekowska M, Wilk A, et al. Mapping cis- and trans-regulatory effects across multiple tissues in twins. Nature genetics. 2012; 44:1084-9. https://doi.org/10.1038/ng.2394.
19. Glass D, Vinuela A, Davies MN, Ramasamy A, Parts L, Knowles D, Brown AA, Hedman AK, Small KS, Buil A, Grundberg E, Nica AC, Di Meglio P, et al. Gene expression changes with age in skin, adipose tissue, blood and brain. Genome Biol. 2013; 14:R75. https://doi.org/10.1186/gb-2013-14-7-r75.
20. Hunter DJ, Kraft P, Jacobs KB, Cox DG, Yeager M, Hankinson SE, Wacholder S, Wang ZM, Welch R, Hutchinson A, Wang JW, Yu K, Chatterjee N, et al. A genome-wide association study identifies alleles in FGFR2 associated with risk of sporadic postmenopausal breast cancer. Nature genetics. 2007; 39:870-4. https://doi.org/10.1038/ng2075.
21. Saxena R, Voight BF, Lyssenko V, Burtt NP, de Bakker PIW, Chen H, Roix JJ, Kathiresan S, Hirschhorn JN, Daly MJ, Hughes TE, Groop L, Altshuler D, et al. Genome-wide association analysis identifies loci for type 2 diabetes and triglyceride levels. Science. 2007; 316:1331-6. https://doi.org/10.1126/science.1142358.
22. Amundadottir L, Kraft P, Stolzenberg-Solomon RZ, Fuchs CS, Petersen GM, Arslan AA, Bueno-De-Mesquita HB, Gross M, Helzlsouer K, Jacobs EJ, LaCroix A, Zheng W, Albanes D, et al. Genome-wide association study identifies variants in the ABO locus associated with susceptibility to pancreatic cancer. Nature genetics. 2009; 41:986-90. https://doi.org/10.1038/ng.429.
23. Manetti M, Allanore Y, Saad M, Fatini C, Cohignac V, Guiducci S, Romano E, Airo P, Caramaschi P, Tinazzi I, Riccieri V, Della Rossa A, Abbate R, et al. Evidence for caveolin-1 as a new susceptibility gene regulating tissue fibrosis in systemic sclerosis. Ann Rheum Dis. 2012; 71:1034-41. https://doi.org/10.1136/annrheumdis-2011-200986.
24. Baudrand R, Gupta N, Garza AE, Vaidya A, Leopold JA, Hopkins PN, Jeunemaitre X, Ferri C, Romero JR, Williams J, Loscalzo J, Adler GK, Williams GH, et al. Caveolin 1 Modulates Aldosterone-Mediated Pathways of Glucose and Lipid Homeostasis. J Am Heart Assoc. 2016; 5. https://doi.org/10.1161/JAHA.116.003845.
25. Baudrand R, Goodarzi MO, Vaidya A, Underwood PC, Williams JS, Jeunemaitre X, Hopkins PN, Brown N, Raby BA, Lasky-Su J, Adler GK, Cui JR, Guo XQ, et al. A prevalent caveolin-1 gene variant is associated with the metabolic syndrome in Caucasians and Hispanics. Metabolism. 2015; 64:1674-81. https://doi.org/10.1016/j.metabol.2015.09.005.
26. Pojoga LH, Underwood PC, Goodarzi MO, Williams JS, Adler GK, Jeunemaitre X, Hopkins PN, Raby BA, Lasky-Su J, Sun B, Cui JR, Guo XQ, Taylor KD, et al. Variants of the Caveolin-1 Gene: A Translational Investigation Linking Insulin Resistance and Hypertension. J Clin Endocr Metab. 2011; 96:E1288-E92. https://doi.org/10.1210/jc.2010-2738.
27. Engelman JA, Zhang XL, Lisanti MP. Genes encoding human caveolin-1 and -2 are co-localized to the D7S522 locus (7q31.1), a known fragile site (FRA7G) that is frequently deleted in human cancers. Febs Lett. 1998; 436:403-10. https://doi.org/10.1016/s0014-5793(98)01134-x.
28. Lee SW, Reimer CL, Oh P, Campbell DB, Schnitzer JE. Tumor cell growth inhibition by caveolin re-expression in human breast cancer cells. Oncogene. 1998; 16:1391-7.
29. Sloan EK, Stanley KL, Anderson RL. Caveolin-1 inhibits breast cancer growth and metastasis. Oncogene. 2004; 23:7893-7. https://doi.org/10.1038/sj.onc.1208062.
30. Mercier I, Casimiro MC, Wang CG, Rosenberg AL, Quong J, Minkeu A, Allen KG, Danilo C, Sotgia F, Bonuccelli G, Jasmin JF, Xu H, Bosco E, et al. Human breast cancer-associated fibroblasts (CAFs) show caveolin-1 downregulation and RB tumor suppressor functional inactivation - Implications for the response to hormonal therapy. Cancer Biol Ther. 2008; 7:1212-25.
31. Sotgia F, Del Galdo F, Casimiro MC, Bonuccelli G, Mercier I, Whitaker-Menezes D, Daumer KM, Zhou J, Wang CG, Katiyar S, Xu H, Bosco E, Quong AA, et al. Caveolin-1(-/-) Null Mammary Stromal Fibroblasts Share Characteristics with Human Breast Cancer-Associated Fibroblasts. Am J Pathol. 2009; 174:746-61. https://doi.org/10.2353/ajpath.2009.080658.
32. Witkiewicz AK, Dasgupta A, Sammons S, Er O, Potoczek MB, Guiles F, Sotgia F, Brody JR, Mitchell EP, Lisanti MP. Loss of stromal caveolin-1 expression predicts poor clinical outcome in triple negative and basal-like breast cancers. Cancer Biol Ther. 2010; 10:135-43.
33. Witkiewicz AK, Kline J, Queenan M, Brody JR, Tsirigos A, Bilal E, Pavlides S, Ertel A, Sotgia F, Lisanti MP. Molecular profiling of a lethal tumor microenvironment, as defined by stromal caveolin-1 status in breast cancers. Cell cycle. 2011; 10:1794-809. https://doi.org/10.4161/cc.10.11.15675.
34. Witkiewicz AK, Dasgupta A, Nguyen KH, Liu C, Kovatich AJ, Schwartz GF, Pestell RG, Sotgia F, Rui H, Lisanti MP. Stromal caveolin-1 levels predict early DCIS progression to invasive breast cancer. Cancer Biol Ther. 2009; 8:1071-9. https://doi.org/10.4161/cbt.8.11.8874.
35. Witkiewicz AK, Dasgupta A, Sotgia F, Mercier I, Pestell RG, Sabel M, Kleer CG, Brody JR, Lisanti MP. An Absence of Stromal Caveolin-1 Expression Predicts Early Tumor Recurrence and Poor Clinical Outcome in Human Breast Cancers. Am J Pathol. 2009; 174:2023-34. https://doi.org/10.2353/ajpath.2009.080873.
36. Qian N, Ueno T, Kawaguchi-Sakita N, Kawashima M, Yoshida N, Mikami Y, Wakasa T, Shintaku M, Tsuyuki S, Inamoto T, Toi M. Prognostic significance of tumor/stromal caveolin-1 expression in breast cancer patients. Cancer Sci. 2011; 102:1590-6. https://doi.org/10.1111/j.1349-7006.2011.01985.x.
37. Ma XL, Liu L, Nie W, Li YY, Zhang BL, Zhang J, Zhou RB. Prognostic role of caveolin in breast cancer: A meta-analysis. Breast. 2013; 22:462-9. https://doi.org/10.1016/j.breast.2013.03.005.
38. Yamaguchi H, Takeo Y, Yoshida S, Kouchi Z, Nakamura Y, Fukami K. Lipid Rafts and Caveolin-1 Are Required for Invadopodia Formation and Extracellular Matrix Degradation by Human Breast Cancer Cells. Cancer research. 2009; 69:8594-602. https://doi.org/10.1158/0008-5472.CAN-09-2305.
39. Sekhar SC, Kasai T, Satoh A, Shigehiro T, Mizutani A, Murakami H, El-Aarag BYA, Salomon DS, Massaguer A, de Llorens R, Seno M. Identification of Caveolin-1 as a Potential Causative Factor in the Generation of Trastuzumab Resistance in Breast Cancer Cells. Journal of Cancer. 2013; 4:391-401.
40. Williams TM, Hassan GS, Li JW, Cohen AW, Medina F, Frank PG, Pestell RG, Di Vizio D, Loda M, Lisanti MP. Caveolin-1 promotes tumor progression in an autochthonous mouse model of prostate cancer - Genetic ablation of Cav-1 delays advanced prostate tumor development in tramp mice. Journal of Biological Chemistry. 2005; 280:25134-45. https://doi.org/10.1074/jbc.M501186200.
41. Li LK, Yang G, Ebara S, Satoh T, Nasu Y, Timme TL, Ren CZ, Wang JX, Tahir SA, Thompson TC. Caveolin-1 mediates testosterone-stimulated survival/clonal growth and promotes metastatic activities in prostate cancer cells. Cancer research. 2001; 61:4386-92.
42. Tahir SA, Yang G, Goltsov AA, Watanabe M, Tabata KI, Addai J, Fattah EMA, Kadmon D, Thompson TC. Tumor cell-secreted caveolin-1 has proangiogenic activities in prostate cancer. Cancer research. 2008; 68:731-9.
43. Nassar ZD, Hill MM, Parton RG, Francois M, Parat MO. Non-caveolar caveolin-1 expression in prostate cancer cells promotes lymphangiogenesis. Oncoscience. 2015; 2:635-45. https://doi.org/10.18632/oncoscience.180.
44. Ayala G, Morello M, Frolov A, You SY, Li RL, Rosati F, Bartolucci G, Danza G, Adam RM, Thompson TC, Lisanti MP, Freeman MR, Di Vizio D. Loss of caveolin-1 in prostate cancer stroma correlates with reduced relapse-free survival and is functionally relevant to tumour progression. J Pathol. 2013; 231:77-87. https://doi.org/10.1002/path.4217.
45. Fong A, Garcia E, Gwynn L, Lisanti MP, Fazzari MJ, Li M. Expression of caveolin-1 and caveolin-2 in urothelial carcinoma of the urinary bladder correlates with tumor grade and squamous differentiation. Am J Clin Pathol. 2003; 120:93-100. https://doi.org/10.1309/292nhaynwavrej37.
46. Rajjayabun PH, Garg S, Durkan GC, Charlton R, Robinson MC, Mellon JK. Caveolin-1 expression is associated with high-grade bladder cancer. Urology. 2001; 58:811-4. https://doi.org/10.1016/s0090-4295(01)01337-1.
47. Chen Q, Chong T, Yin J, Luo P, Deng A. Molecular events are associated with resistance to vinblastine in bladder cancer. Cell Mol Biol. 2015; 61:33-8.
48. Shi R, Zhao Z, Gao Y, Wu QH, Song YB, Jiang L, Zheng WL, Ma WL. [Analysis and verification of the interaction network of differentially expressed genes in invasive bladder cancer.] [Article in Chinese]. Nan Fang Yi Ke Da Xue Xue Bao. 2010; 30:1771-4.
49. Bender FC, Reymond MA, Bron C, Quest AFG. Caveolin-1 levels are down-regulated in human colon tumors, and ectopic expression of caveolin-1 in colon carcinoma cell lines reduces cell tumorigenicity. Cancer research. 2000; 60:5870-8.
50. Fine SW, Lisanti MP, Galbiati F, Li MM. Elevated expression of caveolin-1 in adenocarcinoma of the colon. Am J Clin Pathol. 2001; 115:719-24.
51. Patlolla JMR, Swamy MV, Raju J, Rao CV. Overexpression of caveolin-1 in experimental colon adenocarcinomas and human colon cancer cell lines. Oncology Reports. 2004; 11:957-63.
52. Friedrich T, Richter B, Gaiser T, Weiss C, Janssen KP, Einwachter H, Schmid RM, Ebert MPA, Burgermeister E. Deficiency of caveolin-1 in Apc (min/+) mice promotes colorectal tumorigenesis. Carcinogenesis. 2013; 34:2109-18. https://doi.org/10.1093/carcin/bgt142.
53. Ye Y, Miao SH, Lu RZ, Zhou JW. Prognostic Value of Caveolin-1 Expression in Gastric Cancer: a Meta-analysis. Asian Pacific Journal of Cancer Prevention. 2014; 15:8367-70. https://doi.org/10.7314/Apjcp.2014.15.19.8367.
54. Razani B, Engelman JA, Wang XB, Schubert W, Zhang XL, Marks CB, Macaluso F, Russell RG, Li MM, Pestell RG, Di Vizio D, Hou H, Kneitz B, et al. Caveolin-1 null mice are viable but show evidence of hyperproliferative and vascular abnormalities. Journal of Biological Chemistry. 2001; 276:38121-38.
55. Hnasko R, Lisanti MP. The biology of caveolae: lessons from caveolin knockout mice and implications for human disease. Molecular interventions. 2003; 3:445-64. https://doi.org/10.1124/mi.3.8.445.
56. Racine C, Belanger M, Hirabayashi H, Boucher M, Chakir J, Couet J. Reduction of caveolin 1 gene expression in lung carcinoma cell lines. Biochem Bioph Res Co. 1999; 255:580-6. https://doi.org/10.1006/bbrc.1999.0236.
57. Sunaga N, Miyajima K, Suzuki M, Sato M, White MA, Ramirez RD, Shay JW, Gazdar AF, Minna JD. Different roles for caveolin-1 in the development of non-small cell lung cancer versus small cell lung cancer. Cancer research. 2004; 64:4277-85. https://doi.org/10.1158/0008-5472.Can-03-3941.
58. Kopantzev EP, Monastyrskaya GS, Vinogradova TV, Zinovyeva MV, Kostina MB, Filyukova OB, Tonevitsky AG, Sukhikh GT, Sverdlov ED. Differences in gene expression levels between early and later stages of human lung development are opposite to those between normal lung tissue and non-small lung cell carcinoma. Lung cancer. 2008; 62:23-34. https://doi.org/10.1016/j.lungcan.2008.02.011.
59. Wikman H, Seppanen JK, Sarhadi VK, Kettunen F, Salmenkivi K, Kuosma F, Vainio-Siukola K, Nagy B, Karjalainen A, Sioris T, Salo JN, Hollmen J, Knuutila S, et al. Caveolins as tumour markers in lung cancer detected by combined use of cDNA and tissue microarrays. J Pathol. 2004; 203:584-93. https://doi.org/10.1002/path.1552.
60. Zhan P, Shen XK, Qian Q, Wang Q, Zhu JP, Zhang Y, Xie HY, Xu CH, Hao KK, Hu W, Xia N, Lu GJ, Yu LK. Expression of caveolin-1 is correlated with disease stage and survival in lung adenocarcinomas. Oncology Reports. 2012; 27:1072-8. https://doi.org/10.3892/or.2011.1605.
61. Tenzer S, Leidinger P, Backes C, Huwer H, Hildebrandt A, Lenhof HP, Wesse T, Franke A, Meese E, Keller A. Integrated quantitative proteomic and transcriptomic analysis of lung tumor and control tissue: a lung cancer showcase. Oncotarget. 2016; 7:14857-70. https://doi.org/10.18632/oncotarget.7562.
62. Tian ZQ, Li ZH, Wen SW, Zhang YF, Li Y, Cheng JG, Wang GY. Identification of Commonly Dysregulated Genes in Non-small-cell Lung Cancer by Integrated Analysis of Microarray Data and qRT-PCR Validation. Lung. 2015; 193:583-92. https://doi.org/10.1007/s00408-015-9726-6.
63. Yoo SH, Park YS, Kim HR, Sung SW, Kim JH, Shim YS, Lee SD, Choi YL, Kim MK, Chung DH. Expression of caveolin-1 is associated with poor prognosis of patients with squamous cell carcinoma of the lung. Lung cancer. 2003; 42:195-202. https://doi.org/10.1016/S0169-5002(03)00287-3.
64. Ho CC, Kuo SH, Huang PH, Huang HY, Yang CH, Yang PC. Caveolin-1 expression is significantly associated with drug resistance and poor prognosis in advanced non-small cell lung cancer patients treated with gemcitabine-based chemotherapy. Lung cancer. 2008; 59:105-10. https://doi.org/10.1016/j.lungcan.2007.07.024.
65. Han F, Zhang J, Shao JC, Yi XH. Caveolin-1 promotes an invasive phenotype and predicts poor prognosis in large cell lung carcinoma. Pathology Research and Practice. 2014; 210:514-20. https://doi.org/10.1016/j.prp.2014.04.010.
66. Liu CX, Zhang FQ, Li TT, Lu M, Wang LF, Yue WH, Zhang D. MirSNP, a database of polymorphisms altering miRNA target sites, identifies miRNA-related SNPs in GWAS SNPs and eQTLs. Bmc Genomics. 2012; 13:661. https://doi.org/10.1186/1471-2164-13-661.
67. Gong J, Tong Y, Zhang HM, Wang K, Hu T, Shan G, Sun J, Guo AY. Genome-Wide Identification of SNPs in MicroRNA Genes and the SNP Effects on MicroRNA Target Binding and Biogenesis. Human mutation. 2012; 33:254-63. https://doi.org/10.1002/humu.21641.
68. Bhattacharya A, Ziebarth JD, Cui Y. PolymiRTS Database 3.0: linking polymorphisms in microRNAs and their target sites with human diseases and biological pathways. Nucleic acids research. 2014; 42:D86-D91. https://doi.org/10.1093/nar/gkt1028.
69. Xu ZL, Taylor JA. SNPinfo: integrating GWAS and candidate gene information into functional SNP selection for genetic association studies. Nucleic acids research. 2009; 37:W600-W5. https://doi.org/10.1093/nar/gkp290.
70. Edgar R, Domrachev M, Lash AE. Gene Expression Omnibus: NCBI gene expression and hybridization array data repository. Nucleic acids research. 2002; 30:207-10. https://doi.org/10.1093/Nar/30.1.207.
71. Barrett T, Wilhite SE, Ledoux P, Evangelista C, Kim IF, Tomashevsky M, Marshall KA, Phillippy KH, Sherman PM, Holko M, Yefanov A, Lee H, Zhang NG, et al. NCBI GEO: archive for functional genomics data sets-update. Nucleic acids research. 2013; 41:D991-D5. https://doi.org/10.1093/nar/gks1193.
72. Li Z, Zhang Z, He Z, Tang W, Li T, Zeng Z, He L, Shi Y. A partition-ligation-combination-subdivision EM algorithm for haplotype inference with multiallelic markers: update of the SHEsis (http://analysis.bio-x.cn). Cell Research. 2009; 19:519-23.
73. Shi YY, He L. SHEsis, a powerful software platform for analyses of linkage disequilibrium, haplotype construction, and genetic association at polymorphism loci. Cell Res. 2005; 15:97-8.