
INTRODUCTION
Epithelial ovarian cancer (EOC) is a clinically and biologically heterogeneous class of tumors including several major subtypes: serous, mucinous, endometrioid, and clear cell [1]. Although advances in diagnosis and treatment have been achieved in recent decades, age-standardized 5-year survival rate from ovarian cancer for all histological groups combined was around 30–40% in most countries from 1995 to 2009 [2]. It has become the fifth leading cause of cancer death in women in the U.S. In 2017, it is estimated that 22,440 new cases of ovarian cancer will be diagnosed and 14,080 deaths due to ovarian cancer will occur [3].
Previous studies have identified that women with a family history of ovarian cancer are at an increased risk of ovarian cancer [4]. Moreover, certain factors like the type, grade, and stage of the cancer, patients’ age and general health all affect the prognosis of EOC patients. Micro-level studies have also helped to better and more precisely predict the survival of ovarian cancer [5]. Among the studies, however, marital status, which plays an important role in women’s physical and mental health, has rarely been investigated for its effect on the EOC prognosis. In recent years, many researches have demonstrated that marital status independently predicts the survival of gastric cancer [6–8], colorectal cancer [9, 10], liver cancer [11], pancreatic cancer [12], and several other types of cancer [13–16]. Identifying the relationship between the marital status and the survival of EOC would help researchers, doctors, as well as policy makers better cope with the increasing trend of mortality rate.
Therefore, we performed a comprehensive population-based analysis to clarify the prognostic significance of marital status on the survival of EOC patients. We used data in 2004-2012 from the US Surveillance, Epidemiology and End Results (SEER) cancer registry program to investigate the association of overall survival and ovarian cancer-specific survival with marital status and further analyzed the association stratified by stage.
RESULTS
Patient baseline characteristics
A total of 10905 eligible EOC patients were identified during the study period (from 2004 to 2012) in the SEER database. Among them, 5919 (54.28%) were married, 1268 (11.63%) were divorced or separated, 1733 (15.89%) were widowed, and 1985 (18.20%) were never married. Table 1 represents the summary of the subgroups of each variable and the relationship between each variable and marital status. Significant differences were observed in most of the comparisons. Specifically, widowed patients were more likely to be over 80 years (41.32%), while most of the never married patients were less than 60 years (67.41%). White patients accounted for the majority of each marital group, but the proportion of black patients was slightly higher in never married group (13.50%) than that in other groups. The distribution of marital status in diagnosis period of 2004-2008 and 2009-2012 was not statistically different (P=0.0612). Widowed patients were more likely to be diagnosed at stage IV (40.74%), while never married patients had the highest proportion among the four groups of being diagnosed at stage I. Moreover, widowed patients had the lowest proportion of receiving any type of surgery (63.24%), while the married had the highest (90.13%), compared with other groups.
Table 1: Baseline characteristics of EOC patients (n, %)
Characteristic |
Total |
Married |
Divorced/Separated |
Widowed |
Never married |
P value |
|---|---|---|---|---|---|---|
Marital status |
10905(100.00) |
5919(54.28) |
1268(11.63) |
1733(15.89) |
1985(18.20) |
|
Age |
<0.0001 |
|||||
<60 |
5065(46.45) |
2994(50.58) |
595(46.92) |
138(7.96) |
1338(67.41) |
|
60-69 |
2707(24.82) |
1648(27.84) |
371(29.26) |
311(17.95) |
377(18.99) |
|
70-79 |
1882(17.26) |
925(15.63) |
225(17.74) |
568(32.78) |
164(8.26) |
|
≥80 |
1251(11.47) |
352(5.95) |
77(6.07) |
716(41.32) |
106(5.34) |
|
Race |
<0.0001 |
|||||
White |
8956(82.13) |
5021(84.83) |
1024(80.76) |
1404(81.02) |
1507(75.92) |
|
Black |
846(7.76) |
267(4.51) |
144(11.36) |
167(9.64) |
268(13.50) |
|
Others |
1103(10.11) |
631(10.66) |
100(7.89) |
162(9.35) |
210(10.58) |
|
Diagnosis year |
0.0612 |
|||||
2004-2008 |
5709(52.35) |
3076(51.97) |
670(52.84) |
954(55.05) |
1009(50.83) |
|
2009-2012 |
5196(47.65) |
2843(48.03) |
598(47.16) |
779(44.95) |
976(49.17) |
|
Grade |
<0.0001 |
|||||
I |
732(6.71) |
415(7.01) |
57(4.50) |
58(3.35) |
202(10.18) |
|
II |
1365(12.52) |
776(13.11) |
148(11.67) |
145(8.37) |
296(14.91) |
|
III |
3751(34.40) |
2133(36.04) |
468(36.91) |
516(29.77) |
634(31.94) |
|
IV |
1966(18.03) |
1148(19.40) |
240(18.93) |
252(14.54) |
326(16.42) |
|
Unknown |
3091(28.34) |
1447(24.45) |
355(28.00) |
762(43.97) |
527(26.55) |
|
TNM stage |
<0.0001 |
|||||
I |
2512(23.04) |
1421(24.01) |
249(19.64) |
244(14.08) |
598(30.13) |
|
II |
992(9.10) |
565(9.55) |
106(8.36) |
137(7.91) |
184(9.27) |
|
III |
4290(39.34) |
2452(41.43) |
503(39.67) |
646(37.28) |
689(34.71) |
|
IV |
3111(28.53) |
1481(25.02) |
410(32.33) |
706(40.74) |
514(25.89) |
|
Histological type |
<0.0001 |
|||||
Serous |
5544(50.84) |
3182(53.76) |
702(55.36) |
803(46.34) |
857(43.17) |
|
Mucinous |
604(5.54) |
310(5.24) |
73(5.76) |
64(3.69) |
157(7.91) |
|
Clear-cell |
780(7.15) |
446(7.54) |
75(5.91) |
62(3.58) |
197(9.92) |
|
Endometrioid |
1162(10.66) |
657(11.10) |
116(9.15) |
109(6.29) |
280(14.11) |
|
Others |
2815(25.81) |
1324(22.37) |
302(23.82) |
695(40.10) |
494(24.89) |
|
Surgery |
<0.0001 |
|||||
No |
1707(15.65) |
584(9.87) |
206(16.25) |
637(36.76) |
280(14.11) |
|
Yes |
9198(84.35) |
5335(90.13) |
1062(83.75) |
1096(63.24) |
1705(85.89) |
Effect of marital status on overall and cancer-specific survival
The results of Kaplan-Meier tests and multivariate Cox analyses of the effect of marital status on OS and EOCSS were shown in Table 2 and Table 3, respectively. The 5-year OS rate was 51.11% for the married, 39.30% for the divorced/separated, 51.28% for the never married, and 25.40% for the widowed (log-rank test P<0.0001) (Figure 1). After adjusting for other confounding factors with multivariate Cox regression, marital status was found to be an independent predictor of OS. Divorced/separated (HR=1.21, 95%CI: 1.11, 1.31), widowed (HR=1.12, 95%CI: 1.04, 1.20), and never married (HR=1.11, 95%CI: 1.03, 1.19) patients had an increased risk of mortality compared with married patients. In terms of EOCSS, the 5-year EOCSS rate was 53.72% for married patients, 43.42% for divorced/separated patients, 29.81% for widowed, and 54.02% for never married patients (log-rank test P<0.0001) (Figure 2). Similarly, after adjusting for all covariates, marital status was still identified as significantly associated with the EOCSS. Divorced/separated (HR=1.15, 95%CI: 1.06, 1.26), widowed (HR=1.11, 95%CI: 1.03, 1.20), and never married (HR=1.10, 95%CI: 1.02, 1.19) patients had an increased risk of EOC-specific mortality compared with married patients.
Table 2: Univariate and multivariate analyses of overall survival (OS)
Variables |
5-year OS (%) |
Univariate analysis |
Multivariate analysis |
||
|---|---|---|---|---|---|
Log-rank |
P |
HR(95%CI) |
P |
||
Marital status |
606.08 |
<0.0001 |
|||
Married |
51.11 |
Ref. |
|||
Divorced/separated |
39.30 |
1.21(1.11, 1.31) |
<0.0001 |
||
Widowed |
25.40 |
1.12(1.04, 1.20) |
0.0040 |
||
Never married |
51.28 |
1.11(1.03, 1.19) |
0.0070 |
||
Age |
1851.17 |
<0.0001 |
|||
<60 |
59.23 |
Ref. |
|||
60-69 |
44.94 |
1.19(1.11, 1.27) |
<0.0001 |
||
70-79 |
31.40 |
1.48(1.38, 1.60) |
<0.0001 |
||
≥80 |
14.29 |
2.11(1.93, 2.31) |
<0.0001 |
||
Race |
98.70 |
<0.0001 |
|||
White |
45.83 |
Ref. |
|||
Black |
33.34 |
1.20(1.10, 1.31) |
<0.0001 |
||
Others |
53.51 |
0.97(0.88, 1.06) |
0.4693 |
||
Diagnosis year |
6.68 |
0.0098 |
|||
2004-2008 |
44.86 |
Ref. |
|||
2009-2012 |
45.57 |
0.94(0.89, 0.99) |
0.0180 |
||
Grade |
1121.83 |
<0.0001 |
|||
I |
84.75 |
Ref. |
|||
II |
67.33 |
1.47(1.20, 1.80) |
0.0002 |
||
III |
43.17 |
1.78(1.47, 2.15) |
<0.0001 |
||
IV |
44.92 |
1.63(1.34, 1.99) |
<0.0001 |
||
Unknown |
30.12 |
1.65(1.36, 2.01) |
<0.0001 |
||
TNM stage |
3099.93 |
<0.0001 |
|||
I |
86.11 |
Ref. |
|||
II |
67.00 |
2.56(2.20, 2.97) |
<0.0001 |
||
III |
37.26 |
5.45(4.83, 6.14) |
<0.0001 |
||
IV |
18.26 |
7.25(6.41, 8.21) |
<0.0001 |
||
Histological type |
1140.85 |
<0.0001 |
|||
Serous |
40.09 |
Ref. |
|||
Mucinous |
68.05 |
1.71(1.46, 1.99) |
<0.0001 |
||
Clear-cell |
64.33 |
1.39(1.22, 1.58) |
<0.0001 |
||
Endometrioid |
81.94 |
0.66(0.57, 0.76) |
<0.0001 |
||
Others |
31.65 |
1.09(1.02, 1.16) |
0.0105 |
||
Surgery |
4068.36 |
<0.0001 |
|||
No |
7.03 |
Ref. |
|||
Yes |
52.81 |
0.38(0.35, 0.41) |
<0.0001 |
||
Table 3: Univariate and multivariate analyses of epithelial ovarian cancer-specific survival (EOCSS)
Variables |
5-year CSS (%) |
Univariate analysis |
Multivariate analysis |
||
|---|---|---|---|---|---|
Log-rank |
P |
HR(95%CI) |
P |
||
Marital status |
483.44 |
<0.0001 |
|||
Married |
53.72 |
Ref. |
|||
Divorced/separated |
43.42 |
1.15(1.06, 1.26) |
0.0009 |
||
Widowed |
29.81 |
1.11(1.03, 1.20) |
0.0087 |
||
Never married |
54.02 |
1.10(1.02, 1.19) |
0.0163 |
||
Age |
1431.58 |
<0.0001 |
|||
<60 |
61.17 |
Ref. |
|||
60-69 |
47.70 |
1.13(1.06, 1.22) |
0.0005 |
||
70-79 |
35.83 |
1.35(1.24, 1.46) |
<0.0001 |
||
≥80 |
18.85 |
1.82(1.65, 2.00) |
<0.0001 |
||
Race |
84.07 |
<0.0001 |
|||
White |
48.88 |
Ref. |
|||
Black |
36.98 |
1.14(1.04, 1.25) |
0.0064 |
||
Others |
57.63 |
0.93(0.84, 1.03) |
0.1497 |
||
Diagnosis year |
6.33 |
0.0119 |
|||
2004-2008 |
48.06 |
Ref. |
|||
2009-2012 |
49.22 |
0.93(0.88, 0.99) |
0.0165 |
||
Grade |
1095.98 |
<0.0001 |
|||
I |
88.01 |
Ref. |
|||
II |
71.57 |
1.53(1.22, 1.92) |
0.0002 |
||
III |
46.18 |
1.91(1.54, 2.37) |
<0.0001 |
||
IV |
47.42 |
1.76(1.41, 2.20) |
<0.0001 |
||
Unknown |
33.12 |
1.77(1.42, 2.21) |
<0.0001 |
||
TNM stage |
3104.52 |
<0.0001 |
|||
I |
89.74 |
Ref. |
|||
II |
72.00 |
3.08(2.59, 3.65) |
<0.0001 |
||
III |
39.93 |
7.23(6.29, 8.31) |
<0.0001 |
||
IV |
20.35 |
9.67(8.38,11.15) |
<0.0001 |
||
Histological type |
1131.21 |
<0.0001 |
|||
Serous |
42.97 |
Ref. |
|||
Mucinous |
71.14 |
1.78(1.51, 2.10) |
<0.0001 |
||
Clear-cell |
67.74 |
1.45(1.26, 1.66) |
<0.0001 |
||
Endometrioid |
86.11 |
0.58(0.50, 0.69) |
<0.0001 |
||
Others |
34.73 |
1.10(1.03, 1.17) |
0.0068 |
||
Surgery |
3847.60 |
<0.0001 |
|||
No |
8.59 |
Ref. |
|||
Yes |
55.99 |
0.36(0.33, 0.39) |
<0.0001 |
||
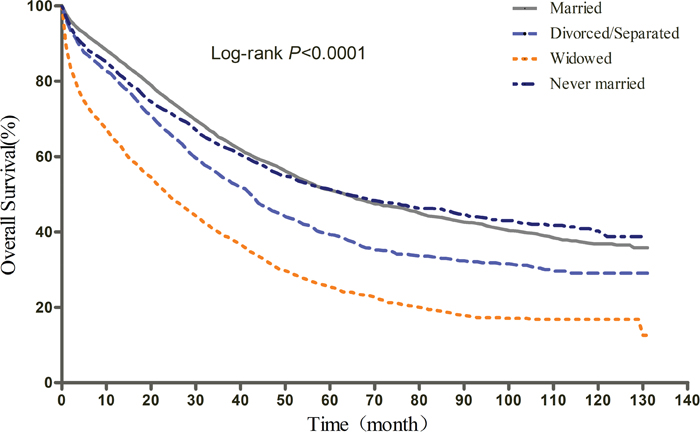
Figure 1: Kaplan-Meier curves of the effect of marital status on overall survival (OS).
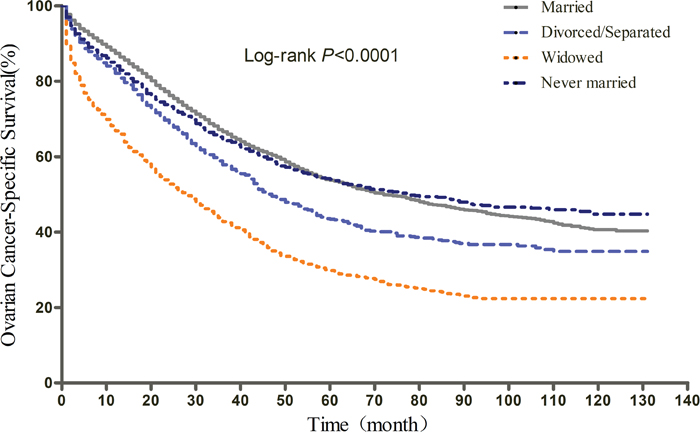
Figure 2: Kaplan-Meier curves of the effect of marital status on epithelial ovarian cancer-specific survival (EOCSS).
Besides, we found that the hazard ratio increased with the growth of age; black patients were associated with poorer OS and EOCSS; compared with the patients with the histological type of serous, patients with mucinous and clear-cell cancer had increased risk of overall and EOC-specific mortality, while patients with endometroid cancer had reduced risk of the both; the hazard ratio increased as the TNM stage at diagnosis advanced; as expected, patients who underwent surgery had better prognosis than that of the ones who did not.
Subgroup analyses of patients stratified by TNM stage
We further explored the effect of marital status on OS and EOCSS, stratified by TNM stage. The stage-specific survival curves of the OS and EOCSS of different marital status were shown in Figure 3 and Figure 4, respectively. The results of stage-stratified Cox regression were summarized in Table 4 for OS and Table 5 for EOCSS.
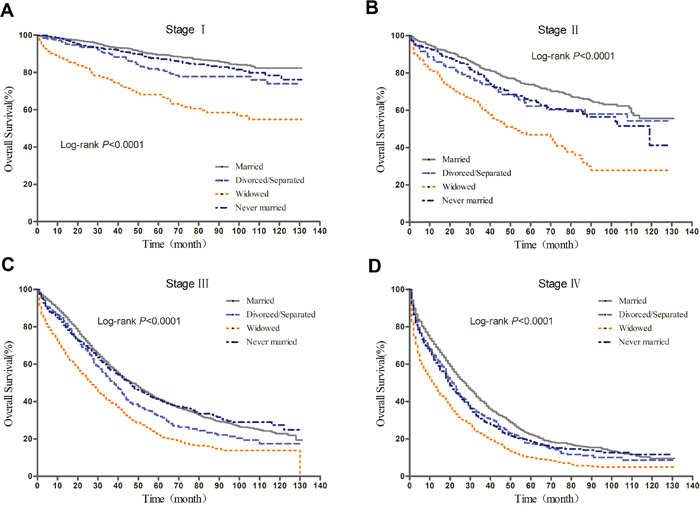
Figure 3: Kaplan-Meier curves of the effect of marital status on OS for all patients stratified by stage.
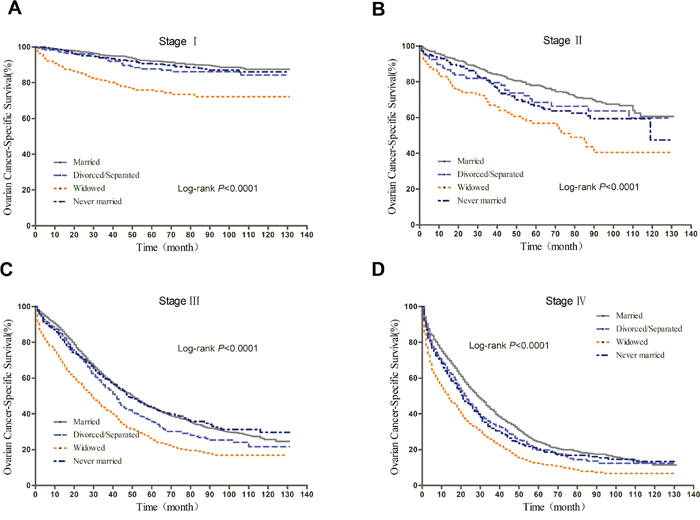
Figure 4: Kaplan-Meier curves of the effect of marital status on EOCSS for all patients stratified by stage.
Table 4: Subgroup analyses stratified by TNM stage for all EOC patients (OS)
Stage I |
Stage II |
Stage III |
Stage IV |
|
|---|---|---|---|---|
Marital status |
||||
Married |
Ref. |
Ref. |
Ref. |
Ref. |
Divorced/separated |
1.56(1.12, 2.18) a |
1.07(0.75, 1.54) |
1.21(1.08, 1.37)a |
1.13(1.00, 1.28) |
Widowed |
1.52(1.11, 2.08)a |
1.38(1.01, 1.87)b |
1.13(1.01, 1.27)b |
1.07(0.96, 1.20) |
Never married |
1.19(0.91, 1.57) |
1.54(1.15, 2.06)a |
1.04(0.93, 1.16) |
1.11(0.99, 1.25) |
Age |
||||
<60 |
Ref. |
Ref. |
Ref. |
Ref. |
60-69 |
1.06(0.79, 1.43) |
1.05(0.78, 1.43) |
1.21(1.09, 1.33)a |
1.12(1.00, 1.24)b |
70-79 |
2.37(1.75, 3.22)a |
2.10(1.53, 2.88)a |
1.59(1.43, 1.78)a |
1.19(1.06, 1.34)a |
≥80 |
5.03(3.56, 7.10)a |
3.54(2.51, 4.99)a |
2.12(1.84, 2.43)a |
1.62(1.41, 1.86)a |
Race |
||||
White |
Ref. |
Ref. |
Ref. |
Ref. |
Black |
1.26(0.88, 1.80) |
1.43(0.97, 2.09) |
1.20(1.04, 1.38)b |
1.07(0.94, 1.22) |
Others |
0.78(0.56, 1.10) |
0.84(0.56, 1.25) |
0.99(0.86, 1.13) |
1.03(0.89, 1.18) |
Diagnosis year |
||||
2004-2008 |
Ref. |
Ref. |
Ref. |
Ref. |
2009-2012 |
0.88(0.69, 1.11) |
1.02(0.81, 1.30) |
0.92(0.85, 1.00) |
0.96(0.88, 1.04) |
Grade |
||||
I |
Ref. |
Ref. |
Ref. |
Ref. |
II |
1.46(1.00, 2.13) |
1.17(0.66, 2.08) |
1.51(1.08, 2.11)b |
1.38(0.87, 2.17) |
III |
1.74(1.18, 2.55)a |
1.60(0.92, 2.77) |
1.90(1.39, 2.62)a |
1.32(0.86, 2.02) |
IV |
1.56(0.98, 2.48) |
1.22(0.67, 2.21) |
1.76(1.28, 2.44)a |
1.26(0.81, 1.95) |
Unknown |
1.66(1.12, 2.46)b |
1.66(0.93, 2.97) |
1.84(1.33, 2.55)a |
1.21(0.79, 1.86) |
Histological type |
||||
Serous |
Ref. |
Ref. |
Ref. |
Ref. |
Mucinous |
0.94(0.66, 1.34) |
1.05(0.60, 1.84) |
2.50(1.94, 3.22)a |
2.10(1.62, 2.72)a |
Clear-cell |
1.09(0.81, 1.48) |
1.16(0.77, 1.76) |
1.59(1.31, 1.94)a |
1.55(1.20, 2.00)a |
Endometrioid |
0.56(0.40, 0.78)a |
0.68(0.47, 0.98)b |
0.50(0.39, 0.64)a |
0.95(0.72, 1.26) |
Others |
0.76(0.56, 1.04) |
1.21(0.93, 1.58) |
1.09(0.99, 1.21) |
1.13(1.03, 1.24)b |
Surgery |
||||
Yes |
Ref. |
Ref. |
Ref. |
Ref. |
No |
0.17(0.11, 0.25)a |
0.22(0.15, 0.34)a |
0.34(0.30, 0.40)a |
0.40(0.36, 0.45)a |
a: p<0.01; b: p <0.05.
Table 5: Subgroup analyses stratified by TNM stage for all EOC patients (EOCSS)
Stage I |
Stage II |
Stage III |
Stage IV |
|
|---|---|---|---|---|
Marital status |
||||
Married |
Ref. |
Ref. |
Ref. |
Ref. |
Divorced/separated |
1.35(0.89, 2.05) |
1.01(0.68, 1.51) |
1.16(1.02, 1.31)b |
1.12(0.99, 1.27) |
Widowed |
1.82(1.24, 2.68)a |
1.38(0.97, 1.95) |
1.13(1.00, 1.27)b |
1.08(0.96, 1.21) |
Never married |
1.09(0.78, 1.50) |
1.60(1.17, 2.19)a |
1.02(0.91, 1.15) |
1.13(1.00, 1.27)b |
Age |
||||
<60 |
Ref. |
Ref. |
Ref. |
Ref. |
60-69 |
0.72(0.50, 1.05) |
0.98(0.70, 1.36) |
1.18(1.06, 1.30)a |
1.10(0.99, 1.23) |
70-79 |
1.67(1.15, 2.43)a |
1.88(1.33, 2.66)a |
1.48(1.32, 1.66)a |
1.14(1.01, 1.29)b |
≥80 |
2.53(1.61, 3.95)a |
2.31(1.56, 3.43)a |
1.97(1.70, 2.28)a |
1.51(1.31, 1.74)a |
Race |
||||
White |
Ref. |
Ref. |
Ref. |
Ref. |
Black |
1.03(0.65, 1.63) |
1.44(0.96, 2.16) |
1.17(1.00, 1.35)b |
1.02(0.89, 1.16) |
Others |
0.76(0.51, 1.14) |
0.75(0.48, 1.18) |
0.95(0.82, 1.09) |
0.98(0.84, 1.13) |
Diagnosis year |
||||
2004-2008 |
Ref. |
Ref. |
Ref. |
Ref. |
2009-2012 |
0.79(0.60, 1.04) |
0.99(0.76, 1.28) |
0.93(0.86, 1.01) |
0.95(0.88, 1.04) |
Grade |
||||
I |
Ref. |
Ref. |
Ref. |
Ref. |
II |
1.58(0.96, 2.60) |
1.21(0.61, 2.38) |
1.46(1.02, 2.07)b |
1.42(0.88, 2.28) |
III |
2.31(1.42, 3.76)a |
1.87(0.97, 3.62) |
1.91(1.37, 2.65)a |
1.33(0.85, 2.07) |
IV |
2.09(1.18, 3.69)b |
1.47(0.73, 2.96) |
1.78(1.27, 2.49)a |
1.28(0.81, 2.01) |
Unknown |
1.86(1.13, 3.07)b |
1.76(0.89, 3.50) |
1.88(1.34, 2.63)a |
1.22(0.78, 1.91) |
Histological type |
||||
Serous |
Ref. |
Ref. |
Ref. |
Ref. |
Mucinous |
0.92(0.60, 1.41) |
1.30(0.71, 2.37) |
2.55(1.96, 3.32)a |
1.99(1.52, 2.61)a |
Clear-cell |
1.07(0.75, 1.51) |
1.36(0.88, 2.12) |
1.60(1.31, 1.97)a |
1.55(1.19, 2.01)a |
Endometrioid |
0.42(0.27, 0.65)a |
0.64(0.41, 0.98)b |
0.49(0.38, 0.63)a |
0.88(0.65, 1.19) |
Others |
0.72(0.50, 1.04) |
1.33(0.99, 1.77) |
1.11(1.00, 1.23) |
1.12(1.01, 1.23)b |
Surgery |
||||
Yes |
Ref. |
Ref. |
Ref. |
Ref. |
No |
0.11(0.07, 0.17)a |
0.16(0.11, 0.26)a |
0.34(0.29, 0.39)a |
0.39(0.35, 0.44)a |
a: p <0.01; b: p <0.05.
After adjusting for other covariates in Cox regression, patients with different marital status at stage IV showed similar risk of all-cause mortality; widowed patients had greater all-cause mortality risk than married ones at stage I, II, and III; divorced/separated showed prognostic disadvantage at stage I and III, while never married patients only at stage II. For EOC-specific survival, never married patients had poorer prognosis at stage II and IV; widowed patients showed disadvantage at stage I and III; while divorced/separated had greater cancer-specific mortality risk at stage III.
TNM stage-stratified analyses of patients who underwent surgical procedures
We also explored the effect of marital status on OS and EOCSS, stratified by TNM, in patients who received any type of surgery. The survival curves of the OS and EOCSS of different marital status were shown in Figure 5 and Figure 6, respectively. The results were summarized in Table 6 for OS and Table 7 for EOCSS.
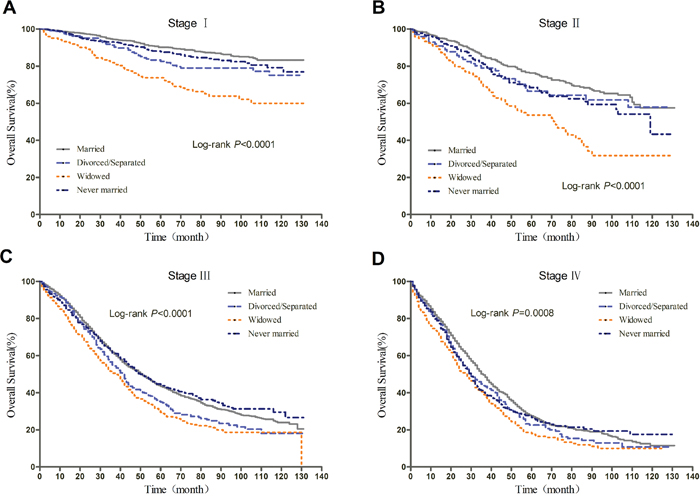
Figure 5: Kaplan-Meier curves of the effect of marital status on OS for surgical patients stratified by stage.
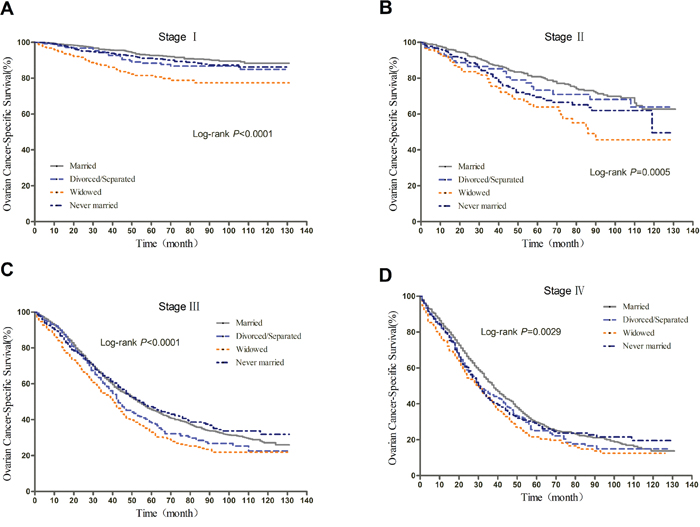
Figure 6: Kaplan-Meier curves of the effect of marital status on EOCSS for surgical patients stratified by stage.
Table 6: Subgroup analyses stratified by TNM stage for surgical patients (OS)
Stage I |
Stage II |
Stage III |
Stage IV |
|
|---|---|---|---|---|
Marital status |
||||
Married |
Ref. |
Ref. |
Ref. |
Ref. |
Divorced/separated |
1.56(1.10, 2.20)b |
1.20(0.81, 1.78) |
1.22(1.07, 1.39)a |
1.15(0.99, 1.35) |
Widowed |
1.49(1.06, 2.10)b |
1.30(0.92, 1.83) |
1.07(0.94, 1.23) |
1.18(1.00, 1.38)b |
Never married |
1.45(1.10, 1.92)a |
1.49(1.09, 2.03)b |
1.03(0.91, 1.16) |
1.15(0.99, 1.33) |
Age |
||||
<60 |
Ref. |
Ref. |
Ref. |
Ref. |
60-69 |
1.10(0.81, 1.50) |
1.10(0.80, 1.51) |
1.24(1.12, 1.37)a |
1.14(1.01, 1.30)b |
70-79 |
2.49(1.80, 3.44)a |
2.06(1.47, 2.88)a |
1.66(1.48, 1.87)a |
1.20(1.03, 1.39)b |
≥80 |
5.13(3.52, 7.47)a |
4.43(3.05, 6.43)a |
2.15(1.81, 2.55)a |
1.57(1.26, 1.94)a |
Race |
||||
White |
Ref. |
Ref. |
Ref. |
Ref. |
Black |
1.32(0.89, 1.96) |
2.13(1.39, 3.25)a |
1.21(1.03, 1.43)b |
1.11(0.93, 1.33) |
Others |
0.80(0.56, 1.14) |
0.82(0.54, 1.26) |
1.02(0.88, 1.19) |
1.01(0.85, 1.21) |
Diagnosis year |
||||
2004-2008 |
Ref. |
Ref. |
Ref. |
Ref. |
2009-2012 |
0.84(0.65, 1.08) |
1.19(0.92, 1.56) |
0.92(0.84, 1.00) |
0.94(0.84, 1.05) |
Grade |
||||
I |
Ref. |
Ref. |
Ref. |
Ref. |
II |
1.41(0.96, 2.06) |
1.30(0.73, 2.32) |
1.46(1.04, 2.05)b |
1.28(0.79, 2.09) |
III |
1.70(1.15, 2.51)a |
1.65(0.95, 2.89) |
1.83(1.33, 2.51)a |
1.23(0.78, 1.95) |
IV |
1.49(0.93, 2.39) |
1.25(0.68, 2.28) |
1.69(1.22, 2.34)a |
1.23(0.77, 1.97) |
Unknown |
1.56(1.03, 2.36) b |
1.78(0.99, 3.20) |
1.74(1.25, 2.42)a |
1.15(0.72, 1.84) |
Histological type |
||||
Serous |
Ref. |
Ref. |
Ref. |
Ref. |
Mucinous |
0.95(0.66, 1.37) |
1.48(0.86, 2.56) |
2.55(1.94, 3.34)a |
1.97(1.42, 2.74)a |
Clear-cell |
1.14(0.83, 1.55) |
1.18(0.77, 1.79) |
1.54(1.25, 1.89)a |
1.38(1.05, 1.82)b |
Endometrioid |
0.57(0.40, 0.81)a |
0.69(0.47, 1.00) |
0.49(0.38, 0.63)a |
0.87(0.65, 1.17) |
Others |
0.77(0.54, 1.08) |
1.17(0.88, 1.57) |
1.05(0.93, 1.17) |
0.96(0.84, 1.09) |
a<0.01; b<0.05.
Table 7: Subgroup analyses stratified by TNM stage for surgical patients (EOCSS)
Stage I |
Stage II |
Stage III |
Stage IV |
|
|---|---|---|---|---|
Marital status |
||||
Married |
Ref. |
Ref. |
Ref. |
Ref. |
Divorced/separated |
1.42(0.92, 2.19) |
1.10(0.70, 1.71) |
1.16(1.02, 1.33)b |
1.15(0.98, 1.35) |
Widowed |
1.81(1.18, 2.78)a |
1.35(0.91, 2.00) |
1.07(0.94, 1.24) |
1.19(1.01, 1.41)b |
Never married |
1.38(0.99, 1.92) |
1.61(1.16, 2.25)a |
1.02(0.90, 1.15) |
1.16(0.99, 1.35) |
Age |
||||
<60 |
Ref. |
Ref. |
Ref. |
Ref. |
60-69 |
0.76(0.52, 1.12) |
1.04(0.74, 1.47) |
1.21(1.09, 1.34)a |
1.13(0.99, 1.29) |
70-79 |
1.69(1.13, 2.53)b |
1.86(1.29, 2.70)a |
1.55(1.37, 1.75)a |
1.13(0.97, 1.32) |
≥80 |
2.25(1.33, 3.82)a |
2.66(1.69, 4.18)a |
1.99(1.67, 2.38)a |
1.44(1.15, 1.81)a |
Race |
||||
White |
Ref. |
Ref. |
Ref. |
Ref. |
Black |
1.15(0.69, 1.92) |
2.12(1.35, 3.34)a |
1.17(0.99, 1.40) |
1.11(0.92, 1.34) |
Others |
0.76(0.50, 1.16) |
0.70(0.43, 1.15) |
0.98(0.84, 1.15) |
0.92(0.76, 1.11) |
Diagnosis year |
||||
2004-2008 |
Ref. |
Ref. |
Ref. |
Ref. |
2009-2012 |
0.76(0.57, 1.03) |
1.14(0.85, 1.53) |
0.92(0.84, 1.01) |
0.94(0.84, 1.05) |
Grade |
||||
I |
Ref. |
Ref. |
Ref. |
Ref. |
II |
1.52(0.92, 2.52) |
1.31(0.66, 2.61) |
1.41(0.99, 2.00) |
1.33(0.80, 2.21) |
III |
2.29(1.39, 3.77)a |
1.93(0.99, 3.76) |
1.83(1.31, 2.55)a |
1.25(0.77, 2.02) |
IV |
2.00(1.12, 3.57)b |
1.51(0.74, 3.07) |
1.70(1.22, 2.39)a |
1.27(0.78, 2.07) |
Unknown |
1.70(1.00, 2.88) |
1.92(0.96, 3.83) |
1.77(1.26, 2.50)a |
1.16(0.71, 1.90) |
Histological type |
||||
Serous |
Ref. |
Ref. |
Ref. |
Ref. |
Mucinous |
0.93(0.60, 1.45) |
1.79(0.99, 3.23) |
2.57(1.94, 3.40)a |
1.86(1.31, 2.63)a |
Clear-cell |
1.10(0.77, 1.58) |
1.41(0.90, 2.20) |
1.54(1.25, 1.91)a |
1.41(1.06, 1.88)b |
Endometrioid |
0.43(0.27, 0.67)a |
0.64(0.42, 1.00)b |
0.48(0.37, 0.62)a |
0.81(0.59, 1.11) |
Others |
0.68(0.45, 1.03) |
1.29(0.93, 1.77) |
1.07(0.95, 1.20) |
0.95(0.82, 1.09) |
a: p <0.01; b: p <0.05.
For patients at Stage I, all the three unmarried groups had poorer prognosis when compared with the married group; additionally, never married patients at stage II, divorced/separated patients at stage III, and widowed patients at stage IV were identified to have greater all-cause mortality risk than married patients. In the context of EOCSS, widowed patients at stage I and IV, never married patients at stage II, and divorced/separated patients at stage III were discovered in the multivariate Cox regression to have survival disadvantage over married patients.
DISCUSSION
In this study, we found that unmarried patients, including divorced/separated, widowed and never married, were at significantly greater risk of mortality after diagnosis of EOC. After adjusting for demographic factors, clinical characteristics, and treatment, complete marriage was still associated with a reduction of the risk of death. When we analyzed the effect of marital status on OS and EOCSS stratified by stage, in overall patients and patients having surgery, the effect differed according to different conditions. Moreover, the results showed that widowed patients had the highest proportion of being diagnosed at advanced stage and the lowest proportion of receiving surgical treatment.
Though most of the findings of this study are consistent with the findings of previous observational studies conducted on other types of cancer [8, 12, 17, 18], that unmarried patients had survival disadvantage compared with married patients, the significance of this study is that we analyzed the effect of marital status on the OS and EOCSS according to different stages and repeated the analyses for patients who underwent surgery, which had never been investigated for ovarian cancer before.
Moreover, contrary to the statement that married patients are more likely to be diagnosed at early stage [7, 9], we found that the never married patients had the highest proportion of being diagnosed at stage I (30.31%) and the second highest proportion of receiving surgical treatment. What is astounding is that the never married patients had the highest 5-year overall survival and cancer-specific survival, slightly higher than the married ones. The phenomenon may be explained by several reasons. The first is that the never married group of this study included the single, unmarried or domestic partner (same sex or opposite sex or unregistered), which decreased the proportion of truly unmarried patients in that group and made the results underestimate the effect of being truly unmarried. Besides, the ones that actually had a partner in this group may enjoy a more satisfied relationship even though they did not have a registered marriage. Second, since that most of the never married group were younger than 60 years (67.41%), an age of sufficient vigilance of any sign of disease, it was reasonable that they visited doctors and detected the tumor earlier. Third, the never married patients had very less possibility of having given birth to a child, thus may pay more attention to their reproductive system. However, after adjusting for other confounders in the multivariate Cox analyses, the never married patients did not show as much advantage as the married ones. They went through nearly the same amount of risk as the widowed patients for all-cause mortality (HR: 1.11 for the never married vs 1.12 for the widowed), and cancer-specific mortality (HR: 1.11 for the never married vs 1.12 for the widowed). It is possible that although some of the patients in the never married group were actually accompanied, the truly single ones may suffer more than the widowed, since widowed patients can obtain the physical and psychological support from their children. Therefore, the similar hazard ratio may be a compromise of the two kinds of situation in the never married group.
There are many existing explanations of the benefit of marriage for patients and they are also suitable for cancer patients. Generally, marriage, which is a main source of social support, can build up the patients’ confidence to conquer the disease, increase the patients’ adherence to the treatment plans and prescriptions of doctors [19], which can directly lead to better prognosis [20–22]. It can also lower the level of depression and anxiety [23, 24]. Female patients may suffer more from the loss of support than male patients. Therefore, policy makers and doctors should make efforts to improve the social support from every aspect for the EOC patients who are in unmarried status.
The SEER database provides us the opportunity to perform large, population-based studies. However, there are several vital limitations that should be addressed and the results of the study should be interpreted with caution. Firstly, this is an observational study and the results cannot be used to conduct causal inferences. We cannot state that the unmarried status lead to the poorer prognosis of patients, but we can conclude that the marital status is associated with, or a predictor of, the EOC prognosis. Further analyses should explore the contribution magnitude, in both direct and indirect way, of the role of marital status to the survival of EOC after diagnosis. Secondly, the limited number of accessible variables may lead to the overestimation of the effect of marital status on the cancer survival. Many other aspects can also play important roles in cancer prognosis such as comorbidity, chemotherapy, and radiotherapy. Thirdly, the follow-up period for some of the patients was so long that the marital status probably changed during the study. This is especially possible for elder patients, who were married at diagnosis but became widowed afterwards. Besides, the quality of marriage was unknown. Therefore, the classification of marriage was nominal and relatively rough.
Despite these limitations, our study indicates that unmarried EOC patients including divorced/separated, widowed, and never married, are at greater risk of overall mortality and EOC-specific mortality. When caring for the unmarried cancer patients, medical staff should be well aware of the potentially poorer prognosis in this population and health care systems should make efforts to provide social support for this population to minimize the risk of death caused by marital status.
MATERIALS AND METHODS
Data source
In this study, we utilized the data obtained from SEER program, which consists of 18 registries covering approximately 28 percent of the US people and routinely collecting information of cancer patients including demographics, primary tumor site, cancer stage, treatment and the follow up information of survival. The database is an authoritative source of information on the incidence and survival of cancer in the United States and has been used by many studies to search prognostic factors associated with various cancers [25–28].
Inclusion criteria
Patients with ICD-O-3 (International Classification of Diseases for Oncology, 3rd edition) site code C56.9 from 2004 to 2012 were extracted from the SEER database. The inclusion criteria were as follows: (a) ICD-O-3 morphology code indicated epithelial ovarian cancer;(b) age at diagnosis was older than 18 years; (c) marital status was known; (d) diagnosed with EOC only or multiple primary cancers but EOC was the first; (e) known survival time and survival time was greater than 0 month; (f) known cause of death;(g) definite AJCC (American Joint Committee on Cancer) stage group, 6th ed TNM stage (h) known surgery information.
Study variables and outcomes
Study variables in this study included age at diagnosis, gender, year of diagnosis, race, histologic type, tumor grade, AJCC TNM stage, and surgical information. The patients were divided into four groups according to age (<60, 60-69,70-79, and ≥80). Marital status was classified as married, divorced or separated, widowed, and never married (including single, unmarried or domestic partner). Race was grouped by white, black, and others (including American Indian/Alaska native, Asian/Pacific Islanders, etc.). We divided the year of diagnosis into 2004-2008 and 2009-2012 to adjust for the survival difference caused by the advances of diagnostic techniques and therapeutic methods with the passage of time. Histologic type was classified as serous, mucinous, clear-cell, endometroid, and other epithelial types. Tumor grade I-IV represented well differentiated, moderately differentiated, poorly differentiated, and undifferentiated, respectively. Surgery was categorized as yes (received any type of surgery) and no (did not receive surgery).
The primary outcomes were overall survival (OS) and epithelial ovarian cancer-specific survival (EOCSS). OS was calculated as the number of month from diagnosis to death due to any cause. EOCSS was calculated as the number of month from diagnosis to death due to EOC. Patients who died from other causes or were still alive at the end of the study period were defined as censored.
Statistical analyses
The baseline characteristics of patients with different marital status were summarized and compared using chi-square test. Kaplan-Meier log-rank test was adopted to compare the difference of OS and EOCSS between subgroups of each variable. Multivariate Cox analysis was conducted to compare the OS and EOCSS of patients with different marital status after adjusting for various covariates. To explore how marital status affected patients diagnosed at the same stage, we further conducted subgroup analyses, stratified by different AJCC TNM stage, in all patients and patients who underwent surgical procedures. All P values were two-sided, and the values less than 0.05 were considered statistically significant. All analyses were performed using SAS version 9.4 (SAS Institute Inc., Cary, NC, USA). All figures were created with Graphpad Prism 5.0.
Author contributions
WX and LM designed the study. WX, LX, and SS analyzed and interpreted the data. WX was a major contributor in writing the manuscript and all authors read and approved the final manuscript.
CONFLICTS OF INTEREST
The authors declare that they have no competing interests.
FUNDING
The research was supported by National Natural Science Foundation of China (Grant Number 81573255).
REFERENCES
1. Al-Niaimi AN, Ahmed M, Petersen CB. Epithelial ovarian cancer. Obstet Gynecol Clin North Am. 2012; 39:269-283.
2. Miller D, Bishop K, Kosary CL, Yu M, Ruhl J, Tatalovich Z, Mariotto A, Lewis DR, Chen HS, Feuer EJ, Cronin KA. SEER Cancer Statistics Review, 1975-2012, National Cancer Institute, Bethesda, MD. http://seer.cancer.gov/csr/1975_2012/. Last accessed June 15, 2017.
3. Siegel RL, Miller KD, Jemal A. Cancer statistics, 2017. CA Cancer J Clin. 2017; 67:7-30.
4. Lee M, Reilly M, Lindstrom LS, Czene K. Differences in survival for patients with familial and sporadic cancer. Int J Cancer. 2017; 140:581-590.
5. Burghaus S, Fasching PA, Haberle L, Rubner M, Buchner K, Blum S, Engel A, Ekici AB, Hartmann A, Hein A, Beckmann MW, Renner SP. Genetic risk factors for ovarian cancer and their role for endometriosis risk. Gynecol Oncol. 2017; 145:142-147.
6. Qiu M, Yang D, Xu R. Impact of marital status on survival of gastric adenocarcinoma patients: results from the Surveillance Epidemiology and End Results (SEER) Database. Sci Rep. 2016; 6:21098.
7. Zhang J, Gan L, Wu Z, Yan S, Liu X, Guo W. The influence of marital status on the stage at diagnosis, treatment, and survival of adult patients with gastric cancer: a population-based study. Oncotarget. 2017; 8:22385-22405. https://doi.org/10.18632/oncotarget.7399.
8. Shi R, Chen Q, Yang Z, Pan G, Zhang Z, Wang WH, Liu S, Zhang D, Jiang D, Liu W. Marital status independently predicts gastric cancer survival after surgical resection—an analysis of the SEER database. Oncotarget. 2016; 7:13228-13235. https://doi.org/10.18632/oncotarget.7107.
9. Li Q, Lu G, Liang L, Li X, Cai S. The influence of marital status on stage at diagnosis and survival of patients with colorectal cancer. Oncotarget. 2015; 6:7339-7347. https://doi.org/10.18632/oncotarget.3129.
10. Wang L, Wilson SE, Stewart DB, Hollenbeak CS. Marital status and colon cancer outcomes in US Surveillance, Epidemiology and End Results registries: does marriage affect cancer survival by gender and stage? Cancer Epidemiol. 2011; 35:417-422.
11. He XK, Lin ZH, Qian Y, Xia D, Jin P, Sun LM. Marital status and survival in patients with primary liver cancer. Oncotarget. 2017; 8:64954-64963. https://doi.org/10.18632/oncotarget.11066.
12. Wang XD, Qian JJ, Bai DS, Li ZN, Jiang GQ, Yao J. Marital status independently predicts pancreatic cancer survival in patients treated with surgical resection: an analysis of the SEER database. Oncotarget. 2016; 7:24880-24887. https://doi.org/10.18632/oncotarget.8467.
13. Chen Z, Pu L, Gao W, Zhang L, Han G, Zhu Q, Li X, Wu J, Wang X. Influence of marital status on the survival of adults with extrahepatic/intrahepatic cholangiocarcinoma. Oncotarget. 2017; 8:28959-28970. https://doi.org/10.18632/oncotarget.16330.
14. Datta GD, Neville BA, Kawachi I, Datta NS, Earle CC. Marital status and survival following bladder cancer. J Epidemiol Community Health. 2009; 63:807-813.
15. Shi X, Zhang TT, Hu WP, Ji QH. Marital status and survival of patients with oral cavity squamous cell carcinoma: a population-based study. Oncotarget. 2017; 8:28526-28543. https://doi.org/10.18632/oncotarget.16095.
16. Li M, Dai CY, Wang YN, Chen T, Wang L, Yang P, Xie D, Mao R, Chen C. Marital status is an independent prognostic factor for tracheal cancer patients: an analysis of the SEER database. Oncotarget. 2016; 7:77152-77162. https://doi.org/10.18632/oncotarget.12809.
17. Aizer AA, Chen MH, Mccarthy EP, Mendu ML, Koo S, Wilhite TJ, Graham PL, Choueiri TK, Hoffman KE, Martin NE. Marital status and survival in patients with cancer. J Clin Oncol. 2013; 31:3869.
18. Wu C, Chen P, Qian JJ, Jin SJ, Yao J, Wang XD, Bai DS, Jiang GQ. Effect of marital status on the survival of patients with hepatocellular carcinoma treated with surgical resection: an analysis of 13,408 patients in the surveillance, epidemiology, and end results (SEER) database. Oncotarget. 2016; 7:79442-79452. https://doi.org/10.18632/oncotarget.12722.
19. Cohen SD, Sharma T, Acquaviva K, Peterson RA, Patel SS, Kimmel PL. Social support and chronic kidney disease: an update. Adv Chronic Kidney Dis. 2007; 14:335-344.
20. Li BD, Brown WA, Ampil FL, Burton GV, Yu H, Mcdonald JC. Patient compliance is critical for equivalent clinical outcomes for breast cancer treated by breast-conservation therapy. Ann Surg. 2000; 231:883-889.
21. Mccowan C, Shearer J, Donnan PT, Dewar JA, Crilly M, Thompson AM, Fahey TP. Cohort study examining tamoxifen adherence and its relationship to mortality in women with breast cancer. Br J Cancer. 2011; 20:327.
22. Pajak TF, Laramore GE, Marcial VA, Fazekas JT, Cooper J, Rubin P, Curran WJ Jr, Davis LW. Elapsed treatment days—a critical item for radiotherapy quality control review in head and neck trials: RTOG report. Int J Radiat Oncol Biol Phys. 1991; 20:13-20.
23. Dimatteo MR, Lepper HS, Croghan TW. Depression is a risk factor for noncompliance with medical treatment: meta-analysis of the effects of anxiety and depression on patient adherence. Arch Intern Med. 2000; 160:2101-2107.
24. Weissman MM, Bland RC, Canino GJ, Faravelli C, Greenwald S, Hwu HG, Joyce PR, Karam EG, Lee CK, Lellouch J. Cross-national epidemiology of major depression and bipolar disorder. JAMA. 1900; 276:293-299.
25. Koay EJ, Teh BS, Paulino AC, Butler EB. A Surveillance, Epidemiology, and End Results analysis of small cell carcinoma of the bladder: epidemiology, prognostic variables, and treatment trends. Cancer. 2011; 117:5325-5333.
26. Khan HM, Gabbidon K, Saxena A, Abdool-Ghany F, Dodge JM 3rd, Lenzmeier T. Disparities in cervical cancer characteristics and survival between White Hispanics and White Non-Hispanic women. J Womens Health. 2016; 25:1052-1058.
27. Lau CS, Zywot A, Mahendraraj K, Chamberlain RS. Gallbladder carcinoma in the United States: a population based clinical outcomes study involving 22,343 patients from the Surveillance, Epidemiology, and End Result Database (1973-2013). 2017; 2017:1532835.
28. Lim YJ, Song C, Kim JS. Improved survival with postoperative radiotherapy in thymic carcinoma: a propensity-matched analysis of Surveillance, Epidemiology, and End Results (SEER) database. Lung Cancer. 2017; 108:161-167.