
INTRODUCTION
Radiotherapy (RT) have been the mainstream technologies for the patients with inoperable oesophageal cancer. Different computed tomography (CT) images may be involved in the process of radiotherapy. Three-dimensional CT (3DCT) is a common positioning technology. In our study, the 3DCT images also known as “fast-CT” images were acquired in a short time. Although they only display the tumor during a certain moment of the breathing cycle [1], the temporal images acquired during 3DCT scanning encompass partial respiration-induced tumor motion information [2].
Oesophageal mobility can arise from peristalsis, respiratory motions, and cardiac action, with the predominant source of motion being respiratory [3]. Improved localization accuracy of the tumor can reduce the effect of radiation on the surrounding normal tissues and improve the therapeutic ratio. However, respiration-induced tumor motion can make target localization challenging [4–6]. Four-dimensional computed tomography (4DCT) is able to subdivide the CT datas acquired in a respiration cycle into a series of time-resolved 3D data [7, 8]. The advent of 4DCT has made the measure of respiration-induced motion of oesophageal mobility possible. Currently, during lung stereotactic body radiation therapy (SBRT), 4DCT is routinely incorporated into the treatment planning to include information regarding not only the range of tumor motion but also the different spatial tumor positions [9]. Regarding the definition of internal target volumes (ITV) according to the International Commission on Radiation Units and Measurements report 62, the internal gross tumor volume (IGTV) incorporating the intrafraction motion of the GTV has been adopted in many studies [2, 10]. In our present study, the relationships of IGTVs (IGTV10 combined from ten 4DCT phases and IGTVMIP and IGTVCBCT) were analysed to explore the motion information included in IGTVs.
Prior to therapy delivery, it is crucial to localize the target volume using online imaging. Currently, cone beam CT (CBCT) is widely used for target verification, treatment planning modification, and image guidance during the delivery of radiation [11, 12]. In terms of online target verification and correction techniques, CBCT can show motion displacement of the GTV in three directions by fusing CBCT images with treatment planning CT scans. And CBCT scans are acquired over a period of several respiratory cycles providing motion information. Recent studies which mainly concentrated on lung tumors have gradually begun to give careful attention to the motion information obtained by CBCT [13–15]. However, comparisons of target volumes for oesophageal cancer are limited in the literatures, therefore it is essential to investigate the variations in motion information between the target volumes derived from 3DCT, 4DCT, and CBCT images for oesophageal tumors.
RESULTS
Variations of volumes
The means and standard deviations (SD) of the volumes of GTV3D, GTV4D50, IGTVMIP, IGTV10, and IGTVCBCT are listed in Table 1. For upper, middle, and distal oesophageal tumors, the variation rule of the target volumes were completely consistent. The IGTV10 was larger than the IGTVMIP and IGTVCBCT (p < 0.001 for both), whereas no significant differences were observed between IGTVCBCT and IGTVMIP (p = 0.344, 0.580, and 0.128, respectively). The volumes of IGTVCBCT and IGTVMIP were also significantly larger than those of GTV3D or GTV4D50 (p < 0.001–0.014), whereas there were no statistically significant differences between the GTV3D and GTV4D50 (p = 0.691, 0.187, and 0.763, respectively).
Table 1: The volume of GTV3D , GTV4D50, IGTVMIP, IGTV10 and IGTVCBCT (Mean ± SD , cm3)
volume |
GTV3D |
GTV4D50 |
IGTVMIP |
IGTV10 |
IGTVCBCT |
|---|---|---|---|---|---|
upper |
11.11 ± 2.86 |
11.18 ± 2.75 |
12.63 ± 2.93 |
13.80 ± 3.20 |
12.77 ± 3.12 |
middle |
27.30 ± 12.46 |
27.74 ± 12.94 |
29.22 ± 12.94 |
33.52 ± 14.75 |
29.40 ± 12.70 |
distal |
21.69 ± 11.88 |
21.78 ± 11.93 |
22.97 ± 12.17 |
27.86 ± 13.62 |
23.89 ± 11.99 |
The volume ratios of GTV3D, GTV4D50, IGTVMIP, and IGTV10 to IGTVCBCT are listed in Table 2. For upper oesophageal tumors, the volume ratios of GTV4D50/IGTVCBCT showed a significant correlation to the 3D direction motion vector (r = –0.756, p = 0.011). However, GTV3D/IGTVCBCT, IGTVMIP/IGTVCBCT, and IGTV10/IGTVCBCT demonstrated no significant correlations to the 3D direction motion vector (p = 0.073–0.439). For middle oesophageal tumors, IGTV10/IGTVCBCT showed a positive significant correlation to the 3D direction motion vector (r = 0.695, p = 0.006), whereas GTV3D/IGTVCBCT, GTV4D50/IGTVCBCT, and IGTVMIP/IGTVCBCT did not (p = 0.091–0.762). For distal oesophageal tumors, no significant correlations were observed between the 3D direction motion vector and the volume ratios of GTV3D, GTV4D50, IGTVMIP, and IGTV10 to IGTVCBCT (p = 0.131–0.921).
Table 2: The volume ratios of GTV3D, GTV4D50, IGTVMIP and IGTV10 to IGTVCBCT (Mean ± SD)
GTV3D/IGTVCBCT |
GTV4D50/IGTVCBCT |
IGTVMIP/IGTVCBCT |
IGTV10/IGTVCBCT |
|
|---|---|---|---|---|
upper |
0.87 ± 0.03 |
0.88 ± 0.05 |
0.99 ± 0.04 |
1.08 ± 0.03 |
middle |
0.92 ± 0.04 |
0.93 ± 0.05 |
0.99 ± 0.04 |
1.14 ± 0.07 |
distal |
0.87 ± 0.11 |
0.89 ± 0.09 |
0.94 ± 0.10 |
1.18 ± 0.07 |
Variations of the target centroid position
The COM coordinates for all GTV or IGTV could be obtained through the TPS. For upper oesophageal tumors, in the AP direction, the centroid coordinates of IGTVCBCT showed significant differences compared to those of GTV3D, GTV4D50, IGTVMIP, and IGTV10 (p = 0.006, 0.013, 0.038, and 0.010, respectively), whereas the target centroid positions at other directions showed no significant differences. For tumors located in the middle thoracic oesophagus, in the AP direction, there were significant differences of the centroid coordinates between IGTVCBCT and GTV3D (p = 0.008), and between IGTVCBCT and IGTV10 (p = 0.046). Further, a significant difference was observed between the centroid position of IGTVCBCT and GTV4D50 (p = 0.027) in the CC direction. For distal oesophageal tumors, variations in the centroid shift of IGTVCBCT and GTV3D, IGTVCBCT and GTV4D50, and IGTVCBCT and IGTVMIP were found only in the LR direction (p = 0.024, 0.017, and 0.042, respectively).
Differences in the inclusion relation
The mean volumetric overestimations or underestimations for GTV3D, IGTVMIP, and IGTVCBCT compared to the IGTV10 are listed in Table 3. Irrespective of the tumor location, the volumetric underestimation percentages of IGTV10 outside IGTVCBCT were larger than those of IGTV10 outside IGTVMIP (p < 0.001–0.011), whereas no significant differences were observed between IGTV10 outside IGTVCBCT and IGTV10 outside GTV3D (p = 0.357–0.943). The mean volumetric overestimations for IGTVCBCT compared with IGTV10 were larger than those of IGTVMIP compared with IGTV10 (p < 0.001–0.023). Similar results were found between IGTVCBCT outside IGTV10 and GTV3D outside IGTV10 (p < 0.001). For tumors located in the middle and distal thoracic oesophagus, the degrees of associations of IGTV10 outside IGTVCBCT demonstrated significant correlations to the 3D direction motion vector (r = 0.540, p = 0.046; r = 0.678, p = 0.031).
Table 3: The volume characteristics for GTV3D, IGTVMIP and IGTVCBCT compared with IGTV10 (Mean ± SD, %)
GTV3D outside IGTV10 |
IGTV10 outside GTV3D |
IGTVMIP outside IGTV10 |
IGTV10 outside IGTVMIP |
IGTVCBCT outside IGTV10 |
IGTV10 outside IGTVCBCT |
|
|---|---|---|---|---|---|---|
upper |
2.80 ± 1.69 |
22.10 ± 3.64 |
5.20 ± 3.01 |
13.10 ± 2.69 |
16.00 ± 4.35 |
22.20 ± 3.82 |
middle |
3.36 ± 2.90 |
21.60 ± 5.24 |
2.43 ± 2.06 |
14.79 ± 3.49 |
11.93 ± 4. |
22.14 ± 2.63 |
distal |
6.20 ± 7.65 |
29.70 ± 12.27 |
1.20 ± 0.42 |
20.70 ± 7.51 |
14.20 ± 6.41 |
26.90 ± 5.92 |
Abbreviations: GTV3D, the gross tumor volumes of three-dimensional computed tomography; GTV4D50, the gross tumor volumes of the end expiration phase of four-dimensional computed tomography; IGTVMIP, the internal gross tumor volumes of the maximum intensity projection of four-dimensional computed tomography; IGTV10, the union of gross tumor volumes from all ten phase images of four-dimensional computed tomography; IGTVCBCT, the internal gross tumor volumes of cone beam computed tomography.
Differences in the MI
The mean values of the MIs between GTV3D and IGTVCBCT, GTV4D50 and IGTVCBCT, IGTVMIP and IGTVCBCT, and IGTV10 and IGTVCBCT are listed in Table 4. The mean MIs ranged from 0.65 to 0.72. The MI values of IGTVMIP relative to IGTVCBCT were similar among the upper, middle, and distal thoracic oesophageal tumors (p = 0.235–0.863).
Table 4: The MIs between between GTV3D and IGTVCBCT, GTV4D50 and IGTVCBCT, IGTVMIP and IGTVCBCT, and IGTV10 and IGTVCBCT (Mean ± SD)
GTV3D-IGTVCBCT |
GTV4D50-IGTVCBCT |
IGTVMIP-IGTVCBCT |
IGTV10-IGTVCBCT |
|
|---|---|---|---|---|
upper |
0.68 ± 0.06 |
0.65 ± 0.05 |
0.69 ± 0.06 |
0.68 ± 0.06 |
middle |
0.72 ± 0.05 |
0.68 ± 0.04 |
0.71 ± 0.03 |
0.70 ± 0.03 |
distal |
0.68 ± 0.06 |
0.67 ± 0.07 |
0.66 ± 0.09 |
0.65 ± 0.08 |
Abbreviations: GTV3D, the gross tumor volumes of three-dimensional computed tomography; GTV4D50, the gross tumor volumes of the end expiration phase of four-dimensional computed tomography; IGTVMIP, the internal gross tumor volumes of the maximum intensity projection of four-dimensional computed tomography; IGTV10, the union of gross tumor volumes from all ten phase images of four-dimensional computed tomography; IGTVCBCT, the internal gross tumor volumes of cone beam computed tomography.
DISCUSSION
Target volume definition is a crucial step during the process of precise radiotherapy. The key to delineate GTV of oesophageal tumor is to define the boundaries of the primary tumor. The boundaries between the oesophagus and peripheral tissues such as the ventricles or descending aorta may be blurred on non-contrast enhanced CT images. Consequently, those problem will cause inaccuracies in the GTV delineation or IGTV construction. However, CE-CT scans can enhance the tumor margin between peripheral tissues, making it easy to determine the range of the tumor. Theoretically, in our study, intravenous contrast agents were used to acquired CE-CT images to improve the margin contrast between tissues and reduce the delineation uncertainty. Few studies have focused on the comparison of target volumes for oesophageal cancer using different CT imaging modalities. Therefore, we investigate the variations in motion information among the target volumes derived from 3DCT, 4DCT, and CBCT images for oesophageal tumors.
4DCT images, which is a novel method of portraying tumor motion, can provide the measure of breathing-induced tumor motion of the internal anatomy of the patient [16]. Previous studies considered that the end expiration phase was the most stable phase [17, 18], and GTV4D50 has been considered the closest measurement to the actual tumor size [19, 20]. Accordingly, the motion information encompassed in GTV4D50 is considered the lowest. In our data, we demonstrated that GTV4D50/IGTVCBCT showed a significant inverse correlation to motion vector for upper oesophageal tumors, indicating an increase in the variation of the IGTVCBCT size with the increasing tumor motion amplitude. This might be due to the GTV4D50 was considered the closest measurement to the actual tumor size, and would thus reflect the actual oesophageal tumor size [20]. In addition, oesophageal mobility can arise from peristalsis and respiratory and cardiac actions. The upper oesophagus passes through the sternal notch and above the left atrium, along with numerous other structures, and is therefore generally very well fixed. Hence, the upper oesophagus has been reported to be the least affected by cardiac action (left atrium) and respiratory motion, with the lowest motion amplitudes (0.16, 0.14, and 0.29 cm in the LR, AP, and CC directions, respectively) [10]. Consequently, GTV4D50 could reflect the actual oesophageal tumor size. However, the CBCT scans are acquired over a period of several respiratory cycles providing sufficient information on respiration motion. Therefore, the motion information encompassed in the IGTVCBCT can be accurately reflected by comparing the variation in volume sizes between IGTVCBCT and GTV4D50. In this study, the volume ratio correlated well with the motion vector, suggesting that IGTVCBCT incorporates much more motion information than GTV4D50 for upper oesophageal tumors.
At present, CE-3DCT was widely used for the positioning of oesophageal cancer as most patients can tolerate it. Generally speaking, margins derived from population-based or site-specific tumor motion information of 4DCT are used to guide the expansion from GTV based on 3DCT to IGTV. However, the crucial premise is that 3DCT does not encompass much more motion information than the GTV from a single phase. Herein, we demonstrated that the ratios of GTV3D/GTV4D50 for the upper, middle, and distal oesophagus approached 1, similar to what has been reported for lung cancer [2, 20]. This result suggests that GTV3D encompasses similar motion information as GTV4D50. Consequently, we considered that IGTVCBCT incorporates much more respiration motion information than GTV3D. Given that the centroid coordinates between GTV4D50 and GTV3D showed no significant difference in any of the three directions (p = 0.204, 0.149, and 0.505, respectively), and the relative high inclusion relations of GTV3D in GTV4D50 and GTV4D50 in GTV3D (0.88 and 0.87, respectively), which demonstrated no significant difference for the whole group (t = 1.525, p = 0.137), 3DCT may be regarded as an alternative when 4DCT images are not or cannot be acquired.
During the course radiotherapy, 3DCT simulation scans were routinely used for patient’s positioning, and CBCT were widely used for target verification and image guidance during the delivery of radiation. As technology advances, the image resolution and scanning range of CBCT has improved. The applications of CBCT are further explored. 3DCT scanning repositioning are usually needful to define the patient’s position repeatability and the necessity of modifying the target during the course of radiotherapy. So we explore the matching of the motion information included in 3DCT and CBCT to realize whether we could utilize CBCT instead of 3DCT to modify the treatment planning. Whether we could delineate IGTVCBCT on CBCT images acquired after times of radiotherapy, and then map IGTVCBCT to first positioned 3DCT directly to modify the treatment planning without the course of 3DCT scanning repositioning, provided that: a) the two target volumes match very well delineated on CBCT images acquired at the first treatment fraction and first positioned 3DCT images; b) the patient’s position repeatability was very perfect during the course of radiotherapy; c) the tumor was obviously shrinked during the course of radiotherapy. We analysed the inclusion relations between GTV3D and IGTV10, and between IGTVCBCT and IGTV10. IGTV10 has been reported to provide the best overall representation of the ‘true’ moving GTV and incorporates the whole tumor respiration motion information envelope throughout the entire breathing cycle, though its delineation is the most time-consuming [10, 21, 22]. Therefore, we regarded IGTV10 as the reference to reflect the differences in motion information contained in the target volumes on different CT modalities. However, in the part of results we found that the proportion of the volumetric overestimations for IGTVCBCT outside IGTV10 were larger than those for GTV3D outside IGTV10. The result did not meet the first premise. Therefore, 3DCT simulation scans are needed for repositioning during the course of radiotherapy.
From the results of the present study, we found no significant difference among the IGTVMIP/IGTVCBCT for upper, middle, and distal oesophageal tumors (F = 2.043, p = 0.147). Meanwhile, no good correlation was observed between the motion vector and IGTVMIP/IGTVCBCT, irrespective of where the tumor was located (r = –0.301, p = 0.398; r = 0.458, p = 0.099; and r = –0.113, p = 0.755, respectively). These results indicated that the tumor motion amplitude had no effect on the variation in IGTVMIP/IGTVCBCT and that the changes in IGTVCBCT and IGTVMIP may have a similar magnitude. Therefore, this suggests that the motion information encompassed in IGTVCBCT was parallel to that of IGTVMIP.
Independent of the tumor location, the percentages of volumetric underestimations or overestimations between IGTV10 and IGTVCBCT were larger than those of IGTV10 and IGTVMIP in the present study. The MIs for IGTVMIP relative to IGTVCBCT were only 0.69, 0.71, and 0.66 for upper, middle and distal thoracic oesophageal tumors, respectively. The main cause of this phenomenon may be the variations in the target centroid position between IGTVMIP and IGTVCBCT. Although for middle and distal oesophageal tumors, the predominant source of motion is respiratory [3]. As a tube-shaped and non-rigid organ in the mediastinum, in addition to peristalsis and respiration-induced movement, motion of the heart and aorta resulting from the cardiac cycle can also result in motion and volume deformation of the oesophagus [3, 23]. Accordingly, respiration-induced movement, and the squashing and stretching of the heart to the esophageal tumors might be factors responsible for the differences in the COM between IGTVMIP and IGTVCBCT in the AP and LR directions. Especially, for middle and distal oesophageal cancer, the effects of the variations in the position and volume of the heart on oesophageal targets cannot be ignored [24]. Of note, similar findings have been observed in lung cancer, as Seppenwoold et al. [25] reported that the target was affected by cardiac action more obviously in the LR direction when the lung tumors were located near the heart. Thus, IGTVCBCT and IGTVMIP encompass similar respiration motion information; however, due to the spatial mismatch of IGTVCBCT and IGTVMIP, the target motion information encompassed in CBCT and MIP images cannot replace each other.
The present study showed that the volume of IGTV10 was larger than IGTVCBCT and, simultaneously, that IGTV10/IGTVCBCT correlated well with the motion vector. These findings demonstrate that the change in IGTV10 was more obvious than the change in IGTVCBCT along with the increase in the tumor motion amplitude. In this study, the volume ratio correlated well with the motion vector, suggesting that IGTV10 incorporates much more motion information than IGTVCBCT. When comparing IGTV sizes, we found that if IGTV10 was chosen as the reference for the standard volume, 22.20%, 22.14%, and 26.90% of IGTV10 volume tumor tissues would not receive irradiation, whereas 16.00%, 11.93%, and 14.20% of the volume IGTVCBCT normal tissues would be inevitably irradiated for upper, middle, and distal oesophageal tumors, respectively. Furthermore, our study showed the correlation of IGTV10 outside IGTVCBCT and the spatial motion vector. This result showed the proportion of IGTV10 outside IGTVCBCT increased as the tumor motion increased. It indicated that the larger the motion amplitude of the tumors, the more motion information of IGTVCBCT would be missed compared to IGTV10. The MI and inclusion relation reflect the translation, deformation, volume change, or rotation of the two selected volumes, which in turn affect the volumetric size, shape, and spatial position [26]. The variations of the target centroid position between IGTV10 and IGTVCBCT may be a factor leading to the volumetric mismatch.
For upper oesophageal tumors, in the AP direction, the centroid coordinates of IGTVCBCT differed from those of IGTV10 in the present study. As the upper oesophagus is generally very well fixed by numerous adjacent structures, it is the least affected by cardiac action and respiratory motion, with the least motion amplitude. Oesophageal mobility can arise from peristalsis, and attention should be paid to the day-to-day oesophageal peristalsis [12], as oesophageal intrafractional tumor position variation during irradiation delivery is one of the geometrical uncertainties that may affect the target centroid position. Oesophageal peristalsis in the AP direction might contribute to spatial position differences, which consequently leads to the differences in the quantity of motion information incorporated in IGTVCBCT and IGTV10. Furthermore, setup errors might have also contributed to the observed difference. Yamashita et al. [12] reported that the setup error was 4 mm (maximum, 11 mm) in the longitudinal direction, 2 mm (maximum, 8 mm) in the lateral direction, and 4 mm (maximum, 13 mm) in the vertical direction.
Other factors that likely contributed to the differences in spatial mismatch and volume size between the two target volumes should also be highlighted. First, free breathing CBCT image reconstruction makes use of every pixel in each projection, resulting in an averaging of the CT numbers across the image set. Accordingly, this image is meant to represent the time-averaged position of the target and results in a CT number averaging effect [15, 27]. However, 4DCT images were a series of time-resolved 3D data. Due to the different image principle of 4DCT and CBCT, it may be one factor to lead the difference of the volume size and volumetric mismatch between two target volumes on different CT images. In addition, variations in the breathing pattern may be another potential reason for the observed differences during the acquisition of 3DCT, 4DCT, and CBCT scans. Clements et al. [15] reported that the sinusoidal patterns represented the ideal clinical scenario. However, in the present study, all CT image acquisitions were acquired during free breathing, without any breathing control, and this is bound to the variations of the target centroid position and volume size , as well as to the low MI between the two selected volumes.
There were some limitations in the present study. Most importantly, it should be noted that intraobserver target delineation error might reduce the accuracy of GTVs delineated on distinct patterns of CT images. To minimize systematic delineation uncertainty, the contouring was performed by a single physician with more than 5 years of experience using a unified standard, despite the fact that contouring the target volume on 10 different phases increases the workload and is time-consuming. Additionally, it is impossible to avoid the impact of registration errors. Boswell et al. [28] reported that the repositioning accuracy of automatic registration in a helical tomotherapy system was sub-millimetre. However, errors in alignment and patient setup displacements still exist, and it is possible that such errors, albeit minor, may have caused variations in the target centroid position and resulted in the low matching between the two target volumes. Nevertheless, despite the limitations in this study, our results can reflect the amount of respiration motion information encompassed in different CT modalities.
MATERIALS AND METHODS
Patient selection and characteristics
Thirty-four patients (19 men and 15 women) with pathologically confirmed oesophageal cancer, scheduled to undergo radiotherapy with 3D-CRT or IMRT, were enrolled between August 2014 and December 2015. The median age was 71 years (range, 41–83 years). Among the 34 patients, 33 and 1 were diagnosed with squamous cell carcinoma and undifferentiated carcinoma, respectively. The primary tumors were located in the upper, middle, and distal oesophagus in 10, 14, and 10 patients, respectively, based on the 7th edition of Esophageal Cancer Staging published in 2009 from the American Joint Committee on Cancer (AJCC) and Union for International Cancer Control (UICC). No patient had been previously treated with thoracic radiotherapy and no patient had poor pulmonary function.
Written informed consent was obtained from all patients before the treatment was initiated. The study was approved by the Institutional Review Board (Shandong Cancer Hospital Affiliated to Shandong University Ethics Committee).
CT data acquisition
All patients were in the vacuum bags while being scanned. After laser alignment, contrast enhanced (CE)-3DCT and CE-4DCT were performed during free breathing using a 16-slice CT scanner (Philips Brilliance Bores CT Inc., Cleveland, OH, USA). The standard acquisition parameters of the CE-3DCT were 120 kV and 200 mA. A total of 45 mL of iodinated contrast medium were infused at a rate of 1.5 mL/s. The CE-3DCT scans were produced per gantry rotation (1 s) and interval (1.8 s) between rotations. The slice thickness of the 3DCT scan was 3 mm. When the CE-3DCT was finished, the CE-4DCT scan was sequentially initiated. The standard acquisition parameters of the CE-4DCT were 120 kV and 400 mA. A total of 55 mL of iodinated contrast medium were infused continuously at a rate of 1.0 mL/s. The CE-4DCT scan was acquired in helical mode with the scanning pitch ranging between 0.09 and 0.15. During the CE-4DCT image acquisition, the respiratory signal was recorded with the Varian real-time position management (RPM) system (Varian Medical Systems, Palo Alto, CA, USA) by tracking the trajectory of the infrared markers placed on the epigastric region of the patient’s abdomen. The resultant signal was sent to the scanner to label a time tag on each image. GE Advantage 4D software (GE Healthcare, Waukesha, WI, USA) was used to sort the reconstructed 4DCT images into 10 respiratory phases according to the phase of the breathing signal based on these tags labelled as 0–90%. Phase 0% denoted the maximum end inspiration, and phase 50% denoted the maximum end expiration. The maximum intensity projection (MIP) images were created from the raw 4DCT data. In the MIP images, each pixel was assigned the highest density value that occurred, taking into account all 10 respiratory phases.
Prior to the first treatment fraction, CE-CBCT scans were acquired using a kilovoltage CBCT scanner (Varian Medical Systems, Palo Alto, CA, USA) with the patient in the treatment position. The patients were aligned according to the skin tattoos by using the in-room laser system. The standard acquisition parameters were 120 kV and 1000 mA. The iodinated contrast medium was infused at a rate of 1.8 mL/s. The scan time was approximately one minute. The Eclipse system included software using a mutual information algorithm for automatic registration from the CE-4DCT and CE-CBCT to CE-3DCT. Finally, all images were transferred to the Eclipse treatment planning system (TPS) (Eclipse 8.6; Varian Medical Systems, Palo Alto, CA) for structure delineation and treatment planning. In our study, the 3DCT images were used for target delineation and treatment planning. 4DCT images were used for target delineation. The CBCT was used for target delineation and verification.
GTV delineation
In all cases, the GTV and/or IGTV contouring were completed by the same clinician, with more than 5 years of experience performing target volume delineation, using the mediastinal window setting. The GTV and/or IGTV for each patient were delineated as follows: (1) the GTV3D and GTV4D50 were delineated on CE-3DCT and CE-4DCT50 images (the end expiration phase of CE-4DCT), respectively; (2) the IGTVMIP and IGTVCBCT were delineated separately on the CE-4DCTMIP (the maximum intensity projection of CE-4DCT) and CE-CBCT datasets, respectively; and (3) the GTVs on each of the 10 respiratory phases of the CE-4DCT images were delineated and combined to produce IGTV10 (Figure 1).
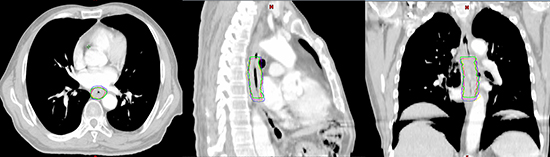
Figure 1: Gross target volume (GTV) or internal GTV (IGTV) formation in one patient: (green), GTV3D; (red), GTV4D50; (purple) IGTVMIP; (blue) IGTV10; (yellow) IGTVCBCT. The figures are the axial, sagittal and coronal view of one patient exhibiting the GTV or IGTVs.
Tumor motion
The centre of mass (COM) coordinates represent the target centroid position. The target centroid position was reflected by the COM coordinates. The COM coordinates for all GTV or IGTV could be obtained through the TPS. The intrafractional displacements of the COM in the x (left-right [LR]), y (anterior-posterior [AP]), and z (cranial-caudal [CC]) directions throughout 10 phases of 4DCT could also be obtained. The maximum tumor displacement in the LR, AP, and CC directions throughout 10 phases of 4DCT were calculated as Δx, Δy, and Δz, respectively. Subsequently, the 3D motion vector of the COM from the 4DCT was calculated according to the following formula: Vector =  .
.
Volume comparisons
The volume, inclusion relation, and matching index (MI) were compared among the GTV (GTV3D and GTV4D50) and IGTV (IGTVMIP, IGTV10, and IGTVCBCT). The percentage of A not included in B [Per (A not in B)] is used to indicate the inclusion relation between two volumes. The target A outside B was represented by Per (A not in B). Assumed volume B was reference for the standard volume irradiated. If the treatment planning was based on volume A, there would be Per (B not in A) of volume B missing irradiation which means the volumetric underestimation and Per (A not in B) of volume A being irradiated unnecessarily which means the volumetric overestimation. The formula is as follows: Per (A not in B) = 1- A∩B/A [21].
The MI was defined as the ratio of the intersection of volume A with volume B divided by the union of A and B, as follows: MI = A∩B/A∪B [26]. The MI indicated translation, deformation, volume change, or rotation of the two selected volumes. The ideal value of the MI is 1; upon any change in size, shape, position, or orientation, the value of MI would be < 1.
Statistical analyses
Statistical analyses were performed using SPSS software (version 19.0; SPSS Inc., Chicago, IL, USA). For all parameters, a normal distribution test (Q-Q plot) was performed. The paired sample t test was used for comparisons of tumor position, volumetric size, MI, and inclusion relation. The degree of associations between continuous variables and the 3D motion vector according to 4DCT was calculated using Pearson’s test. For all analyses, a p value < 0.05 was regarded as significant.
CONCLUSIONS
Our findings indicate that the CBCT images incorporated much more respiration motion information than 3DCT images and the end expiration phase of 4DCT images for upper oesophageal tumors, but less than that of 10 respiratory phases of the 4DCT datasets for middle and distal oesophageal tumor. Simultaneously, CBCT images incorporated similar respiration motion information to MIP images. Nevertheless, the target motion information encompassed in CBCT and MIP images cannot replace each other.
Author contributions
CYH and JBL participated in the study design, contributed to the data collection, and draft the manuscript. WW made important contributions in delineating the oesophageal tumor. JZW and FXL made important contributions in revising the content. YLG contributed to data collection and analysis. All authors read and approved the final manuscript.
CONFLICTS OF INTEREST
The authors declare that they have no conflicts of interest.
FUNDING
This work was supported by National Key Research Program of China (2016YFC0904700), Science and Technology Plan Projects of Shandong Academy of Medical Sciences (Youth Fund: 2015–51) and Key Research and Development Program of Shandong Province (2016GSF201093).
REFERENCES
1. Hof H, Rhein B, Haering P, Kopp-Schneider A, Debus J, Herfarth K. 4D-CT-based target volume definition in stereotactic radiotherapy of lung tumors: comparison with a conventional technique using individual margins. Radiother Oncol. 2009; 93:419–23.
2. Li F, Li J, Zhang Y, Xu M, Shang D, Fan T, Liu T, Shao Q. Geometrical differences in gross target volumes between 3DCT and 4DCT imaging in radiotherapy for non-small-cell lung cancer. J Radiat Res. 2013; 54:950–6.
3. Hashimoto T, Shirato H, Kato M, Yamazaki K, Kyrauchi N, Morikawa T, Shimizu S, Ahn YC, Akine Y, Miyasaka K. Real-time monitoring of a digestive tract marker to reduce adverse effects of moving organs at risk (OAR) in radiotherapy for thoracic and abdominal tumors. Int J Radiat Oncol Biol Phys. 2005; 61:1559–64.
4. Takeda A, Kunieda E, Shigematsu N, Hossain DM, Kawase T, Ohashi T, Fukada J, Kawaguchi O, Uematsu M, Takeda T, Takemasa K, Takahashi T, Kubo A. Small lung tumors: long-scan-time CT for planning of hypofractionated stereotactic radiation therapy–initial findings. Radiology. 2005; 237:295–300.
5. Underberg RW, Lagerwaard FJ, Slotman BJ, Cuijpers JP, Senan S. Benefit of respiration-gated stereotactic radiotherapy for stage I lung cancer: an analysis of 4DCT datasets. Int J Radiat Oncol Biol Phys. 2005; 62:554–560.
6. O’Dell WG, Schell MC, Reynolds D, Okunieff R. Dose broadening due to target position variability during fractionated breath-held radiation therapy. Med Phys. 2002; 29:1430–1437.
7. Keall PJ, Starkschall G, Shukla H, Forster KM, Ortiz V, Stevens CW, Vedam SS, George R, Guerrero T, Mohan R. Acquiring 4D thoracic CT scans using a multislice helical method. Phys Med Biol. 2004; 49:2053–67.
8. Vedam SS, Keall PJ, Kini VR, Mostafavi H, Shukla HP, Mohan R. Acquiring a four-dimensional computed tomography dataset using an external respiratory signal. Phys Med Biol. 2003; 48:45–62.
9. Sonke JJ, Rossi M, Wolthaus J, van Herk MB, Damen E, Belderbos J. Frameless stereotactic body radiotherapy for lung cancer using four-dimensional cone beam CT guidance. Int J Radiat Oncol Biol Phys. 2009; 74:567–74.
10. Wang W, Li J, Zhang Y, Li F, Xu M, Fan T, Shao Q, Shang D. Comparison of patient-specific internal gross tumor volume for radiation treatment of primary esophageal cancer based separately on three-dimensional and four-dimensional computed tomography images. Dis Esophagus. 2014; 27:348–54.
11. Hawkins MA, Aitken A, Hansen VN, McNair HA, Tait DM. Set-up errors in radiotherapy for oesophageal cancers is electronic portal imaging or conebeam more accurate? Radiother Oncol. 2011; 98:249–54.
12. Yamashita H, Haga A, Hayakawa Y, Okuma K, Yoda K, Okano Y, Tanaka K, Imae T, Ohtomo K, Nakagawa K. Patient setup error and day-to-day esophageal motion error analyzed by cone-beam computed tomography in radiation therapy. Acta Oncol. 2010; 49:485–90.
13. Wang Z, Wu QJ, Marks LB, Larrier N, Yin FF. Cone-beam CT localization of internal target volumes for stereotactic body radiotherapy of lung lesions. Int J Radiat Oncol Biol Phys. 2007; 69:1618–24.
14. Liu HW, Khan R, D’Ambrosi R, Krobutschek K, Nugent Z, Lau H. The influence of target and patient characteristics on the volume obtained from cone beam CT in lung stereotactic body radiation therapy. Radiother Oncol. 2013; 106:312–6.
15. Clements N, Kron T, Franich R, Dunn L, Roxby P, Aarons Y, Chesson B, Siva S, Duplan D, Ball D. The effect of irregular breathing patterns on internal target volumes in four-dimensional ct and cone-beam ct images in the context of stereotactic lung radiotherapy. Med Phys. 2013; 40:021904.
16. Rietzel E, Pan T, Chen GT. Four-dimensional computed tomography: image formation and clinical protocol. Med Phys. 2005; 32:874–89.
17. George R, Chung TD, Vedam SS, Ramakrishnan V, Mohan R, Weiss E, Keall PJ. Audio-visual biofeedback for respiratorygated radiotherapy: impact of audio instruction and audio-visual biofeedback on respiratory-gated radiotherapy. Int J Radiat Oncol Biol Phys. 2006; 65: 924–933.
18. Balter JM, Lam KL, McGinn CJ, Lawrence TS, Ten Haken RK. Improvement of CT-based treatment-planning models of abdominal targets using static exhale imaging. Int J Radiat Oncol Biol Phys. 1998; 41:939–43.
19. Dinkel J, Welzel T, Bolte H, Hoffmann B, Thierfelder C, Mende U, Debus J, Heller M, Kauczor HU, Biederer J. Four-dimensional multislice helical CT of thelung: qualitative comparison of retrospectively gated and static images in anex-vivo system. Radiother Oncol. 2007; 85:215–22.
20. Persson GF, Nygaard DE, Munck Af Rosenschöld P, Richter Vogelius I, Josipovic M, Specht L, Korreman SS. Artifacts in conventional computed tomography (CT) and free breathing four-dimensional CT induce uncertainty in gross tumor volume determination. Int J Radiat Oncol Biol Phys. 2011; 80:1573–80.
21. Li F, Li J, Ma Z, Zhang Y, Xing J, Qi H, Shang D. Comparison of internal target volumes defined on 3-dimensional, 4-dimensonal, and cone-beam CT images of non-small-cell lung cancer. Onco Targets Ther. 2016; 9:6945–6951.
22. Ezhil M, Vedam S, Balter P, Choi B, Mirkovic D, Starkschall G, Chang JY. Determination of patient-specific internal gross tumor volumes for lung cancer using four-dimensional computed tomography. Radiat Oncol. 2009; 4:1–14.
23. Zhao KL, Liao Z, Bucci MK, Komaki R, Cox JD, Yu ZH, Zhang L, Mohan R, Dong L. Evaluation of respiratory-induced target motion for esophageal tumors at the gastroesophageal junction. Radiother Oncol. 2007; 84:283–9.
24. Wang W, Li J, Zhang Y, Shao Q, Xu M, Guo B, Shang D. Correlation of primary middle and distal esophageal cancers motion with surrounding tissues using four-dimensional computed tomography. Onco Targets Ther. 2016; 9:3705–10.
25. Seppenwoolde Y, Shirato H, Kitamura K, Shimizu S, Van Herk M, Lebesque JV, Miyasaka K. Precise and real-time measurement of 3D tumor motion in lung due to breathing and heartbeat, measured during radiotherapy. Int J Radiat Oncol Biol Phys. 2002; 53:822–34.
26. Vali FS, Nagda S, Hall W, Sinacore J, Gao M, Lee SH, Hong R, Shoup M, Emami B. Comparison of standardized uptake value-based positron emission tomography and computed tomography target volumes in esophageal cancer patients undergoing radiotherapy. Int J Radiat Oncol Biol Phys. 2010; 78:1057–63.
27. Vergalasova I, Maurer J, Yin FF. Potential underestimation of the internal target volume ITV from free-breathing CBCT. Med Phys. 2011; 38:4689–99.
28. Boswell S, Tomé W, Jeraj R, Jaradat H, Mackie TR. Automatic registration of megavoltage to kilovoltage CT images in helical tomotherapy: an evaluation of the setup verification process for the special case of a rigid head phantom. Med Phys. 2006; 33:4395–404.