
INTRODUCTION
Glioblastoma (GB), the most malignant and frequent glioma, is a phenotypically and genotypically heterogeneous tumor; for this region, one single region of the tumor cannot be considered as representative for the entire neoplasia [1]. GB is characterized by progressive events (cell proliferation, increased vessel density and angiogenesis, diffusion, infiltration) and by regressive events (necrosis, hemorrhages, vascular thrombosis). Infiltration is an important issue in the tumor control; it is not uniform along the tumor borders and, often, it is so mild to be practically undetectable. Tumor cells can migrate through the normally looking corpus callosum and isolated tumor cells (ITCs) can be found very far from tumor borders [2].
Tumor heterogeneity can be detected combining conventional (standard T1- and T2-weighted sequences) and advanced magnetic resonance imaging (MRI), including perfusion-weighted imaging (PWI), diffusion-weighted imaging (DWI), diffusion-tensor imaging (DTI) and MR spectroscopic imaging (MRSI) [3, 4], with positron emission tomography (PET)/computed tomography (PET/CT) [5].
Advanced MRI allows the identification of the tissue composition by multiple techniques. PWI directly measures the tissue microvasculature and it may be used to evaluate tumor neoangiogenesis and malignancy grade. The measurement of changes in the signal intensity caused by the intravascular bolus of paramagnetic contrast agents results in perfusion parameters [cerebral blood volume (CBV), mean transit time (MTT), cerebral blood flow (CBF), peak height (PH) and percentage of signal intensity recovery (PSR)]. Relative CBV (rCBV) is the most reliable parameter for tumor microvasculature and, therefore, the most extensively used in tumor diagnosis [6–9]. Information on angiogenesis from rCBV maps positively correlates with the histopathological findings of increased tumor vascularity [10–13].
DWI, expressed by the apparent diffusion coefficient (ADC), measures the water molecule diffusion in biological tissues quantifying the proton Brownian movement. The intra-tumor diffusivity, due to the presence of different tumor components, is generally heterogeneous, reduced in areas of high cell density and increased in necrotic ones. ADC would be expected to be inversely correlated with glioma grade [9, 14, 15]. However, its clinical significance is limited by the glioma tissue heterogeneity [16] and the ADC value overlap [17].
DTI and the resulting parameters, as fractional anisotropy (FA) and mean diffusivity (MD), are microstructural quantitative measurements of the differences in anisotropic diffusion within the white matter tracts. Previous studies proved the role of DTI in characterizing tumor and peritumor involvement of white matter fibers [18].
In MRSI, various metabolites, such as Choline (Cho), Creatine (Cr), N-acetylaspartate (NAA), Myo-inositol (MI), Lipids and Lactate (LL) are reliable indicators of the histological grade. In particular, an increase of Cho with reduction of NAA and consequent variations of Cho/Cr and NAA/Cho ratio, significantly correlates with tumor grade and malignancy. Increased Cho values positively correspond to the Ki-67/MIB-1 labeling index (LI) used to evaluate the proliferative cellular activity [9].
Imaging with 2-[18F]-fluoro-2-deoxy-D-glucose (18F-FDG) was the first oncologic application of PET in human brain tumors [19]. 18F-FDG is actively transported across the blood brain barrier into the cells where it is phosphorylated [20]. 18F-FDG uptake is generally elevated in high grade tumors [21, 22] and can be evaluated by several parameters including the maximum standardized uptake value (SUVmax) or the local metabolic rate of glucose. At present, 18F-FDG SUVmaxis the most frequently used parameter in clinical practice and its quantification is considered as predictive [23]. Increased intra-tumor glucose consumption directly correlates with tumor grade, cell density, biological aggressiveness and patient survival in both primary and recurrent gliomas [24]. Nevertheless, the diagnostic application of 18F-FDG PET/CT may have some limitations, due to the high rate of physiologic glucose metabolism in normal brain tissue. Co-registration of 18F-FDG PET/CT with MR images greatly improves its performance and the accuracy of interpretation. Reference to the MR image delineates the area of interest.
From the therapeutic point of view, the correlation of neuroimaging with tumor phenotype and genotype provides information on the biological significance of different tumor areas [25].
In this study we compared contrast enhancing (CE) and non-contrast enhancing (NE) tumor areas detected by conventional and advanced MRI (PWI, DWI, DTI and MRSI) and 18F-FDG PET/CT with histology, immunohistochemistry, molecular genetics and stemness potential in 48 biopsy specimens from 12 adult GB patients. Biopsies were removed by a frameless image-guided stereotactic system before craniotomy thus minimizing the loss of cerebrospinal fluid and brain displacement.
The aim of the study was the in vivo identification of (i) the most malignant tumor areas, (ii) the extent of tumor infiltration and (iii) the tumor sites where GB stem cells (GSCs) can be detected.
RESULTS
A total of 48 biopsy specimens was collected from 12 adult GB patients (average four per case). Twenty-three samples were obtained from CE regions, 7 of which with a necrotic component, 13 and 12 from NE regions < 1 cm and > 1 cm, respectively.
MRI and 18F-FDG PET/CT parameters according to the distance from the CE region
MRI parameters and 18F-FDG SUVmax variations in CE and NE regions according to their distance from the CE region are illustrated in Table 1.
Table 1: Comparison of MRI parameters and 18F-FDG SUVmax in CE and NE regions
Distance from the CE region |
rT1C |
rT2 FSE |
rT2 FLAIR |
rCBV |
ADC |
FA |
MD |
Cho/Cr |
Cho/NAA |
NAA/Cr |
LL |
18F-FDG SUVmax |
|---|---|---|---|---|---|---|---|---|---|---|---|---|
CE tumor |
1.90 |
1.51 |
1.58 |
4.16 |
1.26 |
0.189 |
1 |
2.70 |
1.95 |
0.906 |
5767 |
7.58 |
NE < 1 cm |
1.115 |
1.185 |
1.775 |
2.415 |
1.26 |
0.286 |
1 |
1.86 |
1.835 |
1.135 |
3212 |
3.5 |
NE > 1 cm |
0.92 |
1.55 |
2.46 |
1.23 |
1.60 |
0.28 |
1 |
1.47 |
1.08 |
1.27 |
3605 |
2.98 |
MRI, magnetic resonance imaging; 18F-FDG SUVmax, 2-[18F]-fluoro-2-deoxy-D-glucose target tumor maximum standardized uptake value; CE, contrast enhancing; NE, non-contrast enhancing; rT1C, relative T1-weighted contrast enhancement; rT2 FSE, relative T2-weighted fast spin echo; rT2 FLAIR, relative T2-weighted fluid attenuated inversion recovery; rCBV, relative cerebral blood volume; ADC, apparent diffusion coefficient (10-3 mm2/s); FA, fractional anisotropy; MD, mean diffusivity (10-3 mm2/s); Cho/Cr, choline/creatine; Cho/NNA, choline/N-acetyl aspartate; NAA/Cr, N-acetyl aspartate/creatine; LL, lipids/lactate.
Correlation values were calculated by measurements from all 48 biopsy specimens. They are expressed as median and range values.
The CE region showed the highest values of rT1C, rCBV, Cho/Cr, Cho/NAA and LL metabolite ratio, and of 18F-FDG SUVmax in comparison with NE regions (Figure 1 and Table 1). rT2 FSE, rT2 FLAIR and ADC were variable and did not show a clear-cut difference between CE and NE regions. Cho/Cr and Cho/NAA ratio decreased proportionally with 18F-FDG SUVmax whereas NAA/Cr ratio increased.
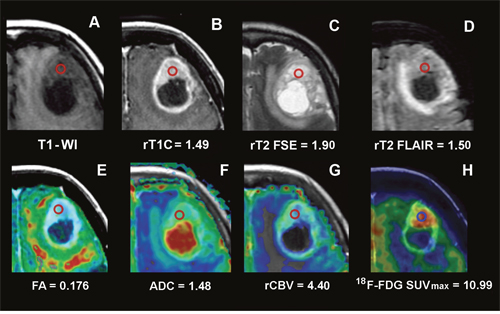
Figure 1: Conventional, advanced MRI and 18F-FDG PET/CT/MR fusion image of a frontal GB. Images of a frontal GB in a 77-year-old woman (Case CTO3) and values from the ROI in the CE. The ROI is indicated by the red circle. (A) T1 weighted MRI. (B) T1C MRI and rT1C value. (C) T2 FSE MRI and rT2 FSE value. (D) T2 FLAIR MRI and rT2 FLAIR value. (E) FA color map fused with axial T1C MRI and FA value. (F) ADC color map fused with axial T1C MRI and ADC value. (G) rCBV color map fused with axial T1C MRI and rCBV value. (H) 18F-FDG PET/CT/MR fusion image and 18F-FDG SUVmax value.
MRI, magnetic resonance imaging;18F-FDG PET/CT/MR, 2-[18F]-fluoro-2-deoxy-D-glucose positron emission tomography/computed tomography/magnetic resonance; CE, contrast enhancement; GB, glioblastoma; ROI, region of interest; T1-WI, T1-weighted image; T1C, T1-weighted contrast enhancement; T2 FSE, T2-weighted fast spin echo; T2 FLAIR, T2-weighted fluid attenuated inversion recovery; FA, fractional anisotropy; ADC, apparent diffusion coefficient; rCBV, relative cerebral blood volume; SUVmax, maximum standardized uptake value.
Both rCBV and FA significantly varied according to the distance from the CE region. In particular, rCBV values decreased in NE areas both < 1 cm (β = -2.6, p = 0.0001) and > 1 cm from the CE region (β = -1.556, p = 0.0001). In this latter, FA values were higher in non-necrotic samples. They significantly increased from CE to NE regions, with statistical significance in NE < 1 cm areas (β = 0.072, p = 0.037).
18F-FDG SUVmax proportionally decreased with the distance from the CE region (β = -2.581, p = 0.0001 for NE areas < 1 cm and β = - 3.174, p = 0.0001 for NE areas > 1 cm, respectively).
Among all MRI parameters, rCBV (β = 1.50, p = 0.039), Cho/Cr ratio (β = 2.048, p = 0.003) and rT1C (β = 1.342, p = 0.037) were significantly associated with 18F-FDG SUVmax in the CE region and also regardless of the distance from the CE region (p < 0.05 for all).
Comparison of regional MRI and 18F-FDG PET/CT parameters with histopathological findings
The histological features identified in the biopsy specimens resulted in four patterns. Pattern 1 (P-1) corresponded to the CE region characterized by the highest values of cell and vessel density, nuclear polymorphism, Ki-67/MIB-1 LI, circumscribed necroses and endothelial hyperplasia; pattern 2 (P-2) was characterized by highly infiltrated tissue with satellitosis or tumor cell co-option with neoangiogenesis or microvascular proliferations (MVPs); pattern 3 (P-3) was characterized by a mild peripheral tumor infiltration without neoangiogenesis and MVPs; pattern 4 (P-4) was characterized by tumor infiltration with peritumor edema. The number of biopsy specimens displaying the above mentioned patterns was uneven: however, at least P-1 to P-3 were always present, while P-4 variably occurred.
The comparison of the histological patterns with regional MRI parameters and 18F-FDG SUVmax is illustrated in Table 2. They were expressed as median and range of values for each pattern. The CE region represented the maximum of the tumor histological malignancy (P-1) and showed the maximum values of rCBV, Cho/Cr, Cho/NAA, LL and 18F-FDG SUVmax (Figure 2A and Table 2). rCBV values significantly decreased from P-1 to P-4 (p < 0.05 for all). Moreover, rCBV showed higher values in specimens from the CE region without macroscopic necrosis than in those containing necrosis. In presence of MVPs, rCBV remained high, also in areas far from the CE region.
Table 2: Comparison of MRI parameters and 18F-FDG SUVmax with the different histological patterns
Histological |
rCBV |
ADC |
FA |
MD |
Cho/Cr |
Cho/NAA |
NAA/Cr |
LL |
18F-FDG SUVmax |
|---|---|---|---|---|---|---|---|---|---|
P-1: CE tumor |
4.325 |
1.265 |
0.186 |
1.0 |
2.465 |
1.94 |
1.14 |
6789 |
8.18 |
P-2: high infiltration |
2.78 |
1.39 |
0.241 |
1.0 |
2.24 |
1.87 |
1.04 |
3359 |
3.654 |
P-3: mild infiltration |
2.39 |
1.78 |
0.128 |
1.50 |
1.86 |
1.56 |
1.25 |
4453 |
3.89 |
P-4: Infiltration with edema |
1.86 |
1.16 |
0.272 |
1.0 |
1.12 |
1.60 |
1.04 |
4086 |
2.85 |
MRI, magnetic resonance imaging; 18F-FDG SUVmax, 2-[18F]-fluoro-2-deoxy-D-glucose target tumor maximum standardized uptake value; P-1:P-4, Pattern 1 to 4; CE, contrast enhancing; NE, non-contrast enhancing; rCBV, relative cerebral blood volume; ADC, apparent diffusion coefficient (10-3 mm2/s); FA, fractional anisotropy; MD, mean diffusivity (10-3 mm2/s); Cho/Cr, choline/creatine; Cho/NNA, choline/N-acetyl aspartate; NAA/Cr, N-acetyl aspartate/creatine; LL, lipids/lactate.
Correlation values were calculated by measurements from 41 biopsy specimens. They are expressed as median and range values. Seven biopsy specimens from the CE region were excluded because they contained necrosis.
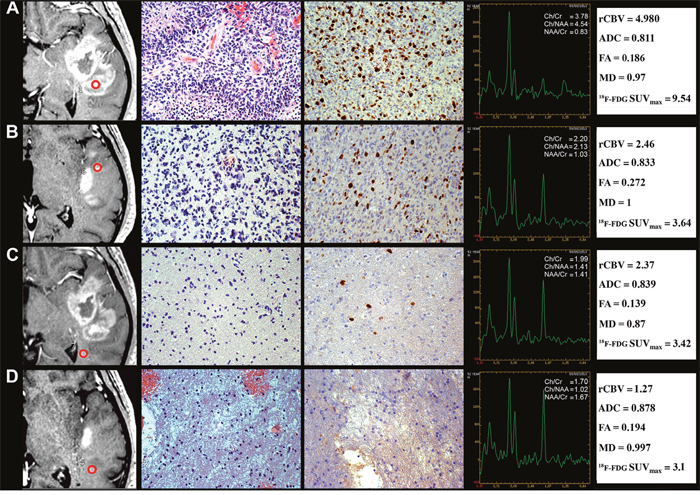
Figure 2: Regional correlation of MRI/MRSI and 18F-FDG PET/CT parameters from CE and NE regions with histopathology of a GB stereotactic biopsy specimen. A 52-year-old man with temporal GB (Case CTO11). (A) CE biopsy specimen corresponding to pattern 1. Column 1, T1C MRI (the ROI is indicated by the red circle). Column 2, Hyperproliferative tumor area (H&E, 200×). Column 3, Ki-67/MIB-1 LI (DAB, 200×). Column 4, MRSI. Column 5, rCBV, ADC, FA, MD and 18F-FDG SUVmaxvalues. (B) NE < 1 cm biopsy specimen corresponding to pattern 2. Column 1, T1C MRI. Column 2, high tumor infiltration area (H&E, 200×). Column 3, Ki-67/MIB-1 LI (DAB, 200×). Column 4, MRSI. Column 5, rCBV, ADC, FA, MD and 18F-FDG SUVmax values. (C) NE > 1 cm biopsy specimen corresponding to pattern 3. Column 1, T1C MRI. Column 2, mild tumor infiltration area (H&E, 200×). Column 3, Ki-67/MIB-1 LI (DAB, 200×). Column 4, MRSI. Column 5, rCBV, ADC, FA, MD and18F-FDG SUVmax values. (D) NE > 1 cm biopsy specimen corresponding to pattern 4. Column 1, T1C MRI. Column 2, tumor infiltration area with edema (H&E, 200×). Column 3, Ki-67/MIB-1 LI (DAB, 200×). Column 4, MRSI. Column 5, rCBV, ADC, FA, MD and 18F-FDG SUVmax values.
MRI, magnetic resonance imaging; MRSI, magnetic resonance spectroscopic imaging; 18F-FDG PET/CT, 2-[18F]-fluoro-2-deoxy-D-glucose positron emission tomography/computed tomography; CE, contrast enhancement; NE, non-contrast enhancement; GB, glioblastoma; ROI, region of interest; T1C, T1-weighted contrast enhancement; H&E, haematoxylin and eosin; LI, labeling index; DAB, 3,3'-Diaminobenzidine; SUVmax, maximum standardized uptake value.
The highest value of LL ratio was found in the CE region because it may contain necrosis in the biopsy specimen.
The Ki-67/MIB-1 LI was significantly associated with the Cho/Cr ratio (r = 0.95, p = 0.03), whereas a borderline association was found with rCBV values. Furthermore, Ki-67/MIB-1 LI was strongly associated with 18F-FDG SUVmax in the CE region (r = 0.87, p = 0.008), also in presence of necrosis (r = 0.72, p = 0.006).
rT2 FSE and rT2 FLAIR were not specific for edematous areas, whereas rCBV, Cho/Cr and Cho/NAA ratio values were higher and FA values lower in edematous areas with infiltration than without infiltration.
In the CE region, rCBV, Cho/Cr, Cho/NAA and 18F-FDG SUVmax values provided the best evaluation of the GB malignancy and corresponded to the highest Ki-67/MIB-1 LI. 18F-FDG SUVmax, rCBV, Cho/Cr and Cho/NAA decreased from P-2 to P-4 (Figure 2B−2D). In peritumor regions, 18F-FDG SUVmax, Cho/Cr and Cho/NAA were still capable of detecting tumor infiltration. ADC and FA were not suitable tumor indicators (p > 0.05 for both).
Immunohistochemistry (IHC)
IHC revealed (i) variable glial fibrillary acidic protein (GFAP)-positive staining of tumor cells and constant and strong staining of reactive astrocytes (Figure 3A), (ii) Iba-1/CD68-positive staining of reactive ramified microglia (Figure 3B) and macrophages (Figure 3C), (iii) CD34-positive staining of endothelial cells (Figure 3C) and IDH1R132H-negative immunostaining. ATRX expression was positive in tumor cells and reactive astrocytes. Edematous areas were characterized by intense expression of Aquaporin 4 both on reactive astrocyte processes and vessels (Figure 3D).
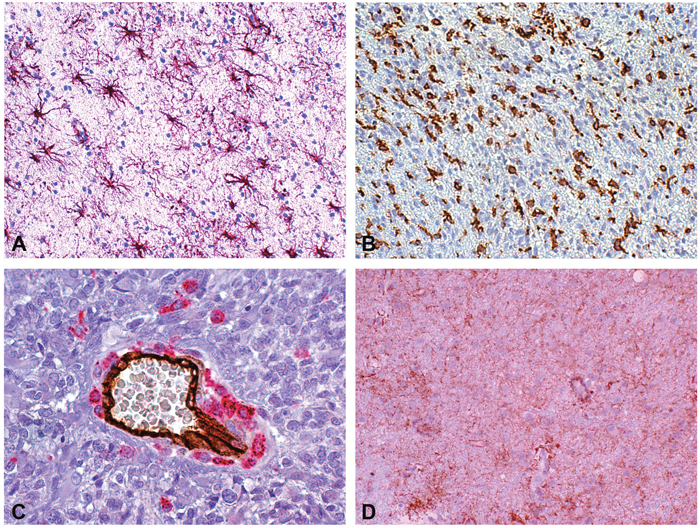
Figure 3: Reactive astrocytes, microglia/macrophages and edema in a peritumor stereotactic biopsy specimen. (A) Reactive astrocytes at regular interdistance. GFAP (DAB, 200×). (B) Reactive ramified microglia and macrophages in an infiltration area. Iba-1 (DAB, 200×). (C) Scattered and clustered macrophages around a middle size vessel and isolated macrophages in tumor parenchyma. Double staining CD34-CD68 (DAB and Alkaline Phosphatase Red, respectively, 400×). (D) Aquaporin 4 immunopositivity in reactive astrocytes and vessels (DAB, 200×).
GB, glioblastoma; GFAP, glial fibrillary acidic protein; Iba-1, ionized calcium-binding adapter molecule 1; DAB,3,3'-Diaminobenzidine.
Reactive astrocytes
In P-1 and P-3, GFAP expression and morphology may allow to detect reactive astrocytes. Their number was variable in P-1, whereas in P-2 and P-3 they were easily recognizable with a frequency of 20-25 per 400× high-power field (HPF) or more, depending on the supposed time elapsed from the infiltration. In comparison with areas of tumor infiltration, the number of reactive astrocytes slightly decreased if edema was present (Table 3).
Table 3: Cell counts in the different tissue areas
Tissue area |
Cellularity |
GFAP+ reactive |
CD68 + cells |
Iba-1+ cells |
|---|---|---|---|---|
Normal cortex |
240±20 |
– |
0 |
10±3 |
Normal white matter |
240±30 |
– |
0 |
10±3 |
P-1: CE tumor |
450±50 |
Variable |
100±10 |
70±5 |
P-2: High infiltration with MVPs |
400±40 |
20±5 |
2±1 |
100±10 |
P-3: Mild infiltration |
350±30 |
25±7 |
2±1 |
100±10 |
P-4: Infiltration with edema |
300±40 |
20±7 |
0 |
100±10 |
CE, contrast enhancing; GFAP, glial fibrillary acidic protein; Iba-1, ionized calcium-binding adapter molecule 1; P-1:P-4, Pattern 1 to 4; MVP, microvascular proliferation.
Cell counts were obtained at 400×HPF. Values are presented as means ± SD.
Microglia/macrophages
In the CE region, most of the cells showed the morphology of macrophages and intermediate forms from ramified microglia. Occasionally, they could be clustered around vessels or necroses. In areas with infiltration, the aspect corresponded to reactive ramified microglia. Macrophages showed a granular immunopositivity for CD68, while reactive ramified microglia displayed a diffuse immunopositivity for Iba-1. The frequency of macrophages was variable in the biopsy specimen from the CE region (up to > 100 elements per 400× HPF); the number of reactive ramified microglia in areas with infiltration was equal to ~100 elements (per 400× HPF). In edematous areas, the number of reactive ramified microglia decreased from < 100 to 5-10 elements (per 400× HPF). Microglia cells were frequent in all histological patterns, whereas macrophages were frequent in the CE region and low far from it (Table 3).
In vitro cultures
The development of neurospheres (NS) or adherent cells (AC) (Figure 4A and 4E) from the different biopsy specimens with respect to MRI and histological patterns is illustrated in Table 4. NS mainly developed in biopsy specimens obtained from the CE region (P-1), and, to a lesser extent, in specimens containing P-2 or P-3. Their development progressively decreased in biopsy specimens obtained from more peripheral NE regions; AC followed a similar pattern.
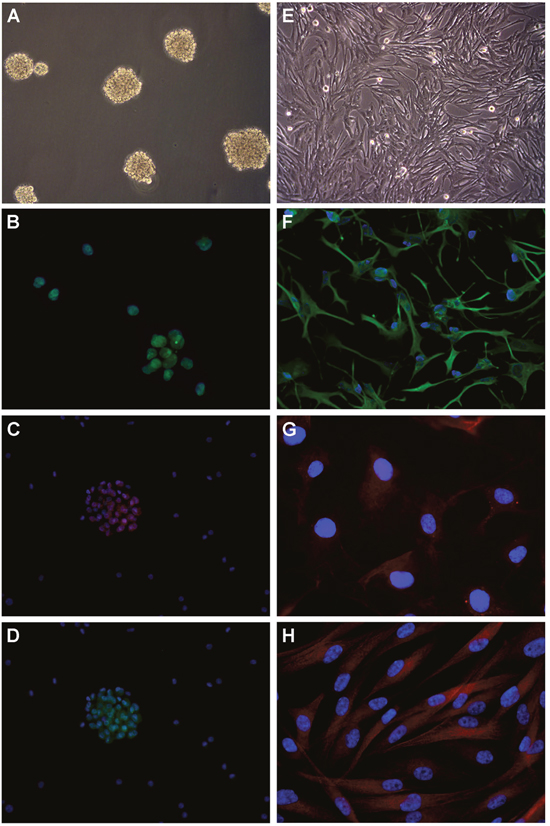
Figure 4: Development of cell lines by in vitro culture of newly diagnosed GB and immunofuorescence. (A) Neurospheres in DMEM/F-12 medium supplemented with growth factors (100× magnification). (B) SOX2 expression in nuclei (400× magnification). Nuclei are counterstained with DAPI. (C) CD133 expression in cytoplasms (200× magnification). (D) Musashi.1 expression in cytoplasms (200× magnification). (E) Adherent cells in DMEM supplemented with serum (100× magnification). (F) GFAP expression in cytoplasms (200× magnification). (G) GalC expression in cytoplasms (400× magnification). (H) βIII Tubulin expression in cytoplasms (400× magnification).
DMEM, Dulbecco’s modified Eagle’s medium; DAPI, 4’,6-diamidine-2’-phenylindole, dihydrochloride; SOX2, sex determining region Y-box 2; GFAP, glial fibrillary acidic protein; GalC, galactosylceramidase.
Table 4: Development of neurospheres and adherent cells with respect to MRI and the different histopathological features
Histological pattern/MRI |
Neurospheres |
Adherent cells |
|---|---|---|
P-1: CE tumor |
++ |
+ |
P-2: High infiltration with MVPs |
+ |
+ |
P-3: Mild infiltration |
+/– |
+ |
P-4: Infiltration with edema |
– |
– |
MRI, magnetic resonance imaging; P-1:P-4, Pattern 1 to 4; CE, contrast enhancing; MVP, microvascular proliferation.
For neurospheres, the scale refers to their number, size and growth rate. For adherent cells, the scale refers to the presence or absence of a stabilized monolayer.
As revealed by immunofluorescence (IF), NS constantly expressed stemness antigens, such as Nestin, SOX2 and REST, but only sporadically CD133 and Musashi.1 (Figure 4B–4D). AC expressed differentiation antigens, such as GFAP, GalC and βIII-Tubulin (Figure 4F–4H). Stemness antigens have been observed in all biopsy specimens from the CE region as indicators of malignancy.
Molecular genetics
The genetic and epigenetic alterations identified in the biopsy specimens from the CE region included loss of heterozygosity (LOH) on 10q (9/12, 75%), LOH on 9p (4/12, 33.3%), LOH on 17p (3/12, 25%), PTEN mutations (4/12, 33.3%), TP53 mutations (3/12, 25%), TERT promoter mutations (10/12, 83.3%), EGFR amplification (4/12, 33.3%) and MGMT hypermethylation (7/12, 58.3%). No IDH1/2 somatic mutations at Arg132 and Arg172 hot spot codons were detected. Most of the genetic and epigenetic alterations were identified in biopsy specimens from the CE region showing the highest values of 18F-FDG SUVmax, rCBV, Cho/Cr ratio and the most malignant tumor phenotype (P-1). They recapitulated the molecular profile identified in the surgically removed tumor. The spectrum of genetic and epigenetic changes overall decreased from CE to NE regions to get undetectable in biopsy specimens from mildly infiltrated NE areas (Table 5). The molecular alterations were therefore identified in the CE region and in highly infiltrated areas (P-1 and P-2).
Table 5: Comparison among histological patterns, MRI and molecular genetics
Histological pattern |
MRI |
LOH9p,10q,17p |
EGFRAmpl |
TERTMut |
PTENMut |
TP53Mut |
MGMTMeth |
|---|---|---|---|---|---|---|---|
P-1: CE tumor |
CE |
+ |
++ |
++ |
++ |
+ |
+ |
P-2: High infiltration with MVPs |
CE/NE |
+ |
+ |
+ |
+ |
+ |
+ |
P-3: Mild infiltration |
CE/NE |
+/– |
+ |
– |
– |
– |
– |
P-4: Infiltration with edema |
NE |
– |
– |
– |
– |
– |
– |
MRI, magnetic resonance imaging; P-1:P-4, Pattern 1 to 4; MVP, microvascular proliferation; CE, contrast enhancing; NE, non-contrast enhancing; LOH, loss of heterozygosity; EGFR, epidermal growth factor receptor; TERT, telomerase reverse transcriptase; PTEN, phosphatase and tensin homologue; TP53, tumor protein p53; MGMT, O-6-methylguanine-DNA methyltransferase.
LOH: The scale corresponds to the presence (+) or absence (–) of LOH on the tested regions; EGFR: The scale corresponds to the number of samples with gene amplification (++, >50%; +, <50%; –, no amplification); TERT, PTEN, TP53: The scale corresponds to the number of samples with gene mutations (++, >50%; +, <50%; –, wild type); MGMT: The scale corresponds to the number of samples with (+) or without (–) promoter methylation.
As for GB-derived cell lines, the genotype observed in NS totally mimicked the genotype of the solid tumor; it was absent or only partially expressed in AC. The nucleotide sequence variations identified in TERT, PTEN and TP53 genes are listed in the Supplementary Table 1. All of them were of somatic origin.
DISCUSSION
Conventional and advanced MRI, combined with 18F-FDG PET/CT, may reveal the biological significance of the different GB tumor areas when compared to the tumor phenotype and genotype, consistently with previous observations [26, 27], also after frameless image-guided stereotactic neurosurgery [28, 29]. Sensitivity, specificity, positive predictive value (PPV) and negative PV (NPV) of conventional MRI are not satisfactory in predicting glioma grade. Conversely, rCBV and metabolite ratio measurements from MRSI, alone or combined, can significantly improve both sensitivity and PPV of conventional neuroimaging [11]. Significant differences in rCBV measurements and Cho/Cr, Cho/NAA or NAA/Cr ratio have been reported between low and high grade gliomas, with rCBV having the greatest diagnostic performance [11]. In the clinical practice, 18F-FDG PET/CT is one of the most widely used tracer to indicate the presence of a tumor. We considered 18F-FDG SUVmax as a reliable indicator of tumor malignancy if compared to other volume-based PET parameters, such as metabolic tumor volume (MTV) or total lesion glycolysis (TLG). Indeed, MTV needs the definition of an operator-based threshold that can introduce variability. Conversely, the global marker TLG cannot correlate imaging with histopathology of strictly delimited biological specimens as we required. Moreover, in order to increase the spatial resolution, we fused 18F-FDG PET/CT with MRI (18F-FDG PET/CT/MRI fusion images).
Is the in vivo identification of the most malignant tumor areas achievable?
In our series, imaging of the CE region, corresponding to the histologically most malignant tumor areas, shows higher values of MRI rT1C and rCBV, MRSI Cho/Cr, Cho/NAA, LL ratio and 18F-FDG SUVmax in comparison with NE regions. rT2 FSE, rT2 FLAIR, ADC and FA do not show clear-cut differences, in agreement with previous findings [6–8]. The reason why rT2 FSE or rT2 FLAIR cannot discriminate among the different regions of the tumor could be due to the heterogeneity of the water content in the ROI. Amid the conventional MRI parameters, rT1C was the most reliable to discriminate high malignancy regions. Remarkably, in all biopsy specimens from the CE region, rCBV values are constantly and significantly increased if compared with the threshold of 1.75 considered as indicative of GB [11]. Relatively lower rCBV values may be explained by necrosis. Additionally, all biopsy specimens from the CE region are characterized by the highest values of Cho/Cr, Cho/NAA and LL ratio. These parameters (except for LL) can decrease in presence of necrosis, even though they remain high compared with specimens from NE areas. The highest values of LL ratio are caused by the occurrence of necrosis in biopsy specimens from the CE region. This is due to the location of circumscribed necroses in hyperproliferative areas as emblem of malignancy. It is quite obvious that the NAA/Cr ratio is higher far from the CE region as well as in areas with infiltration.
Among perfusion parameters, rCBV, PH and PSR measurements correlate with tumor microvasculature, as already observed [6–8]. rCBV variations provide a reliable index of the tumor microvasculature and histological grade [10, 12, 13, 30]. In our series, rCBV values decrease from CE to NE regions with higher values in infiltrated areas with MVPs indicating neoangiogenesis.
In literature and in our study, rCBV is significantly associated with 18F-FDG SUVmax or to local metabolic rate of glucose on PET [31]. In adult brain tumors, imaging with 18F-FDG PET/CT showed that an increased 18F-FDG uptake corresponds to an increased tumor malignancy, aggressiveness, grade [21], cell density and rCBV [32]. This has also been observed in pediatric brain tumors [33].
From our data, 18F-FDG PET/CT/MRI fusion images indicate the most malignant tumor phenotype, corresponding to the histological P-1, as reported in literature [5, 31]. On the other hand, 18F-FDG SUVmax is associated with the Ki-67/MIB-1 LI in CE regions, also if containing necrosis, confirming a recent meta-analysis [34]. However, a possibility of mistake in the 18F-FDG SUVmax interpretation can occur when the ROI includes the cerebral cortex due to physiological neuronal metabolism.
Remarkably, glioma grade can be successfully predicted by the significant association of rCBV, Cho/Cr ratio and 18F-FDG SUVmax with the histological P-1 and the Ki-67/MIB-1 LI [9].
No correlation has been found between ADC values and the histopathological findings. ADC values of tumor parenchyma can indirectly reflect cell proliferation and malignancy [35, 36]. They should be inversely correlated with tumor grade [9, 14, 15], with low values in hypercellular areas [37]. Even though an inverse correlation between 18F-FDGSUVmaxand ADCmin, and between SUV ratio and ADCmin has been reported [38], ADC is not regarded as a suitable parameter for tumor grade identification [16, 17]. We obtained similar ADC values in CE (where the high cellularity should restrict water molecules in their movement) and NE regions, as well as a lower ADC value in edema, where water is abundant. Several factors may affect ADC measurements. For example, an enlargement of the extracellular compartment caused by necrosis could likely cancel the effect of high cellularity. On the other hand, also the presence of non-tumor reactive cells (i.e. astrocytes and microglia/macrophages) in edematous areas could reduce ADC.
Reduced FA values are observed in both CE and NE regions if compared with normal brain. The reduction is greater in infiltrated areas compared with the CE region without necrosis or to areas of high infiltration with MPVs, where relatively higher FA values reflect the presence of microstructural barriers related to the high cell density and vascular proliferation. The reduction of FA caused by necrosis may explain the variability of the measurements and the contrasting results from the literature when FA has been used as index for tumor grade [9, 15, 36, 39, 40]. From our study, FA does not result a suitable parameter to assess tumor malignancy.
The relationship of 18F-FDG SUVmax and MRI parameters with molecular features of GB is not direct but mediated by histology. In general, neuroimaging corresponds to histology and histology, in turn, to molecular genetics. Previous attempts to correlate neuroimaging with molecular genetics have been made. For instance, a significant correlation has been found between rCBV [41] or ADC values [42] and EGFR gene amplification/EGFRvIII. However, only 40% of GBs harbors EGFR gene amplification/EGFRvIII [43]. Likewise, the correlation of ADC values with the MGMT hypermethylation can be affected by the unreliability of ADC in GB [44].
The detection of IDH1/2 mutations through the measurement of the 2-hydroxyglutarate (2-HG) oncometabolite levels by MRSI, despite a possible spectral overlap with other metabolites, would be remarkable only if referred to the whole glioma group [37]. In our series, all cases are IDH-wild type GBs.
Interestingly, different genetic expression patterns between CE and NE regions have been reported by gene microarray studies, with genes associated with mitosis, angiogenesis and apoptosis clustering in the former [6]. In our series, allelic imbalances on the critical chromosomal regions 9p, 10q and 17p, EGFR gene amplification, TERT, PTEN and TP53 mutations, and MGMT hypermethylation prevail in CE compared with NE biopsy specimens. However, their full expression is only detectable in the CE region and in highly infiltrated areas. The number of genetic and epigenetic alterations progressively decreases from the most malignant tumor regions to peripheral ones, parallel to the regional variations of 18F-FDG SUVmax and MRI parameters. The molecular heterogeneity can be due, beside policlonality, to the rarefaction of tumor cells moving away from the proliferative tumor [45, 46]. In order to correlate regional genetic heterogeneity and spatially matched imaging measurements, some authors recently analyzed DNA copy number variants for core GB driver genes, as reported by The Cancer Genome Atlas, on multiple image-guided biopsies in primary GB patients from CE and NE regions [47]. Interestingly, neuroimaging displayed a significant correlation with 6 drivers genes (EGFR, PDGFRA, PTEN, CDKN2A, RB1, TP53) supporting, in agreement with our findings, radiogenomics in characterizing regional genetic heterogeneity in GB.
Is the extent of tumor infiltration in vivo detectable?
The invasion capacity of tumor cells contributes to the failure of a local control of the tumor, because infiltrating tumor cells can extend far from it escaping radiation effects. They are detected in peritumor edema [48] and in normally looking areas in 20% of GBs [49]. MRI fails to detect them when occurring inT2 hyperintense or normal T1 or T2 areas [50]. The recognition of tumor infiltration in edematous areas is obviously important, although it has been observed that the removal of T2 hyperintense NE areas does not impact on patient outcome [51].
In MRI edematous areas, histologically characterized by an increased expression of Aquaporin 4 [52], the identification of tumor cells depends on their frequency. Indeed, edema influences both MRI variables and the total cell number, regardless of their nature (tumor, normal, endothelial cells, microglia/macrophages or inflammatory cells). The bias is represented by the difficulty to recognize tumor infiltration when it overlaps with edema [53, 54]. In edematous areas, tumor and normal cell density decreases and tumor infiltration is only detectable when tumor cell density is higher than normal, at least higher enough to reach the threshold influencing MRI variables [25, 55].
GB frequently spreads along white matter tracts causing disruption that can be detected by DTI. However, no significant differences in FA measurements have been found in infiltration areas with or without MVPs and with edema. This is in agreement with previous studies showing a low sensitivity of FA reduction to recognize infiltration [56] or doubts on its reliability [57, 58].
A high Cho/NAA ratio in edematous areas allows detecting tumor infiltration [59–61], while low absolute values of total NAA seem to be more effective than Cho to reveal low tumor infiltration [62]. In our series, 18F-FDG SUVmax, Cho/Cr and Cho/NAA ratio, result the most suitable parameters to detect tumor infiltration in edematous areas.
Interestingly, reactive astrocytes, typically distributed at regular intervals, never exceed a constant number per field (20-25 at 400× HPF). Their number can influence the cell counts of an area and, consequently, neuroimaging only when it contains < 100 tumor cells per field. Microglia/macrophages, which exceed four times the number of reactive astrocytes, could mimic tumor cell infiltration. Tumor cell infiltration beneath a certain value is undetectable. Therefore, the detection of ITCs in peritumor areas or, even worse, far from the tumor, remains unachievable thus representing a sword of Damocles for tumor recurrence.
Is the in vivo identification of the tumor sites responsible for the GSC origin possible?
Therapies for high grade gliomas are ineffective when addressed to the insensitive tumor mass; they should be targeted to the cells responsible for the growth, i.e. GSCs. These are believed to occur everywhere in the tumor [63] or to be heterogeneously distributed within it [64, 65]. Regardless of their origin [25, 55, 66], our findings demonstrate a molecular and stemness gradient from the highest malignant tumor areas to the periphery [67, 68].
The only methods for the in vivo detection of GSCs are either the neurosphere assay (NSA) [69] or the side population assay [70] applied to surgical tumor specimens. Neuroimaging techniques have been successfully used to in vivo detect hematopoietic and leukemic stem cells, but their application to solid tumors was limited [45]. Using intravital microscopy, tumor propagation of labeled GSCs has been obtained by direct in vivo evidence [45]. Bone marrow-derived endothelial precursor cells, labeled with superparamagnetic iron oxide nanoparticles, have been observed in glioma-bearing severe combined immunodeficient (SCID) mice by MRI [71], but no similar procedure has been adopted for GSCs. The only way to detect the most malignant tumor areas containing GSCs is the combined use of MRI and 18F-FDG PET/CT [55, 72].
Maybe, the search for GSCs as a cell type is misleading. GSCs could represent a functional status [73, 74] in dynamic equilibrium with tumor non-stem cells under the regulation of microenvironment [75–77]. Our current findings suggest that GSCs are generated or reside in the most malignant tumor phenotype [65].
This study has two limitations: (i) the relatively small sample size, responsible for the low number of comparisons, and (ii) possible technical pitfalls derived from a misregistration between the biopsy site and the region of interest (ROI) imported into the neuronavigation device (although all stereotactic biopsies have been performed before craniotomy).
MATERIALS AND METHODS
Patients
In an initial database we identified 23 consecutive potentially eligible patients from 2012 to 2014 at the Department of Neurosurgery of Città della Salute e della Scienza (Turin, Italy). Among these, twelve patients (7 men, 5 women; mean age 65 y, 48 – 78) (labeled CTO3, CTO4, CTO5, CTO6, CTO10, CTO11, CTO12, CTO14, CTO15, CTO16, CTO17, CTO23) were then selected according to the eligibility criteria [i.e. newly diagnosed GB [79]] and consent to participate in the study.
The study was in compliance with the local institutional review board and Committee on Human Research and with the ethical human-subject standards of the World Medical Association Declaration of Helsinki Research. Written informed consent was obtained from all patients.
Preoperative MRI
Preoperative MRI was performed one or two days before the planned biopsy on a 1.5-tesla (1.5T) MR scanner (GE Medical Systems, Milwaukee, WI, USA). The optimized scan protocol included both conventional and advanced (DWI, DTI, PWI and MRSI) MR techniques.
Conventional MRI included sagittal and axial T1-weighted spin echo (SE) images (TR/TE = 560 ms/14 ms), axial Proton Density-T2-weighted fast SE (PD-T2 FSE) (TR/TE = 3480 ms/24.2-105 ms), coronal T2-weighted fast SE (T2-FSE) (TR/TE = 8040 ms/118 ms) and sagittal isotropic 3-dimensional fluid attenuated inversion recovery (3D-T2 FLAIR) (TR/TE/inversion time = 6000 ms/133 ms/2000 ms). Contrast enhanced T1-weighted SE images and 3D Spoiled Gradient Recalled T1-weighted SE (3D SPGR T1 TSE) (TR/TE = 10.54 ms/4.20 ms; 1.6 mm/0 mm, slice thickness/interslice gap).
DWI data were acquired using single shot, SE, echo-planar imaging (EPI) (TR/TE = 6100 ms/98.6 ms; 5 mm/1 mm slice thickness/interslice gap; 128 × 128 matrix). DWI datasets consisted of 3 independent gradient directions at b = 1000 s/mm2 and 1 non-diffusion weighted image (b = 0 s/mm2).
DTI data were acquired using single shot EPI-SE (TR/TE = 12000 ms/~96.7 ms) with 2.5 mm isotropic voxels. DTI datasets consisted of 48 imaging volumes: 25 independent gradient directions at b = 1000 s/mm2 and b = 0 s/mm2.
Axial dynamic susceptibility contrast (DSC)-PWI was performed using a series of T2* EPI-FID (flip angle = 90°; TR/TE=1725 ms/50 ms; parallel imaging asset with acceleration factor 2; 128 × 128 matrix; 28 × 28 cm field of view; 20 slices, 5-mm slice thickness, 35 time points) before, during and after intravenous administration of 0.1 mmol per kilogram body weight of Gadobutrol (Gadovist®, Bayer HealthCare Pharmaceuticals, Berlin, Germany). The first 6 EPI acquisitions were performed before the injection of Gadobutrol to establish a pre-contrast baseline. Pre-injection of 2 mL of contrast material was administered in order to reduce the influence of T1. The region selected for DSC coverage included the entire supra-tentorial area.
3D H-1 MRSI (TR/TE = 1000 ms/144 ms with 1-cc nominal resolution) was acquired before contrast administration to cover the entire tumor volume as determined by T2-weighted FLAIR and FSE images together with the normal appearing adjacent brain tissue.
Advanced MRI – image post-processing
Advanced MRI data were analyzed using a commercial post-processing software (FuncTool, v3.1, GE Medical Systems). For diffusion analysis, ADC maps were created and for perfusion analysis, color-coded CBV maps were generated after motion correction to provide better visualization of tumor boundaries. CBV was calculated as the area under the curve of the first-pass bolus.
The spectra were automatically phased, frequency aligned and baseline corrected, and spectral parameters were calculated. Cho, Cr, NAA and LL peak areas were estimated integrating the resonances at 3.2, 3.0, 2.0 and 0.6-1 ppm, respectively. Normal values for each metabolite peak area were determined by averaging values in 10 to 20 voxels selected within brain parenchyma with a normal MR appearance, usually in the contralateral hemisphere to the tumor.
For each T1 brain scan, ROIs (5-mm diameter circumferences) were drawn and individual masks for each brain were generated. The ROI size was intermediate between PET/CT and MRI spatial resolutions.
The initial processing step was the Brain Extraction Toolkit (BET) (FSL, www.fmrib.ox.ac.uk/fsl) to isolate the brain from the background. DTI acquisition was corrected for eddy currents and head-motion distortions (using the FSL program Eddy Correct) and FA maps were obtained with the Frequent Domain Transform Toolbox in FSL. FA and MD images of all subjects were aligned to the respective T1 by a non-linear registration (FNIRT, www.fmrib.ox.ac.uk/fsl); transformation matrices were then generated and applied to ROIs. ROI value analysis was performed by ImageJ software (http://imagej.nih.gov/ij/).
Contrast enhanced 3D SPGR T1-weighted images were fused with 18F-FDG PET/CT images using the Integrated Registration software on the Advantage image processing workstation (GE Medical Systems) to further increase spatial resolution.
18F-FDG PET/CT
Patients fasted for at least 6 hours prior to examination. Before radiopharmaceutical injection, blood glucose was measured (< 130 mg/dL in all cases). Each subject was intravenously injected with approximately 185 MBq of 18F-FDG 60 minutes before the scan. 18F-FDG PET/CT scans were then acquired by a Discovery ST-E PET/CT System (GE Medical Systems) combining a helical multislice CT scanner and a designed Bismuth germanate (BGO) block detector PET tomograph, in 3D modality with a total axial field of view of 30 cm and no interplane gap space. 18F-FDG PET/CT images were acquired through 2 sequential scans: CT brain scan (thickness, 3.75 mm; 140 kV; 60-80 mA/s) and PET brain scan [Field of View (FOV) of 30 cm, transaxial]. The PET scan was initiated immediately after the CT examination in order to use CT data for the attenuation correction of the PET data. 3D data were reconstructed using a 3D-OSEM algorithm (VUE-point) with the corrections (random, scatter, attenuation) incorporated into the iterative process. The parameters were: number of subsets 28; number of iteration 4. Data were collected in 128 × 128 matrices with a reconstructed voxel of 1.33 x 1.33 x 2.00 mm. Finally, 18F-FDG PET/CT images were fused with contrast enhanced 3D SPGR T1-weighted images using the Integrated Registration software on the Advantage image processing workstation (GE Medical Systems).
Preoperative tumor tissue site selection, MRI and 18F-FDG PET/CT analysis
ROIs were defined on the contrast enhanced 3D SPGR T1-weighted MR sequence from the CE region of the tumor to progressively more peripheral NE regions (< 1 cm and >1 cm from the CE region). The exact location of the ROI was the best achievable compromise between the minimal neurosurgical risks (i.e. intracranial bleeding) and the representative chosen tumor areas. The sampling sites varied in number from 3 to 5: at least 1 of these was selected in the CE region of the tumor and 2 in progressively more peripheral NE regions < 1 cm and >1 cm from the enhancing ring, in peritumor edema and normal tissue. The T1C, T2 FSE, T2 FLAIR and CBV values were normalized dividing the estimated values in the normal-appearing white matter from the contralateral hemisphere and expressed as relative values (r). Metabolite concentrations of Cho, Cr, NAA were obtained and their ratios calculated. Finally, the 18F-FDG SUVmaxwas calculated on the ROIs identified by PET/CT/MRI fusion images. Furthermore, SUVmax of white matter homolateral and contralateral to the lesion, SUVmax of grey matter homolateral and contralateral to the lesion, SUVmax of ventricle were calculated in order to obtain the ratio SUVmax-lesion/SUVmax-white matter homolateral and contralateral to the lesion, SUVmax-lesion/SUVmax-grey matter homolateral and contralateral to the lesion and SUVmax-lesion/SUVmax-ventricle.
Co-registration of 18F-FDG PET/CT and advanced MRI data was achieved. ROIs defined on the PET/CT/MRI fusion images were copied to the co-registered MRI dataset and used to calculate the average metabolite concentrations for Cho, Cr, NAA and Cho/NAA ratio in the corresponding areas. Congruence of areas for 18F-FDG uptake and the above mentioned metabolic ratio in the lesions was estimated on the co-registered 18F-FDG PET/CT and MRI datasets.
Biopsy sampling sites were reviewed together with the neurosurgeon in order to establish the feasibility of the biopsy
Stereotactic brain biopsy
All 12 patients underwent frameless MRI-guided stereotactic brain biopsy by the same neurosurgeon. General anesthesia was induced and patient’s head fixed in a three point Mayfield clamp in which was attached a Vertek® II Articulating Arm with the neuronavigation reference star (Small Passive Cranial Reference Frame) (Medtronic Inc., Louisville, CO, USA). Forehead and facial surface anatomical landmarks were obtained with the Tracer registration method.
For each patient, the preoperative CE 3D SPGR T1-weighted MR images were imported into the Stealth Station® Treon PlusTM Surgical Navigation System (Medtronic) in order to identify all biopsy targets and to establish stereotactic coordinates. Intraoperative image guidance was achieved using the Mach™ Cranial Planning 4.6. software (Medtronic).
Biopsies were performed through a single 14-mm diameter burr hole at the defined stereotactic sites using a Navigus® Frameless Biopsy System including the Biopsy Trajectory Guide Kit and a Passive Biopsy Needle (Medtronic). For each patient, from 3 to 5 biopsy specimens, approximately 8-mm-long and 1-mm in diameter, were obtained. No bleeding occurred as a complication during the procedure.
Craniotomy, dura opening and full or partial tumor removal were performed after biopsies.
Pathology and IHC
Each biopsy specimen was split in three fragments. The first one was formalin fixed, paraffin embedded (FFPE) and cut in 5 μm-thick sections. The second one was minced and put in culture and the third fragment was stabilized in RNAlater® solution (Life Technologies, Foster City, CA, USA) and stored at -80°C.
All biopsy specimens and the removed solid tumor of each patient underwent histological diagnosis according to the routine practice.
Beside hematoxylin and eosin (H&E) staining, IHC was performed with the primary antibodies listed in Table 6 on a Ventana Full BenchMark® XT automated immunostainer (Ventana Medical Systems, Tucson, AZ, USA). The Ultra-ViewTM Universal DAB and Alkaline Phosphatase Red Detection Kits were the detection system (Ventana). Heat-induced epitope retrieval was obtained with Tris–EDTA, pH 8 (Ventana).
Table 6: List of primary antibodies used for immunohistochemistry and immunofluorescence
Antibody |
Source |
Dilution |
Code |
Company |
|---|---|---|---|---|
Ki-67/MIB-1* |
Mouse |
1: 100 |
M7240 |
Dako |
GFAP |
Mouse |
1: 200 |
M0761 |
Dako |
GFAP ° |
Rabbit |
1: 200 |
Z0334 |
Dako |
IDH1RI32H* |
Mouse |
1: 20 |
DIA H09 |
Dianova |
ATRX* |
Rabbit |
1: 400 |
HPA001906 |
Sigma-Aldrich |
CD34* |
Mouse |
Pre-diluted |
790-2927 |
Ventana |
CD68* |
Mouse |
Pre-diluted |
790-2931 |
Ventana |
Aquaporin 4* |
Rabbit |
1: 200 |
ABI2218 |
Millipore |
Iba-1* |
Rabbit |
1: 500 |
#019-19741 |
Wako |
CD16 |
Rabbit |
Pre-diluted |
760-4863 |
Ventana |
Nestin*,° |
Rabbit |
1 : 200 |
AB5922 |
Millipore |
CD133 °/1 (AC133) |
Mouse |
1 : 20 |
130-090-422 |
Miltenyi Biotec |
SOX2*,° |
Mouse |
1 : 100 |
MAB2018 |
R&D Systems |
Musashi.1*,° |
Rabbit |
1 : 200 |
AB5977 |
Millipore |
REST*,° |
Rabbit |
1 : 150 |
IHC-00141 |
Bethyl Lab. |
GalC*,° |
Mouse |
1 : 100 |
MAB342 |
Chemicon |
βIII-Tubulin*,° |
Mouse |
1 : 250 |
MAB1637 |
Chemicon |
GFAP, glial fibrillary acidic protein; IDH1, isocitrate dehydrogenase 1; ATRX, alpha-thalassemia/mental retardation syndrome X-linked; Iba-1, ionized calcium-binding adapter molecule 1; SOX2, sex determining region Y-box 2; REST, RE1-silencing transcription factor; GalC, galactosylceramidase.
*HIER required, ° used for immunofluorescence.
The following histopathological parameters were evaluated and recorded: cell and vessel density, nuclear atypia, endothelial hyperplasia, MVPs, glomeruli, circumscribed necrosis, mitoses, microglia/macrophages and reactive astrocytes.
Cell density was quantified on H&E-stained sections as the average number of cells manually counted in 5 random microscopic fields, per 1000× magnification. Ki-67/MIB-1 LI was calculated as the average percentage of positive nuclei on the total number of nuclei in 5 microscopic fields, per 1000× magnification, after visual analysis. Vessel density was estimated on CD34-stained sections as the average number of vessel structures in at least 5 microscopic fields, at 400× magnification, using a square grid.
Microglia/macrophages and reactive astrocytes were quantified by manual cell counts as the average number of positive cells on Iba-1-, CD68- and GFAP-stained sections, respectively, in 5 microscopic fields, per 400× magnification.
All the above mentioned qualitative and quantitative assessments were performed on each biopsy specimen and on the removed solid tumor.
In vitro cultures
Fresh surgical tissue from each biopsy specimen was processed for in vitro culture as previously described [67]. Culture conditions were: Dulbecco’s modified Eagle’s medium (DMEM)/F-12 supplemented with 20 ng/mL epidermal growth factor (EGF) and 10 ng/mL basic fibroblast growth factor (bFGF) for NS development and DMEM supplemented with 10% fetal bovine serum (FBS) for AC development. Cell cultures were maintained at 37°C in a 5% O2 and 5% CO2 humidified atmosphere. The NS ability to self-renewal, multipotency, clonogenicity and tumorigenicity was assessed as in literature [67].
Cell line authentication from the respective solid tumor was obtained by Short Tandem Repeat (STR) profiling.
Experiments on cell lines were carried out with cells from passages 10−20. Cell lines were monthly checked for Mycoplasma contamination before the experimental use (e-MycoTM Mycoplasma PCR Detection kit, iNtRON Biotechnology, Korea).
IF
IF on cell lines was performed with the primary antibodies listed in Table 6. The secondary antibodies used were Alexa Fluor®488-conjugated AffiniPure goat anti-rabbit IgG and Alexa Fluor® 594-conjugated AffiniPure rabbit anti-mouse IgG (Jackson Immuno Research Laboratories Inc., West Grove, PA, USA). Cell nuclei were counterstained with 4’,6-diamidine-2’-phenylindole, dihydrochloride (DAPI). Images were obtained on a Zeiss Axioskop fluorescence microscope (Carl Zeiss, Oberkochen, Germany) equipped with an AxioCam MRc 5 digital camera and coupled to an imaging system (AxioVision Release 4.5, Zeiss).
Molecular genetics
Genomic DNA (gDNA) from frozen biopsy specimens and cell lines was isolated using the QIAamp DNA Mini kit (Qiagen Inc., Valencia, CA, USA), according to the manufacturer’s instructions. Constitutive gDNA was isolated from peripheral blood by a salting-out procedure.
Molecular genetics analysis was performed on the removed tumor, on each biopsy specimen and on relevant cell lines. Technical procedures were previously published [67, 80, 81].
Allelic imbalances in selected regions (9p, 10q and 17p) were determined by LOH analyses of highly polymorphic microsatellite markers [67]. Fragment analysis and capillary electrophoresis (CE) were performed on an ABI® 3130 Genetic Analyzer (Life Technologies). Data were collected by Gene Mapper v4.0 software (Life Technologies).
The EGFR gene amplification status (GenBank accession no. NM_005228) was assessed as previously reported [67].
Methylation specific-Polymerase Chain Reaction (MS-PCR) followed by frament analysis etc and CE was used to determine the MGMT promoter hypermethylation status (GenBank accession no. NM_002412). Primer sequences for MS-PCR and amplification conditions were previously reported [80].
TERT (minimal promoter region) (GenBank accession no. NM_198253), PTEN (exons 1 to 9) (GenBank accession no. NM_000314), TP53 (exons 2 to 11) (GenBank accession no. NM_000546), IDH1 R132 (exon 4) (GenBank accession no. NM_005896) and IDH2 R172 (exon 4) (GenBank accession no. NM_002168) hot-spot codons were amplified by PCR and searched for mutations by Sanger direct sequencing, as published [67, 81]. Cycle sequencing was performed using the BigDye® Terminator v1.1 Cycle Sequencing Kit (Life Technologies). The analysis software was Sequencing Analysis v5.3.1 (Life Technologies). The reported nucleotide and amino acid numbering is relative to the transcription start site (+1) corresponding to the A of the ATG on the GenBank reference sequences and according to the HUGO Gene Nomenclature.
Statistical methods
Data were checked for Normality by skewness and kurtosis tests. The variations of each neuroimaging parameter were measured determining the median and the range of values observed for each biopsy specimen.
In order to investigate the correlation among the values of MRI and 18F-FDG PET/CT parameters, a linear mixed-effects model was used. Beta represents a measure of how strongly each predictor variable influences the criterion (dependent) variable.
Further, two hierarchical linear models were applied to verify the relationship between the Ki-67/MIB-1 LI and the MRI parameters and to assess the relationship between the intensity of 18F-FDG PET/CT signal and the distance from the CE region.
The level of significance was set at p ≤ 0.05. Statistical analysis was performed using the STATA 13.1 software (StataCorp. LP, College Station, TX, USA).
CONCLUSIONS
The combined use of conventional and advanced MRI with 18F-FDG PET/CT allows identifying different areas of malignant gliomas and to confer them a biological significance. Some parameters (rCBV, Cho/Cr, Cho/NAA and 18F-FDG SUVmax) have a genetic and histopathological correspondence, at least in the CE region. It is then possible to recognize the most malignant areas of the tumor and to detect neoangiogenesis with reliability. However, mild infiltration, especially in edematous tissue, still remains of difficult detection although 18F-FDG SUVmax, Cho/Cr and Cho/NAA ratio are the most suitable parameters to be considered.
The study of tumor heterogeneity on multiple specimens using a frameless image-guided stereotactic navigation system provides very useful information in spite of still persisting technical pitfalls. A prospective observational clinical study (FRONTIER study) has been recently planned to determine the diagnostic accuracy of combined MRI and PET on diffuse gliomas by serial image-guided biopsies in relation to their histopathological and molecular features [78].
Abbreviations
GB: glioblastoma; MRI: magnetic resonance imaging; MRSI: magnetic resonance spectroscopic imaging; 18F-FDG SUVmax PET/CT: 2-[18F]-fluoro-2-deoxy-D-glucose maximum standardized uptake value positron emission tomography/computed tomography; CE: contrast enhanced; NE: non-contrast enhanced; rCBV: relative cerebral blood volume; Cho/Cr: Choline/Creatine ratio; Cho/NAA: Choline/N-acetylaspartate ratio; LL: Lipids/Lactate ratio; ADC: apparent diffusion coefficient; FA: fractional anisotropy; GSCs: glioblastoma stem cells.
Author contributions
DS was the designer, supervisor and neuropathologist; MCV was the radiologist who performed MRI/MRSI and the transfer of data to the surgical navigation device; MM contributed with the genetic analysis; LA carried out the in vitro cultures, together with TD; AC contributed with 18F-FDG PET/CT procedure, together with PCF; AM was the neurosurgeon who operated the patients; PC was the pathologist who provided the histological diagnosis of the surgical specimens; CC and SG contributed with IF experiments; CM provided the statistical evaluation.
CONFLICTS OF INTEREST
The authors declare no conflicts of interest.
FUNDING
This work was supported by Compagnia di San Paolo (Turin, Italy) (Grant N° 4011 SD/cv 2011-0438) and Fondazione Cassa di Risparmio (Vercelli, Italy).
REFERENCES
1. Coons SW, Johnson PC, Scheithauer BW, Yates AJ, Pearl DK. Improving diagnostic accuracy and interobserver concordance in the classification and grading of primary gliomas. Cancer. 1997; 79:1381–1393.
2. Schiffer D. Brain Tumor Pathology. Current Diagnostic Hotspots and Pitfalls. 2006, Springer: Dordrecht, The Netherlands. p. 1–272.
3. Stadlbauer A, Prante O, Nimsky C, Salomonowitz E, Buchfelder M, Kuwert T, Linke R, Ganslandt O. Metabolic imaging of cerebral gliomas: spatial correlation of changes in O-(2-18F-fluoroethyl)-L-tyrosine PET and proton magnetic resonance spectroscopic imaging. J Nucl Med. 2008; 49:721–729.
4. Di Costanzo A, Scarabino T, Trojsi F, Popolizio T, Catapano D, Giannatempo GM, Bonavita S, Portaluri M, Tosetti M, d'Angelo VA, Salvolini U, Tedeschi G. Proton MR spectroscopy of cerebralgliomasat 3 T: spatialheterogeneity, and tumour grade and extent. EurRadiol. 2008; 18:1727–1735.
5. Chen W. Clinical applications of PET in brain tumors. J Nucl Med. 2007; 48:1468–1481.
6. Barajas RF Jr, Hodgson JG, Chang JS, Vandenberg SR, Yeh RF, Parsa AT, McDermott MW, Berger MS, Dillon WP, Cha S. Glioblastoma multiforme regional genetic and cellular expression patterns: influence on anatomic and physiologic MR imaging. Radiology. 2010; 254:564–576.
7. Barajas RF Jr, Phillips JJ, Parvataneni R, Molinaro A, Essock-Burns E, Bourne G, Parsa AT, Aghi MK, McDermott MW, Berger MS, Cha S, Chang SM, Nelson SJ. Regional variation in histopathologic features of tumor specimens from treatment-naive glioblastoma correlates with anatomic and physiologic MR Imaging. Neuro Oncol. 2012; 14:942–954.
8. Barajas RFJr, Cha S. Benefits of dynamic susceptibility-weighted contrast-enhanced perfusion MRI for glioma diagnosis and therapy. CNS Oncol. 2014; 3:407–419.
9. Fudaba H, Shimomura T, Abe T, Matsuta H, Momii Y, Sugita K, Ooba H, Kamida T, Hikawa T, Fujiki M. Comparison of multiple parameters obtained on 3T pulsed arterial spin-labeling, diffusion tensor imaging, and MRS and the Ki-67 labeling index in evaluating glioma grading. AJNR Am J Neuroradiol. 2014; 35:2091–2098.
10. Jackson M, Ganel R, Rothstein JD. Models of amyotrophic lateral sclerosis. Curr Protoc Neurosci. 2002; Chapter 9:Unit 9.13.
11. Law M, Yang S, Wang H, Babb JS, Johnson G, Cha S, Knopp EA, Zagzag D. Glioma grading: sensitivity, specificity, and predictive values of perfusion MR imaging and proton MR spectroscopic imaging compared with conventional MR imaging. AJNR Am J Neuroradiol. 2003; 24:1989–1998.
12. Maia AC Jr, Malheiros SM, da Rocha AJ, da Silva CJ, Gabbai AA, Ferraz FA, Stávale JN. MR cerebral blood volume maps correlated with vascular endothelial growth factor expression and tumor grade in non-enhancing gliomas. AJNR Am J Neuroradiol. 2005; 26:777–783.
13. Cha S, Lupo JM, Chen MH, Lamborn KR, McDermott MW, Berger MS, Nelson SJ, Dillon WP. Differentiation of glioblastoma multiforme and single brain metastasis by peak height and percentage of signal intensity recovery derived from dynamic susceptibility-weighted contrast-enhanced perfusion MR imaging. AJNR Am J Neuroradiol. 2007; 28:1078–1084.
14. Kitis O, Altay H, Calli C, Yunten N, Akalin T, Yurtseven T. Minimum apparent diffusion coefficients in the evaluation of brain tumors. Eur J Radiol. 2005; 55:393–400.
15. Server A, Graff BA, Josefsen R, Orheim TE, Schellhorn T, Nordhøy W, Nakstad PH. Analysis of diffusion tensor imaging metrics for glioma grading at 3 T. Eur J Radiol. 2014; 83:e156–e165.
16. Cha S. Update on brain tumor imaging: from anatomy to physiology. AJNR Am J Neuroradiol. 2006; 27:475–487.
17. Law M, Young R, Babb J, Rad M, Sasaki T, Zagzag D, Johnson G. Comparing perfusion metrics obtained from a single compartment versus pharmacokinetic modeling methods using dynamic susceptibility contrast-enhanced perfusion MR imaging with glioma grade. AJNR Am J Neuroradiol. 2006; 27:1975–1982.
18. White ML, Zhang Y, Yu F, Jaffar Kazmi SA. Diffusion tensor MR imaging of cerebral gliomas: evaluating fractional anisotropy characteristics. AJNR Am J Neuroradiol. 2011; 32:374–381.
19. Patronas NJ, Di Chiro G, Brooks RA, DeLaPaz RL, Kornblith PL, Smith BH, Rizzoli HV, Kessler RM, Manning RG, Channing M, Wolf AP, O'Connor CM. Work in progress: [18F] fluorodeoxyglucose and positron emission tomography in the evaluation of radiation necrosis of the brain. Radiology. 1982; 144:885–889.
20. Cistaro A, Quartuccio N, Vesco S, Pagani M, Fania P, Donati L, Nobili FM, Duca S, Carrara G, Valentini MC. Positron emission tomography. Ophthalmology. 2012; 119:1496–1497.
21. Di Chiro G, De La Paz RL, Brooks RA, Sokoloff L, Kornblith PL, Smith BH, Patronas NJ, Kufta CV, Kessler RM, Johnston GS, Manning RG, Wolf AP. Glucose utilization of cerebral gliomas measured by [18F] fluorodeoxyglucose and positron emission tomography. Neurology. 1982; 32:1323–1329.
22. Cistaro A. Atlas of PET/CT in Pediatric Patients. 2014, Springer: Milano, Italy. p. 1–264.
23. Cistaro A, Quartuccio N, Mojtahedi A, Fania P, Filosso PL, Campenni A, Ficola U, Baldari S. Prediction of 2 years-survival in patients with stage I and II non-small cell lung cancer utilizing (18)F-FDG PET/CT SUV quantification. Radiol Oncol. 2013; 47:219–223.
24. Singhal T, Narayanan TK, Jacobs MP, Bal C, Mantil JC. 11C-methionine PET for grading and prognostication in gliomas: a comparison study with 18F-FDG PET and contrast enhancement on MRI. J Nucl Med. 2012; 53:1709–1715.
25. Schiffer D, Valentini MC, Melcarne A, Mellai M, Prodi E, Carrara G, Denysenko T, Junemann C, Casalone C, Corona C, Caldera V, Annovazzi L, Piazzi A, et al. Spatial Relationships of MR Imaging and Positron Emission Tomography with Phenotype, Genotype and Tumor Stem Cell Generation in Glioblastoma Multiforme. In: Tumors of the Central Nervous System – Primary and Secondary. 2014, InTech: Rijeka, Croatia. p. 63–93.
26. Apuzzo ML, Chandrasoma PT, Cohen D, Zee CS, Zelman V. Computed imaging stereotaxy: experience and perspective related to 500 procedures applied to brain masses. Neurosurgery. 1987; 20:930–937.
27. Germano IM, Sperber EF. Transplacentally induced neuronal migration disorders: an animal model for the study of the epilepsies. J Neurosci Res. 1998; 51:473–488.
28. Paleologos TS, Dorward NL, Wadley JP, Thomas DG. Clinical validation of true frameless stereotactic biopsy: analysis of the first 125 consecutive cases. Neurosurgery. 2001; 49:830–835.
29. Frati A, Pichierri A, Bastianello S, Raco A, Santoro A, Esposito V, Giangaspero F, Salvati M. Framelessstereotacticcerebralbiopsy: ourexperience in 296 cases. Stereotact Funct Neurosurg. 2011; 89:234–245.
30. Hu LS, Eschbacher JM, Dueck AC, Heiserman JE, Liu S, Karis JP, Heiserman JE, Liu S, Karis JP, Smith KA, Shapiro WR, Pinnaduwage DS, Coons SW, et al. Correlations between perfusion MR imaging cerebral blood volume, microvessel quantification, and clinical outcome using stereotactic analysis in recurrent high-grade glioma. AJNR Am J Neuroradiol. 2012; 33:69–76.
31. Zukotynski K, Fahey F, Kocak M, Kun L, Boyett J, Fouladi M, Vajapeyam S, Treves T, Poussaint TY. 18F-FDG PET and MR imaging associations across a spectrum of pediatric brain tumors: a report from the pediatric brain tumor consortium. J Nucl Med. 2014; 55:1473–1480.
32. Borgwardt L, Højgaard L, Carstensen H, Laursen H, Nowak M, Thomsen C, Schmiegelow K. Increased fluorine-18 2-fluoro-2-deoxy-D-glucose (FDG) uptake in childhood CNS tumors is correlated with malignancy grade: a study with FDG positron emission tomography/magnetic resonance imaging coregistration and image fusion. J Clin Oncol. 2005; 23:3030–3037.
33. Herholz K, Pietrzyk U, Voges J, Schröder R, Halber M, Treuer H, Sturm V, Heiss WD. Correlation of glucose consumption and tumor cell density in astrocytomas. A stereotactic PET study. J Neurosurg. 1993; 79:853–858.
34. Deng SM, Zhang W, Zhang B, Chen YY, Li JH, Wu YW. Correlation between the uptake of 18F-Fluorodeoxyglucose (18F-FDG) and the expression of proliferation-associated antigenKi-67 in cancer patients: a meta-analysis. PLoS One. 2015; 10:e0129028.
35. Yin Y, Tong D, Liu XY, Yuan TT, Yan YZ, Ma Y, Zhao R. Correlation of apparent diffusion coefficient with Ki-67 in the diagnosis of gliomas. Zhongguo Yi Xue Ke Xue Yuan Xue Bao. 2012; 34:503–508.
36. Zikou AK, Alexiou GA, Kosta P, Goussia A, Astrakas L, Tsekeris P, Voulgaris S, Malamou-Mitsi V, Kyritsis AP, Argyropoulou MI. Diffusion tensor and dynamic susceptibility contrast MRI in glioblastoma. Clin Neurol Neurosurg. 2012; 114:607–612.
37. Kalpathy-Cramer J, Gerstner ER, Emblem KE, Andronesi OC, Rosen B. Advanced magnetic resonance imaging of the physical processes in human glioblastoma. Cancer Res. 2014; 74:4622–4637.
38. Rakheja R, Chandarana H, DeMello L, Jackson K, Geppert C, Faul D, Glielmi C, Friedman KP. Correlation between standardized uptake value and apparent diffusion coefficient of neoplastic lesions evaluated with whole-body simultaneous hybrid PET/MRI. AJR Am J Roentgenol. 2013; 201:1115–1119.
39. Piyapittayanan S, Chawalparit O, Tritakarn SO, Witthiwej T, Sangruchi T, Nunta-Aree S, Sathornsumetee S, Itthimethin P, Komoltri C. Value of diffusion tensor imaging in differentiating high-grade from low-grade gliomas. J Med Assoc Thai. 2013; 96:716–721.
40. Alexiou GA, Zikou A, Tsiouris S, Goussia A, Kosta P, Papadopoulos A, Voulgaris S, Kyritsis AP, Fotopoulos AD, Argyropoulou MI. Correlation of diffusion tensor, dynamic susceptibility contrast MRI and (99m)Tc-Tetrofosmin brain SPECT with tumour grade and Ki-67 immunohistochemistry in glioma. Clin Neurol Neurosurg. 2014; 116:41–45.
41. Tykocinski ES, Grant RA, Kapoor GS, Krejza J, Bohman LE, Gocke TA, Chawla S, Halpern CH, Lopinto J, Melhem ER, O'Rourke DM. Use of magnetic perfusion-weighted imaging to determine epidermal growth factor receptor variant III expression in glioblastoma. Neuro Oncol. 2012; 14:613–623.
42. Young RJ, Gupta A, Shah AD, Graber JJ, Schweitzer AD, Prager A, Shi W, Zhang Z, Huse J, Omuro AM. Potential role of preoperative conventional MRI including diffusion measurements in assessing epidermal growth factor receptor gene amplification status in patients with glioblastoma. AJNR Am J Neuroradiol. 2013; 34:2271–2277.
43. Mellinghoff IK, Wang MY, Vivanco I, Haas-Kogan DA, Zhu S, Dia EQ, Lu KV, Yoshimoto K, Huang JH, Chute DJ, Riggs BL, Horvath S, Liau LM, et al. Molecular determinants of the response of glioblastomas to EGFR kinase inhibitors. N Engl J Med. 2005; 353:2012–2024.
44. Pope WB, Lai A, Mehta R, Kim HJ, Qiao J, Young JR, Xue X, Goldin J, Brown MS, Nghiemphu PL, Tran A, Cloughesy TF. Apparent diffusion coefficient histogram analysis stratifies progression-free survival in newly diagnosed bevacizumab-treated glioblastoma. AJNR Am J Neuroradiol. 2011; 32:882–889.
45. Lathia JD, Gallagher J, Myers JT, Li M, Vasanji A, McLendon RE, Hjelmeland AB, Huang AY, Rich JN. Direct in vivo evidence for tumor propagation by glioblastoma cancer stem cells. PLoS One. 2011; 6:e24807.
46. Mazzoleni S, Galli R. Gliomagenesis: a game played by few players or a team effort? Front Biosci (Elite Ed). 2012; 4:205–213.
47. Hu LS, Ning S, Eschbacher JM, Baxter LC, Gaw N, Ranjbar S, Plasencia J, Dueck AC, Peng S, Smith KA, Nakaji P, Karis JP, Quarles CC, et al. Radiogenomics to characterize regional genetic heterogeneity in glioblastoma. Neuro Oncol. 2017; 19:128–137.
48. Selker RG, Mendelow H, Walker M, Sheptak PE, Phillips JG. Pathological correlation of CT ring in recurrent, previously treated gliomas. Surg Neurol. 1982; 17:251–254.
49. Kelly PJ, Daumas-Duport C, Kispert DB, Kall BA, Scheithauer BW, Illig JJ. Imaging-based stereotaxic serial biopsies in untreated intracranial glial neoplasms. J Neurosurg. 1987; 66:865–874.
50. Watanabe M, Tanaka R, Takeda N. Magnetic resonance imaging and histopathology of cerebral gliomas. Neuroradiology. 1992; 34:463–469.
51. Ramakrishna R, Barber J, Kennedy G, Rizvi A, Goodkin R, Winn RH, Ojemann GA, Berger MS, Spence AM, Rostomily RC. Imaging features of invasion and preoperative and postoperative tumor burden in previously untreated glioblastoma: correlation with survival. Surg Neurol Int. 2010; 1.
52. Engelhorn T, Savaskan NE, Schwarz MA, Kreutzer J, Meyer EP, Hahnen E, Ganslandt O, Dörfler A, Nimsky C, Buchfelder M, Eyüpoglu IY. Cellular characterization of the peritumoral edema zone in malignant brain tumors. Cancer Sci. 2009; 100:1856–1862.
53. Law M, Cha S, Knopp EA, Johnson G, Arnett J, Litt AW. High-grade gliomas and solitary metastases: differentiation by using perfusion and proton spectroscopic MR imaging. Radiology. 2002; 222:715–721.
54. Nelson SJ. Multivoxel magnetic resonance spectroscopy of brain tumors. Mol Cancer Ther. 2003; 2:497–507.
55. Schiffer D, Mellai M, Annovazzi L, Caldera V, Piazzi A, Denysenko T, Melcarne A. Stem cell niches in glioblastoma: a neuropathological view. Biomed Res Int. 2014; 2014:725921.
56. Price SJ, Gillard JH. Imaging biomarkers of brain tumour margin and tumour invasion. Br J Radiol. 2011; 84:S159–S167.
57. Pauleit D, Langen KJ, Floeth F, Hautzel H, Riemenschneider MJ, Reifenberger G, Shah NJ, Müller HW. Can the apparent diffusion coefficient be used as a noninvasive parameter to distinguish tumor tissue from peritumoral tissue in cerebral gliomas? J Magn Reson Imaging. 2004; 20:758–764.
58. Price SJ, Jena R, Burnet NG, Carpenter TA, Pickard JD, Gillard JH. Predicting patterns of glioma recurrence using diffusion tensor imaging. Eur Radiol. 2007; 17:1675–1684.
59. McKnight TR, von dem Bussche MH, Vigneron DB, Lu Y, Berger MS, McDermott MW, Dillon WP, Graves EE, Pirzkall A, Nelson SJ. Histopathological validation of a three-dimensional magnetic resonance spectroscopy index as a predictor of tumor presence. J Neurosurg. 2002; 97:794–802.
60. Croteau D, Scarpace L, Hearshen D, Gutierrez J, Fisher JL, Rock JP, Mikkelsen T. Correlation between magnetic resonance spectroscopy imaging and image-guided biopsies: semiquantitative and qualitative histopathological analyses of patients with untreated glioma. Neurosurgery. 2001; 49:823–829.
61. Pirzkall A, Li X, Oh J, Chang S, Berger MS, Larson DA, Verhey LJ, Dillon WP, Nelson SJ. 3D MRSI for resected high-grade gliomas before RT: tumor extent according to metabolic activity in relation to MRI. Int J Radiat Oncol Biol Phys. 2004; 59:126–137.
62. Stadlbauer A, Nimsky C, Buslei R, Pinker K, Gruber S, Hammen T, Buchfelder M, Ganslandt O. Proton magnetic resonance spectroscopic imaging in the border zone of gliomas: correlation of metabolic and histological changes at low tumor infiltration--initial results. Invest Radiol. 2007; 42:218–223.
63. Pallini R, Ricci-Vitiani L, Banna GL, Signore M, Lombardi D, Todaro M, Stassi G, Martini M, Maira G, Larocca LM, De Maria R. Cancer stem cell analysis and clinical outcome in patients with glioblastoma multiforme. Clin Cancer Res. 2008; 14:8205–8212.
64. Piccirillo SG, Combi R, Cajola L, Patrizi A, Redaelli S, Bentivegna A, Baronchelli S, Maira G, Pollo B, Mangiola A, Di Meco F, Dalprà L, Vescovi AL. Distinct pools of cancer stem-like cells coexist within human glioblastomas and display different tumorigenicity and independent genomic evolution. Oncogene. 2009; 28:1807–1811.
65. Persano L, Rampazzo E, Della Puppa A, Pistollato F, Basso G. The three-layer concentric model of glioblastoma: cancer stem cells, microenvironmental regulation, and therapeutic implications. Sci World J. 2011; 11:1829–1841.
66. Schiffer D, Mellai M, Annovazzi L, Casalone C, Cassoni P. Tumor Microenvironment: Perivascular and Perinecrotic Niches. In: Molecular Considerations and Evolving Surgical Management Issues in the Treatment of Patients with a Brain Tumor. 2015, InTech: Rijeka, Croatia. p. 49–82.
67. Caldera V, Mellai M, Annovazzi L, Piazzi A, Lanotte M, Cassoni P, Schiffer D. Antigenic and genotypic similarity between primary glioblastomas and their derived neurospheres. J Oncol. 2011; 2011:314962.
68. Caldera V, Mellai M, Annovazzi L, Monzeglio O, Piazzi A, Schiffer D. MGMT hypermethylation and MDR system in glioblastoma cancer stem cells. Cancer Genomics Proteomics. 2012; 9:171–178.
69. Galli R. The neurosphere assay applied to neural stem cells and cancer stem cells. Methods Mol Biol. 2013; 986:267–277.
70. Hirschmann-Jax C, Foster AE, Wulf GG, Nuchtern JG, Jax TW, Gobel U, Goodell MA, Brenner MK. A distinct “side population” of cells with high drug efflux capacity in human tumor cells. Proc Natl Acad Sci U S A. 2004; 101:14228–14233.
71. Anderson SA, Glod J, Arbab AS, Noel M, Ashari P, Fine HA, Frank JA. Noninvasive MR imaging of magnetically labeled stem cells to directly identify neovasculature in a glioma model. Blood. 2005; 105:420–425.
72. Vescovi AL, Galli R, Reynolds BA. Brain tumour stem cells. Nat Rev Cancer. 2006; 6:425–436.
73. Schiffer D, Mellai M, Annovazzi L, Piazzi A, Monzeglio O, Caldera V. Glioblastoma cancer stem cells: basis for a functional hypothesis. Stem Cell Discovery. 2012; 2:122–131.
74. Safa AR, Saadatzadeh MR, Cohen-Gadol AA, Pollok KE, Bijangi-Vishehsaraei K. Glioblastoma stem cells (GSCs) epigenetic plasticity and interconversion between differentiated non-GSCs and GSCs. Genes Dis. 2015; 2:152–163.
75. Schiffer D, Annovazzi L, Cassoni P, Valentini MC, Mazzucco M, Mellai M. Glioblastoma stem cells: conversion or reprogramming from tumor non-stem cells? J Stem Cell Res Ther. 2015; 5:11.
76. Schiffer D, Annovazzi L, Mazzucco M, Mellai M. The microenvironment in gliomas: phenotypic expressions. Cancers (Basel). 2015; 7:2352–2359.
77. Schiffer D, Annovazzi L, Mellai M. Tumor stem cells and the microenvironment in glioblastoma. J Carcinog Mutagen. 2016, 7:2.
78. Verburg N, Pouwels PJ, Boellaard R, Barkhof F, Hoekstra OS, Reijneveld JC, Vandertop WP, Wesseling P, de Witt Hamer PC. Accurate delineation of glioma infiltration by advanced PET/MR neuro-imaging (FRONTIER Study): a diagnostic study protocol. Neurosurgery. 2016; 79:535–540.
79. Louis DN, Ohgaki H, Wiestler OD, Cavenee WK, Ellison DW, Figarella-Branger D, Perry A, Reifenberger G, von Deimling A. WHO Classification of Tumours of the Central Nervous System (revised 4th ed). 2016, IARC Press: Lyon, France. p. 1–408.
80. Mellai M, Monzeglio O, Piazzi A, Caldera V, Annovazzi L, Cassoni P, Valente G, Cordera S, Mocellini C, Schiffer D. MGMT promoter hypermethylation and its associations with genetic alterations in a series of 350 brain tumors. J Neurooncol. 2012; 107:617–631.
81. Mellai M, Piazzi A, Caldera V, Monzeglio O, Cassoni P, Valente G, Schiffer D. IDH1 and IDH2 mutations, immunohistochemistry and associations in a series of brain tumors. J Neurooncol. 2011; 105:345–357.