
INTRODUCTION
Benzene is recognized as a human carcinogen, which is a widely used occupational harmful factor in industry [1]. The international agency for research on cancer confirms that benzene is a human cause of leukemia, and hematopoietic system is the target organ of benzene toxicity [2]. Hydroquinone (HQ) is an alternative to benzene in vitro. Moreover, a case of acute myeloid leukemia (AML) caused by exposure to HQ for 16 years has been reported recently [3]. Several studies have reported that short-term exposure to HQ induced oxidative DNA damage and apoptosis [4]. Our previous research found that long-term exposure to HQ could result in transforming capability in vitro and the tumorigenesis capability in vivo [5]. Furthermore, our data have shown that HQ-induced activation of myeloproliferative leukemia virus oncogene was connected with DNA hypomethylation [6]. Thus it can be seen that HQ poses a great threat to human health in the case of unavoidable contact. Making an intensive study on the mechanisms of HQ toxicity is helpful for the early diagnosis and therapy of leukemia. There is an urgent need to improve early detection and identify new targets for therapy.
Long noncoding RNAs (lncRNAs) are defined as newly-identified class of noncoding RNAs (ncRNAs) longer than 200 nucleotides, which were regarded as transcription noise for lacking of open reading frame (ORF) and non-protein coding function [7–9]. Accumulating evidences have indicated that an increased abundance of lncRNAs participating in a variety of biological processes, such as transcription, splicing, translation, chromatin modification, cell growth, cell cycle regulation, apoptosis [10, 11, 8]. Meanwhile, several authors have proposed that lncRNAs can be used as competing endogenous RNAs (ceRNAs) to competitively sponge miRNAs to regulate target genes [12, 13]. With the maturity of the sequencing platform, more and more unknown lncRNAs have entered the academic field of view and attracted the interest of researchers. According to LNCipedia 4.1, the latest version of this long non-coding RNA database contains 146,742 human annotated lncRNAs. Several researchers have revealed that lncRNAs were dysregulated in blood samples of leukemia patients (in vivo) and leukemia cells (in vitro), which involved in hematopoietic system toxicity [14, 15]. To some extent, lncRNAs as the biomarkers of disease diagnosis and prognosis have become an integral part of the study. Scholars will uncover the mystery of lncRNAs and tap its little-known functions gradually.
With the depth and development of researches, the study of lncRNAs has gradually shifted from human diseases to environmental exogenous chemicals. In this study, we performed profiles of differentially expressed lncRNAs and mRNAs in 2 pairs of low dose experimental group (HQ 20 μmol/L) and control group (PBS) (repeat 3 times). We also established co-expression networks for differentially expressed lncRNAs and mRNAs, with a view to comprehensively investigating the biological functions of lncRNAs. In addition, we have found several new lncRNAs that have not yet been annotated in major databases, suggesting that there is a possibility of a major breakthrough.
RESULTS
Total RNA purity, concentration and quality identification of samples
PBS and HQ (20 μmol/L) treated TK6 cells in a total of two sets (3 replicates per group) in our study. Quality inspection results have shown that the total RNA purity (A260/A280) of all samples was about 2.0 (Table 1), indicating that there was no protein residue. After the denatured RNA electrophoresis of the total RNA, the bands were clearly observed on the gel imaging system, indicating that the quality of the total RNA was good, and there was no obvious degradation (Figure 1). To sum up, all total RNA were suitable for further analysis.
Table 1: All samples of total RNA quality test results
Sample ID |
Sample name |
K5500 |
AGE |
Agilent 2200 |
Detection conclusion |
|||
|---|---|---|---|---|---|---|---|---|
OD260/280 |
OD260/230 |
Total amount (ug) |
RIN |
28S/18S |
||||
1 |
T-PBS |
1.87 |
2.00 |
15.99 |
pass |
10.0 |
3.2 |
A |
2 |
T-PBS-6.21 |
1.85 |
1.91 |
21.04 |
pass |
10.0 |
3.0 |
A |
3 |
T-PBS-6.23 |
1.90 |
2.04 |
28.88 |
pass |
10.0 |
3.4 |
A |
4 |
T-20 |
1.79 |
2.05 |
16.38 |
pass |
10.0 |
3.4 |
A |
5 |
T-20-6.21 |
1.90 |
1.64 |
22.50 |
pass |
10.0 |
2.3 |
A |
6 |
T-20-6.23 |
1.84 |
1.98 |
23.53 |
pass |
10.0 |
2.8 |
A |
T-PBS, T-PBS-6.21, T-PBS-6.23: PBS solvent control group (3 replicates).
T-20, T-20-6.21, T-20-6.23: 20 μmol/LHQ experimental group (3 repetitions).
A: Indicating that the sample qualified to meet the requirements of the construction of two libraries.
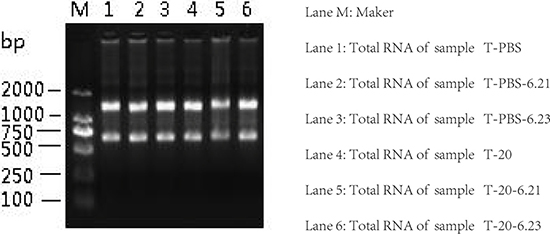
Figure 1: Total RNA agarose gel electrophoresis.
Differentially expressed lncRNAs and mRNAs in TK6 cells exposed to low dose HQ
Integration of RNA-seq data is available that 65 differentially expressed lncRNAs from 30632 lncRNAs were statistically significant (FC ≥ 2.0, P < 0.05). Among them, 40 lncRNAs were high expression (upregulated) and 25 lncRNAs were low expression (downregulated) (Figure 2A, 2C). We screened 10 lncRNAs with large changes and statistically significant in expression for subsequent studies. Upregulated lncRNAs included LILRP2, LOC344887, LGALS9, HBBP1, ENSG00000270164.1 (LINC01480), while downregulated lncRNAs included C11orf92, LAMB2P1, LOC63930, SLC7A11-AS1, ENSG00000272259.1 (Table 2). Using the same standard as lncRNAs, 186 mRNAs were differentially expressed from 34791 mRNAs (FC ≥ 2.0, P < 0.05), including 170 upregulated mRNAs and 16 downregulated mRNAs (Figure 2B, 2D). 5 up and down regulated mRNAs are listed below, respectively (Table 3).
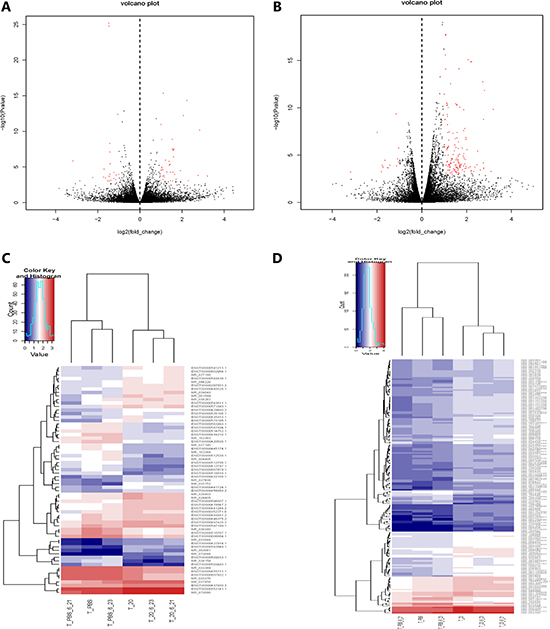
Figure 2: Gene expression profile differences between HQ group compared to PBS group. Volcano plots of the differentially expressed lncRNAs (A) and mRNAs (B). Dark dots represent lncRNAs/mRNAs not significantly differentially expressed (fold change < 2, P > 0.05) and red dots represent lncRNAs/mRNAs significantly differentially expressed (fold change ≥ 2, P < 0.05). Left and right indicate low and high expression, respectively. Hierarchical clustering indicates lncRNAs (C) and mRNAs (D) profiles. Red column indicates up regulation and blue column indicates down regulation, red through blue color indicates high to low expression level.
Table 2: The five statistically significantly up- and down-regulated lncRNAs
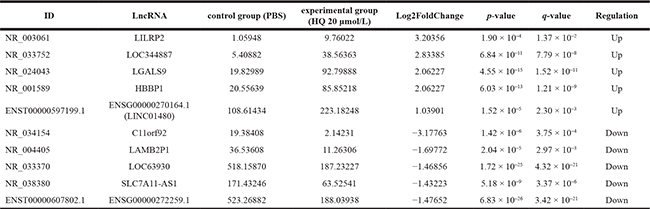
Table 3: The five statistically significantly up- and down-regulated mRNAs
ID |
mRNA |
control group (PBS) |
experimental group (HQ 20 μmol/L) |
Log2FoldChange |
p-value |
q-value |
Regulation |
|---|---|---|---|---|---|---|---|
NM_001633 |
AMBP |
25.70499 |
235.22885 |
3.19394 |
1.49 × 10⁻¹⁰ |
1.49 × 10⁻⁷ |
Up |
NM_178564 |
NRBP2 |
1.11449 |
9.53745 |
3.09722 |
5.40 × 10⁻⁴ |
3.07 × 10⁻² |
Up |
NM_198213 |
OASL |
7.02611 |
48.85791 |
2.79779 |
1.49 × 10⁻¹² |
2.87 × 10⁻⁹ |
Up |
NM_001142651 |
NEURL1B |
1.95092 |
13.25272 |
2.76406 |
2.27 × 10⁻⁴ |
1.58 × 10⁻² |
Up |
NM_001039775 |
AIM1L |
1.82081 |
12.31208 |
2.75742 |
2.90 × 10⁻⁴ |
1.89 × 10⁻² |
Up |
NM_000148 |
FUT1 |
38.96812 |
4.29962 |
-3.18001 |
6.11 × 10⁻⁴ |
3.38 × 10⁻² |
Down |
NM_144646 |
IGJ |
63.50211 |
15.99137 |
-1.98951 |
4.06 × 10⁻⁸ |
1.93 × 10⁻⁵ |
Down |
NM_022783 |
DEPTOR |
23.45508 |
6.72155 |
-1.80304 |
5.68 × 10⁻⁴ |
3.19 × 10⁻² |
Down |
NM_001142776 |
CHAC1 |
503.88556 |
147.97588 |
-1.76773 |
1.24 × 10⁻⁴ |
1.00 × 10⁻² |
Down |
NM_031479 |
INHBE |
935.28009 |
297.98525 |
-1.65016 |
3.61 × 10⁻⁵ |
4.29 × 10⁻³ |
Down |
Sequencing results validation
On the one hand, in order to validate the sequencing results, on the other hand, for the further in-depth research, we selected 10 differentially expressed lncRNAs and mRNAs of interest for qRT-PCR, respectively. Our results have shown that the changes were statistically different for only 7 of the 10 lncRNAs transcripts and 6 of the 10 mRNAs. Among 7 lncRNAs transcripts (c11orf92, ENSG00000272259.1, LILRP2, LOC344887, LGALS9, HBBP1 and ENSG00000270164.1), 5 lncRNAs transcripts (LILRP2, LOC344887, LGALS9, HBBP1 and ENSG00000270164.1) were same trend as the sequencing results. The sequencing data showed that the expression of C11orf92 and ENSG00000272259.1 were upregulated, while qRT-PCR was verified to be down-regulated. LILRP2, LOC344887, LGALS9, HBBP1, ENSG00000270164.1 (LINC01480) were upregulated as shown in the Figure 3A. And among 6 mRNAs (FUT1, INHBE, SLC7A11, MROH5, METTL7B and MDM2), the expression trends of 5 mRNAs (FUT1, INHBE, SLC7A11, MROH5 and MDM2) were consistent with the sequencing results (Figure 3B). In addition, the expression levels of LOC344887 and ENSG00000270164.1 (LINC01480) were validated by qRT-PCR at different concentrations of HQ (PBS, 10 μmol/L, 20 μmol/L, and 40 μmol/L). The results showed that the expression levels of LOC344887 and ENSG00000270164.1 (LINC01480) increased with the increase of HQ concentration after 24h or 48h in TK6 cells exposed to different concentrations HQ (Figure 3C, 3D).
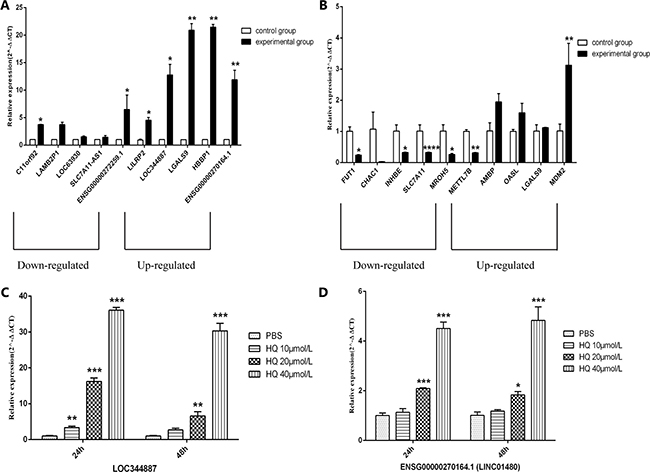
Figure 3: qRT-PCR validation of the sequencing results. qRT-PCR validation of 10 differentially expressed lncRNAs (A) and mRNAs (B). Control group represents PBS, experimental group represents HQ 20μmol/L. (A) Compared to control group, c11orf92, ENSG00000272259.1, LILRP2, LOC344887, LGALS9, HBBP1, ENSG00000270164.1 were significantly differentially expressed. Among them, LILRP2, LOC344887, LGALS9, HBBP1, ENSG00000270164.1 expression changes consistent with the sequencing results. (B) Compared to control group, FUT1, INHBE, SLC7A11, MROH5, METTL7B, MDM2 were significantly differentially expressed. Among them, FUT1, INHBE, SLC7A11, MROH5, MDM2 expression changes consistent with the sequencing results. The expressions of LOC344887 (C) and ENSG00000270164.1 (LINC01480) (D) were validated by qRT-PCR at different concentrations of HQ (24h and 48h). *P < 0.05, **P < 0.01, ***P < 0.001, ****P < 0.0001.
GO and KEGG pathway analysis
In general, lncRNAs played biological functions by co-expressed mRNAs because they have no ability to encode proteins. Thence, we used two enrichment analyses, GO and KEGG pathway analysis to predict the potential roles of dysregulated mRNAs. GO annotation results revealed 3 structured networks: biological processes (1065 GO Terms), cellular components (115 GO Terms) and molecular function (155 GO Terms). In 186 differentially expressed mRNAs, we selected 32 mRNAs for GO annotation and KEGG pathway analysis. Among 32 differentially expressed mRNAs, 16 mRNAs (GPR55, ARHGEF6, CDKN1A, NRBP2, LGALS9, GNG7, CHAC1, DEPTOR, MYOF, MDM2, AMBP, EDA2R, SERPINE1, PHLDA3, UNC13A and ZNF385A) participate in regulation of cell communication (biological process), 15 mRNAs (GPR55, ARHGEF6, CDKN1A, LGALS9, GNG7, CHAC1, DEPTOR, MYOF, MDM2, AMBP, EDA2R, SERPINE1, PHLDA3, UNC13A and ZNF385A) participate in regulation of signaling (biological process). 2 mRNAs (IGJ, AMBP) are involved in blood microparticle (cellular component), 4 mRNAs (STON2, ZNF385A, MDM2, OASL) are involved in nucleolus (cellular component). 2 mRNAs (MDM2, ZNF385A) are related to p53 binding (molecular function), 2 mRNAs (FUCA1, LGALS9) are related to monosaccharide binding (molecular function) (Figure 4A). KEGG database indicated the differentially expressed mRNAs mainly significantly participate in the following pathways: p53 signaling pathway (2 mRNAs: SERPINE1, MDM2), glycosphingolipid biosynthesis-globo series and Glycosphingolipid biosynthesis - lacto and neolacto series (1 mRNA: FUT1) and other glycan degradation (1 mRNA: FUCA1) and so on (Figure 4B).
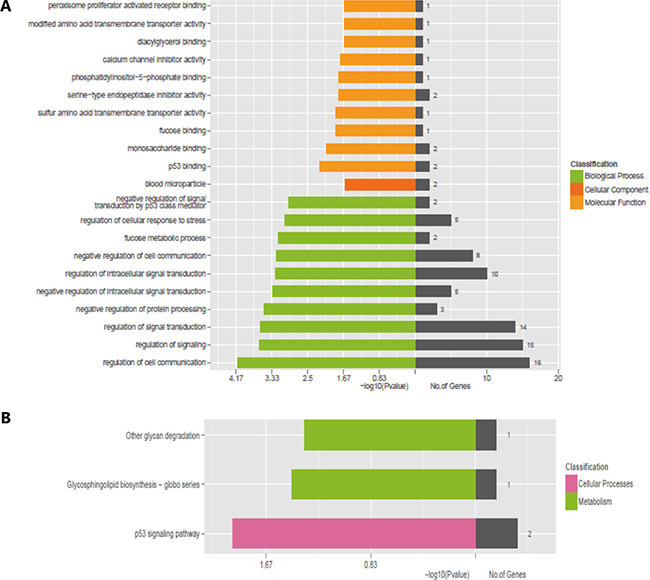
Figure 4: GO and KEGG pathway analysis for differentially expressed mRNAs. (A) GO analysis for differentially expressed mRNAs. (B) KEGG pathway analysis for differentially expressed mRNAs.
LncRNA-mRNA co-expression network analysis and lncRNAs target genes prediction
We screened 25 lncRNAs and 32 mRNAs to construct the lncRNA-mRNA co-expression network. We could see that a single lncRNA could be co-expressed with tens of the differentially expressed mRNA, we set a strict standard to build the most reliable lncRNA-mRNA co-expression pairs through the Pearson correlation value and p value (Figure 5A). In order to gain a better understanding of the biological functions of lncRNAs, we predicted the target genes of the dysregulated lncRNAs by target prediction softs. We selected 27 lncRNAs for target genes prediction, and the results showed that 18 lncRNAs had target genes and 9 had no target genes. Among 18 lncRNAs, 13 lncRNAs had cis target genes, and 5 lncRNAs had trans target genes (Figure 5B, Table 4).
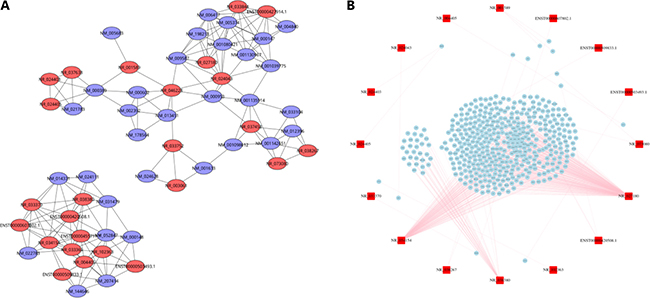
Figure 5: LncRNA-mRNA co-expression network and lncRNA target prediction. (A) LncRNA-mRNA co-expression network. The red circles represent lncRNAs and the purple rings represent mRNAs. (B) LncRNA target prediction. The red squares represent lncRNAs and the blue squares represent mRNAs. The pink lines represent the targeting relationship of lncRNA-mRNA.
Table 4: The statistical results of lncRNAs target genes
LncRNA |
Cis_Num |
Trans_Num |
|---|---|---|
NR_046228 |
0 |
0 |
NR_073080 |
0 |
2 |
NR_037195 |
0 |
0 |
NR_004405 |
1 |
0 |
NR_033752 |
0 |
0 |
NR_033844 |
0 |
0 |
NR_038380 |
1 |
35 |
NR_027180 |
0 |
280 |
NR_024405 |
1 |
0 |
NR_024403 |
1 |
0 |
NR_102363 |
1 |
0 |
NR_037638 |
0 |
0 |
NR_001589 |
3 |
0 |
NR_034154 |
2 |
137 |
NR_024043 |
1 |
0 |
NR_038267 |
2 |
0 |
NR_003061 |
0 |
0 |
NR_033369 |
0 |
0 |
NR_033370 |
1 |
0 |
NR_037458 |
0 |
0 |
ENST00000427914.1 |
0 |
0 |
ENST00000503493.1 |
1 |
0 |
ENST00000509833.1 |
1 |
0 |
ENST00000597199.1 |
0 |
0 |
ENST00000607802.1 |
1 |
0 |
ENST00000455711.1 |
0 |
0 |
ENST00000420508.1 |
0 |
3 |
New lncRNAs prediction
Besides the known lncRNAs, our sequencing results also included 11 new lncRNAs as shown in the following table (Table 5). Same as the known lncRNAs mentioned above, we also constructed the volcanic plot (Figure 6A) and the heat map (Figure 6B) of the differentially expressed new lncRNAs. From the table and the figures, we could see that 7 and 4 new lncRNAs are upregulated and downregulated, respectively.
Table 5: The statistically significantly up- and down-regulated new lncRNAs
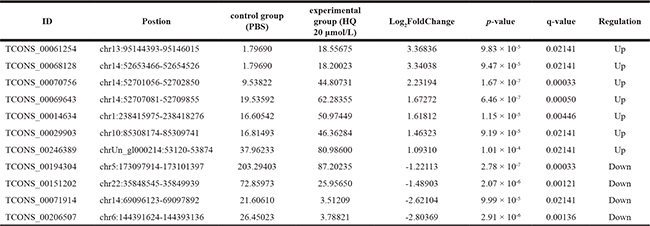
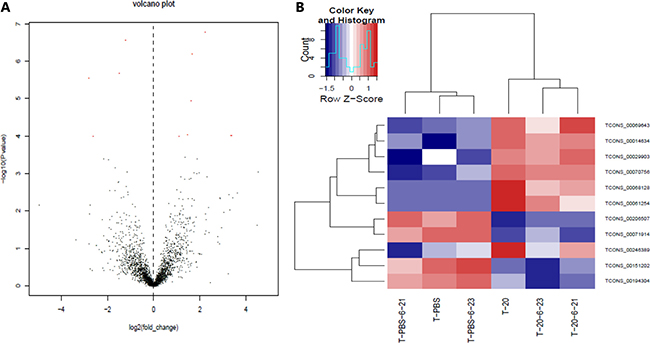
Figure 6: New lncRNAs expression profile differences between HQ group compared to PBS group. (A) Volcano plots of the differentially expressed new lncRNAs. The dark dots represent new lncRNAs not significantly differentially expressed (fold change < 2, P > 0.05) and red dots represent new lncRNAs significantly differentially expressed (fold change ≥ 2, P < 0.05). Left and right indicate up and down regulation. (B) Hierarchical clustering indicates new lncRNAs. Red through blue color indicates high to low expression level.
DISCUSSION
Up to this date, many studies have shown that lncRNAs played crucial biological roles in human diseases, such as cancer [16, 17], cardiovascular diseases [18] and neuropathic pain [19]. However, there are few studies about lncRNAs involving in exogenous compounds in the environment. Therefore, the study on functions and mechanisms of lncRNAs in this area is limited. In contrast to microarray, the next-generation sequencing techniques were allowed for faster and accurate to gain the differentially expressed profiles of genes. Because it doesn’t need to synthesis probes, which sequenced directly [20]. In addition, to our knowledge, no obvious research has focused on the RNA-Seq expression profile of lncRNAs in HQ treatment. In view of the above considerations, we used RNA-Seq techniques to profile lncRNAs in experimental group (HQ 20 μmol/L) and control group (PBS).
Our previous studies about HQ toxicity mechanisms results mainly involved in autophagy [21], cell cycle and apoptosis [22] and malignant transformation [23]. For a more comprehensive understand the toxicity mechanisms of HQ, we treated TK6 cells from the spleen of hereditary red blood cells anemia patients with exogenous compound (20 μmol/L HQ) as the experimental group in this study. TK6 lymphoblastoid cells line express wild type p53 and being a commonly used model for HQ and/or leukemia researches. Based on the actual level of human contact with HQ and preliminary studies, TK6 cells were treated with HQ 20μmol/L. Our results are the first RNA-Seq analysis indicating 65 lncRNAs and 186 mRNAs dysregulated in HQ treatment with fold changes of two or more. Compared with the control group (PBS), LILRP2, LOC344887, LGALS9, HBBP1 and ENSG00000270164.1 (LINC01480) are upregulated and C11orf92, LAMB2P1, LOC63930, SLC7A11-AS1, ENSG00000272259.1 are low expression in RNA-Seq data. We verified that the up-regulation of lncRNAs trends was consistent with sequencing results, while the down-regulation of lncRNAs trends was different from sequencing results. The expression trends of C11orf92 and ENSG00000272259.1 were contrary to sequencing results and the changes were statistically significant. Furthermore, FUT1, INHBE, SLC7A11, MROH5, METTL7B and MDM2 were significantly differentially expressed, while only METTL7B were contrary to sequencing data. In Figure 3C, 3D, the results showed that the expressions of LOC344887 and ENSG00000270164.1 (LINC01480) increased with the increase of HQ concentration after 24h or 48h in HQ treated TK6 cells at different concentrations. Wu et al. [24] has demonstrated that LOC344887 was amplified in gallbladder cancer and promoted epithelial mesenchymal transition (EMT) . Silencing of LOC344887 via CRISPR/Cas9 genome-editing protected against sulforaphane (SFN) -mediated inhibition of cancer cell growth, colony formation, and migration [25]. There is no literature reported ENSG00000270164.1 (LINC01480) function. Therefore, we can make a hypothesis that LOC344887 and ENSG00000270164.1 (LINC01480) may be involved in HQ induced TK6 cytotoxicity mechanisms. The specific mechanisms or signaling pathways need further exploration, and are also the focus of our next research. With the advantages of high signal-to-noise ratio, high resolution and wide application range, the new generation sequencing technology also has some errors from sample contamination and sequencing errors [26].
It is worth mentioning that lncRNAs can serve as signal, decoy, guide or scaffold molecules to participate in pre-transcriptional regulation, transcriptional regulation and post-translational regulation [27, 26, 11]. LncRNAs usually regulate target genes to perform their biological function because of lacking of proteins encode ability. Thus, a comprehensive understanding of the potential function for differentially expressed mRNAs is essential. Through GO annotation and KEGG pathway analysis, we could identify potential functions of the dysregulated mRNAs. GO annotation [28] revealed that the vast majority of differentially expressed mRNAs involve in multiple biological processes. IGJ and AMBP involved in cellular components. Simultaneously, partial mRNAs were involved in molecular functions, such as p53 binding, monosaccharide binding and fucose binding. KEGG database [29] revealed that the dysregulated mRNAs mainly involve in HQ toxicity mechanism through p53 signaling pathway and Glycosphingolipid biosynthesis - globo series pathway. Among them, chronic myeloid leukemia may be associated with MDM2 abnormalities. As the target gene of p53, MDM2 played an important role in the ubiquitin-proteasome pathway [30, 31]. Surprisingly, the combination of lincRNa-p21 and MDM2 promoted p53 ubiquitination, that is to say lincRNa-p21 positively regulated MDM-p53 interaction [32]. Studying the potential function of the differentially expressed mRNAs, can help to gain insight into their involvement in signaling pathways and provide convenience for researchers in the study of lncRNAs, simultaneously.
With the maturity of sequencing technology, more and more lncRNAs have been discovered and annotated, but their functional researches are still limited. Due to considerable difficulties in making a thorough inquiry on the lncRNAs functions directly, it is particularly important to predict lncRNAs target genes and construct lncRNA-mRNA co-expression network according to a co-expression-based method [33, 18]. LncRNAs regulated the expression of co-expressed mRNAs mainly through cis and trans. For instance, lncRNA-HBBP1 (NR_001589) regulated the expression of HBG1, HBG2, HBD by cis regulation and lncRNA-PHLDA3 (NR_073080) trans regulated the expression of CYP20A1 and ZNF470. The HBG1 and HBG2 are normally expressed in the fetal liver, spleen and bone marrow. Compared with wild type promoter, the activity of HBG1 gene promoter variant decreased significantly in K562 cells under conditions of erythropoietic stress [34]. This finding is helpful to analyze the pathogenesis of β-Thalassemia and provide a reference for its treatment. Because HBG1 and HBG2 are involved in the pathogenesis of hematologic diseases, it is not difficult to imagine that lncRNA- HBBP1 may also be involved in hematologic diseases and even leukemia. In view of the long-term exposure to HQ could lead to blood system diseases, then this coincide with our initial hypothesis. Another advantage of RNA-Seq technology is the ability to filter out new lncRNAs without annotated. We have identified 11 new lncRNAs, which will provide a new breakthrough for the studies of HQ toxicity mechanisms and leukemia pathogenesis.
More and more literatures have proved that lncRNAs were closely associated with the pathogenesis of leukemia. We have made a review about the lncRNAs as the novel diagnostic biomarkers of leukemia. For instance, MEG3, RUNXOR, NEAT1, LLEST, IRAIN and UCA1 were related to AML; ANRIL, LUNAR1 and T-ALL-R-LncR1 were involved in ALL; LncRNA-BGL3, H19 and MEG3 participated in CML; lincRNA-p21, DLEU1/DLEU2 and TRERNA1 were involved in CLL [35]. However, the functions of more lncRNAs we sequenced by RNA-Seq has not been studied. Next, we plan to take the blood samples from patients with occupational leukemia for sequencing in order to find the lncRNAs consistent with this paper.
MATERIALS AND METHODS
Cell culture and HQ treatment
TK6 cells are kindly provided by Professor Lishi Zhang of West China Medical College of Sichuan University, and were cultured at 37°C in an atmosphere containing 5% CO2 in RPMI1640 medium (Gibco Invitrogen, UK) plus 10% horse serum (HS). HQ (purity > 99%, Sigma, St. Louis, MO) was dissolved in phosphate-buffered saline (PBS) and immediately added to TK6 cells (20 μmol/L), the cells were cultured for 48h.
RNA isolation and qRT-PCR
Total RNA of cells was isolated using Trizol reagent (Invitrogen, Carlsbad, CA, USA) following the manufacturer’s instructions. The RNA concentrations were quantified by NANODROP 2000c (Thermo Scientific, USA), and the quality of RNA was assessed by 2% agarose gel electrophoresis. Extracted total RNA was used to synthesize cDNA using Transcriptor First Strand cDNA Synthesis Kit (Roche, Mannheim, Germany). qRT-PCR reactions were performed in triplicate in a 96-well plate containing 1μl of synthesized cDNA (diluted 6 times), FastStart Universal SYBR Green Master (Roche, Mannheim, Germany) on PikoReal (Thermo Scientific, USA) in a total volume of 10μL. The expression levels of lncRNAs were normalized to GAPDH and calculated using the 2−ΔΔCt method. All of primers were designed and synthesized by Generay Biotechnology (Generay Biotechnology, Shanghai) (Table 6).
Table 6: PCR primers
Gene |
Primer sequence (5′–3′) |
|---|---|
C11orf92 |
F:GCCTCTGCTGTTTATTCTCT |
R:CTCTGTGTGTTTCCCTCTGT |
|
LAMB2P1 |
F:GAGGTGTGTGTGATGTGTGT |
R:GTGTTGGGATTAGGGGTT |
|
LOC63930 |
F:ATGGGAGCGGGTAGATAA |
R:GAGACAGGAAGAGAGAGCAG |
|
SLC7A11-AS1 |
F:CAAAATGCCTGCTAAAGTG |
R:CGCTGTGAAATCTGTCTGT |
|
ENSG00000272259.1 |
F:ATCTCTCCTTCTGGCTGTG |
R:TCCTGTTGTTCCTGCTGT |
|
LILRP2 |
F:AGAGACGAGGGACAGGAG |
R:GGATTTGGAACACAGAGGT |
|
LOC344887 |
F:CTATGAAATGAAGCCAGACC |
R:GTGCCGTAAAGAGGAAAAG |
|
LGALS9 |
F:CCATCCAAGTCCATCCTC |
R:TAGTATTCAAACAGGTGCTGAC |
|
HBBP1 |
F:GAGAAGGCTGGAGGTGAG |
R:GTCATCCGTGAGCATAACA |
|
ENSG00000270164.1 (LINC01480) |
F:AGGAGAAAGGCATAGCAGA |
R:CAGGAAAGGGAGAGAAGTG |
|
GAPDH |
F:TCTGACTTCAACAGCGACACC |
R:CTGTTGCTGTAGCCAAATTCGT |
|
FUT1 |
F: GGCGTGCGGCTGTCCACTTCT |
R: TGGCTCTGGCCCAGCTCAACG |
|
CHAC1 |
F: GCCAGACGCAGCAAGTATTCA |
R: GAGGTCACCTTCTATCCCCAAGA |
|
INHBE |
F: ACACCAGACTTCTCACCCCTC |
R: CTCCCTGCTCACTTTTCACCT |
|
SLC7A11 |
F: CACATTTGTCAGCACATAGCC |
R: ACTGAAGAAGTAGAAAACCCTG |
|
MROH5 |
F: GCTGGGCTCAGGGTCACTTCT |
R: ACAGCCACTCCTGCCACATCA |
|
METTL7B |
F: GATTTGGGTCTAGGCAGGTGA |
R: CAGATAAAGGGGCTTACAGGA |
|
AMBP |
F: GACACTCCTTTTCTGTGACGA |
R: ATGACCAGCAGGTATTTCTAT |
|
OASL |
F: CAGGGCTCTGTAGGCAGGCAC |
R: GGAGGCAGCCAAGCATCACAA |
|
LGALS9 |
F: CAGACTTCGCTCCTCAGACCC |
R: TGCCTTTCATCACCACCATTC |
|
MDM2 |
F: AAAGGGAAGAAACCCAAGACAAAGA |
R: GCCATGTAAAGCAGGCCATAAGA |
High-throughput sequencing and data set
Total RNA was isolated from cells/tissues using the Trizol (invitrogen) according to the manufacturer’s protocol. RNA purity was assessed using the Qubit®. Each RNA sample had an A260:A280 ratio above 1.8 and A260:A230 ratio above 2.0. RNA integrity was evaluated using the Agilent 2200 TapeStation (Agilent Technologies, USA) and each sample had the RINe above 7.0. Briefly, rRNAs were removed from Total RNA using Epicentre Ribo-Zero rRNA Removal Kit (illumina, USA) and fragmented to approximately 200bp. Subsequently, the purified RNAs were subjected to first strand and second strand cDNA synthesis following by adaptor ligation and enrichment with a low-cycle according to instructions of TruSeq® RNA LT/HT Sample Prep Kit (Illumina, USA). The purified library products were evaluated using the Agilent 2200 TapeStation and Qubit®2.0 (Life Technologies, USA) and then diluted to 10 pM for cluster generation in situ on the HiSeq3000 pair-end flow cell followed by sequencing (2 × 150 bp) on HiSeq 3000. Finally, the obtained data were analyzed by bioinformatics. All RNA-Seq data was aligned to hg19 using TopHa v1.4 [36] with default parameters. We used Cuffdiff v1.3 [37] to analyze differentially expressed genes and obtained custom annotations composed of RefSeq entries plus HQ-induced TK6 lncRNAs as described below. The difference was considered statistically significant when P < 0.05. To screen the differentially expressed genes, we used threshold values of ≥ 2 (up-regulation) and ≤ -2 (down-regulation) fold change (FC). FC refers to the ratio of FPKM between the experimental group and the control group. FPKM is a general method of gene expression levels, which stands for the fragments Per Kilobase of transcript Per Million mapped reads.
Hierarchical clustering analysis
Cluster analysis of differential genes was used to determine the clustering patterns of regulation patterns under different experimental conditions. The difference in FPKM for different samples is used for cluster analysis.
Gene function analysis
The functional annotation of lncRNAs is mainly predicted by their co-expression mRNAs, but there is still no functional annotation of most lncRNAs at present [38]. GO (Gene Ontology) [39] and KEGG (Kyoto Encyclopedia of Genes and Genomes) pathway [40] annotations are useful for analyzing differentially expressed lncRNAs related mRNAs functions. GO analysis is mainly composed of cellular components, biological processes and molecular functions. Pathways about the mRNAs associated with dysregulation of lncRNAs can be obtained by KEGG database besides.
LncRNA-mRNA co-expression network analysis
The co-expression network was constructed between significantly dysregulated lncRNAs and mRNAs. Considering the influence of random factors, we found that only using Pearson correlation coefficients (PCC) is not strict, so we calculate zscore values and then obtain P values. The co-expressed lncRNAs and mRNAs pairs with |COR| > 0.85 and P < 0.05 were selected to draw the network. By selecting specific lncRNAs from dysregulated lncRNAs, we mapped the network graphs that interact with their target genes, providing a reference and help for the holistic analysis the function of lncRNAs in the samples.
LncRNAs target genes prediction
LncRNAs play the biological functions mainly by regulating their target genes because they lacked protein coding ability [41]. The target genes here are also known as transcription factors (TF). We mainly use TFSearch software (http://www.cbrc.jp/research/db/TFSEARCH.html) to predict TF of lncRNAs, and we draw lncRNA-mRNA interactive analysis diagrams through Cytoscape. Moreover, the mechanisms of lncRNAs are similar to miRNAs and can be performed by regulating the corresponding mRNAs. LncRNAs regulate target genes mainly through cis and trans regulation. The principle of cis regulation mechanism: for the differentially expressed lncRNAs, search all the coding genes of their upstream and downstream 10 kb range, whichever is selected with a significant co-expression of the lncRNA. The principle of trans-action is mainly based on nucleic acid base pairing.
New lncRNAs prediction
With the strict definition of lncRNAs, we can screen out new lncRNAs by setting some filtering conditions. The filter conditions are as follows: 1) Filtering database known genes and lncRNAs; 2) FPKM > 2; 3) ORF < 300; 4) Filtering RNAs with a protein domain (Pfam); 5) RNAs with a length greater than 200 nt; 6) Filtering RNAs with a coding potential [42]. An ANNOVAR software (http://www.openbioinformatics.org/annovar/) built-in database is adopted to annotate new lncRNAs.
Statistical analysis
All experiments were repeated at least 3 times independently, and all values were presented as mean ± standard deviation (SD). The data of two experimental groups were compared using the Student’s t-test, while One-way ANOVA was analyzed for multi-group comparisons. All data were analyzed and plotted using GraphPad Prism 6 (Graph-Pad Software, La Jolla, CA), and a P value of 0.05 or less was considered statistically significant, * means P < 0.05.
CONCLUSIONS
Overall, our study confirm that lncRNAs might participate in HQ toxicity mechanism even play an important role in leukemia. Further studies will be needed to persuasively demonstrate and interpret the more accurate role of one or several specific lncRNAs in TK6 cells exposed to low dose HQ. These findings bring us one step closer to a better understanding of leukemia pathogenesis, and lncRNAs may be the novel biomarkers for the diagnosis and therapy of leukemia.
Abbreviations
HQ, Hydroquinone; AML, acute myeloid leukemia; GO, Gene Oncology; KEGG, Kyoto Encyclopedia of Genes and Genomes; qRT-PCR, quantitative real-time PCR; HS, horse serum; PBS, phosphate buffered saline; ORF, open reading frame; ceRNAs, competing endogenous RNAs, FPKM, Fragments Per Kilobase of transcript per Million mapped reads; PCC, Pearson correlation coefficients; TF, transcription factors; EMT, epithelial mesenchymal transition; SFN, sulforaphane.
Ethical approval
This article does not contain any studies with human participants or animals performed by any of the authors.
Availability of data and materials
The authors confirm that all data underlying the findings are fully available without restriction.
ACKNOWLEDGMENTS
The authors thank Professor Lishi Zhang for his assistance in the TK6 cell line.
CONFLICTS OF INTEREST
The authors declare that they have no conflicts of interest.
FUNDING
This study was funded by National Natural Science Foundation of China (81273116, 81460504, 81260434 and 81060241)the Science Foundation of Guangdong Medical University (M2013004), the Guangdong Provincial Natural Science Foundation, China (S2013010015153), the Key project of Science and Technology Program of Dongguan Bureau of Science and Technology, China (2012108101011), the Science and Technology Program of Zhanjiang Bureau of Science and Technology, China (2013B01082) and a Key Program of National Science Foundation of China (81430079).
REFERENCES
1. Goldstein BD. Benzene as a cause of lymphoproliferative disorders. Chemico-biological interactions. 2010; 184:147–150.
2. Jing SU, Qin LI, Liang GQ, Zhang LE, Li Q, Liang LH, Yang YP, Qin LL, Zou YF, Geng WK. Effects of occupational exposure to low concentration of benzene series on serum oxidative stress levels in gas station workers. Journal of Environment & Health. 2014.
3. Regev L, Wu M, Zlotolow R, Brautbar N. Hydroquinone, a benzene metabolite, and leukemia: a case report and review of the literature. Toxicology & Industrial Health. 2011; 28:64–73.
4. Barreto G, Madureira D, Capani F, Aonbertolino L, Saraceno E, Alvarezgiraldez LD. The role of catechols and free radicals in benzene toxicity: an oxidative DNA damage pathway. Environmental & Molecular Mutagenesis. 2009; 50:771–780.
5. Chen Y, Chen J, Yun L, Xu L, Liu J, Xu Y, Yang H, Liang H, Tang H. Hydroquinone-induced malignant transformation of TK6 cells by facilitating SIRT1-mediated p53 degradation and up-regulating KRAS. Toxicology letters. 2016; 259:133–142.
6. Liu L, Ling X, Liang H, Gao Y, Yang H, Shao J, Tang H. Hypomethylation mediated by decreased DNMTs involves in the activation of proto-oncogene MPL in TK6 cells treated with hydroquinone. Toxicology letters. 2012; 209:239–245.
7. Gong ZJ, Zhang SS, Zhang WL, Huang HB, Li Q, Deng H, Ma J, Zhou M, Xiang JJ, Wu MH. Long non-coding RNAs in cancer. Science China Life Sciences. 2012; 55:1120.
8. Fan LJ, Han HJ, Guan J, Zhang XW, Cui QH, Shen H, Shi C. Aberrantly expressed long noncoding RNAs in recurrent implantation failure: A microarray related study. Syst Biol Reprod Med. 2017:1–10.
9. Yu J, Liu Y, Guo C, Zhang S, Gong Z, Tang Y, Yang L, He Y, Lian Y, Li X. Upregulated long non-coding RNA LINC00152 expression is associated with progression and poor prognosis of tongue squamous cell carcinoma. Journal of Cancer. 2017; 8:523.
10. Guttman M, Rinn JL. Modular regulatory principles of large non–coding RNAs. Nature. 2011; 482:339–346.
11. Rinn JL, Chang HY. Genome Regulation by Long Noncoding RNAs. Annual Review of Biochemistry. 2012; 81:145.
12. Jiang H, Ma R, Zou S, Li Z, Li W. Reconstruction and analysis of lncRNA-miRNA-mRNA network based on competitive endogenous RNA reveal functional lncRNAs in rheumatoid arthritis. Molecular BioSystems. 2017; 13:1182–1192.
13. Yu X, Zhe Z, Tang B, Li S, Tang L, Wu Y, Chen X, Fang H. alpha-Asarone suppresses the proliferation and migration of ASMCs through targeting the lncRNA-PVT1/miR-203a/E2F3 signal pathway in RSV-infected rats. Acta biochimica et biophysica Sinica. 2017:1–11.
14. Blume CJ, Hotz-Wagenblatt A, Hullein J, Sellner L, Jethwa A, Stolz T, Slabicki M, Lee K, Sharathchandra A, Benner A, Dietrich S, Oakes CC, Dreger P, et al. p53-dependent non-coding RNA networks in chronic lymphocytic leukemia. Leukemia. 2015; 29:2015–2023.
15. Wang X, Chen K, Guo G, Chen JL. Noncoding RNAs and their functional involvement in regulation of chronic myeloid leukemia. Brief Funct Genomics. 2016; 15:239–248.
16. Yang W, Li Y, Song X, Xu J, Xie J. Genome-wide analysis of long noncoding RNA and mRNA co-expression profile in intrahepatic cholangiocarcinoma tissue by RNA sequencing. Oncotarget. 2017; 8:26591–26599. https://doi.org/10.18632/oncotarget.15721.
17. Zhou J, Cao S, Li W, Wei D, Wang Z, Li G, Pan X, Lei D. Time-course differential lncRNA and mRNA expressions in radioresistant hypopharyngeal cancer cells. Oncotarget. 2017; 8:40994–41010. https://doi.org/10.18632/oncotarget.17343.
18. Li J, Xu Y, Xu J, Wang J, Wu L. Dynamic co-expression network analysis of lncRNAs and mRNAs associated with venous congestion. Molecular medicine reports. 2016; 14:2045–2051.
19. Zhou J, Xiong Q, Chen H, Yang C, Fan Y. Identification of the Spinal Expression Profile of Non-coding RNAs Involved in Neuropathic Pain Following Spared Nerve Injury by Sequence Analysis. Frontiers in molecular neuroscience. 2017; 10:91.
20. Birzele F, Schaub J, Rust W, Clemens C, Baum P, Kaufmann H, Weith A, Schulz TW, Hildebrandt T. Into the unknown: expression profiling without genome sequence information in CHO by next generation sequencing. Nucleic acids research. 2010; 38:3999–4010.
21. Xu L, Liu J, Chen Y, Yun L, Chen S, Zhou K, Lai B, Song L, Yang H, Liang H, Tang H. Corrigendum to “Inhibition of autophagy enhances hydroquinone-induced TK6 cell death”. Toxicology in vitro. 2017; 42:358.
22. Luo H, Liang H, Chen J, Xu Y, Chen Y, Xu L, Yun L, Liu J, Yang H, Liu L, Peng J, Liu Z, Tang L, et al. Hydroquinone induces TK6 cell growth arrest and apoptosis through PARP-1/p53 regulatory pathway. Environmental toxicology. 2017; 32:2163–2171.
23. Chen Y, Chen J, Yun L, Xu L, Liu J, Xu Y, Yang H, Liang H, Tang H. Hydroquinone-induced malignant transformation of TK6 cells by facilitating SIRT1-mediated p53 degradation and up-regulating KRAS. Toxicology letters. 2016; 259:133–142.
24. Wu XC, Wang SH, Ou HH, Zhu B, Zhu Y, Zhang Q, Yang Y, Li H. The NmrA-like family domain containing 1 pseudogene Loc344887 is amplified in gallbladder cancer and promotes epithelial-mesenchymal transition. Chem Biol Drug Des. 2017; 90:456–463.
25. Johnson GS, Li J, Beaver LM, Dashwood WM, Sun D, Rajendran P, Williams DE, Ho E, Dashwood RH. A functional pseudogene, NMRAL2P, is regulated by Nrf2 and serves as a coactivator of NQO1 in sulforaphane-treated colon cancer cells. Molecular nutrition & food research. 2017; 61.
26. Wang X, Wang X, Wang L, Feng Z, Zhang X. Processing and analysis of a new generation high throughput RNA sequencing data. Prog Biochem Biophys. 2010; 37:834–846.
27. Ponting CP, Oliver PL, Reik W. Evolution and functions of long noncoding RNAs. Cell. 2009; 136:629–641.
28. Rivals I, Personnaz L, Taing L, Potier MC. Enrichment or depletion of a GO category within a class of genes: which test? Bioinformatics (Oxford, England). 2007; 23:401–407.
29. Kanehisa M, Goto S. KEGG: kyoto encyclopedia of genes and genomes. Nucleic acids research. 2000; 28:27–30.
30. Oliner JD, Pietenpol JA, Thiagalingam S, Gyuris J, Kinzler KW, Vogelstein B. Oncoprotein MDM2 conceals the activation domain of tumour suppressor p53. Nature. 1993; 362:857–860.
31. Yin Y, Stephen CW, Luciani MG, Fåhraeus R. p53 Stability and activity is regulated by Mdm2-mediated induction of alternative p53 translation products. Nature Cell Biology. 2002; 4:462–467.
32. Chen S, Liang H, Yang H, Zhou K, Xu L, Liu J, Lai B, Song L, Luo H, Peng J, Liu Z, Xiao Y, Chen W, et al. LincRNa-p21: function and mechanism in cancer. Medical oncology (Northwood, London, England). 2017; 34:98.
33. Liao Q, Liu C, Yuan X, Kang S, Miao R, Xiao H, Zhao G, Luo H, Bu D, Zhao H, Skogerbo G, Wu Z, Zhao Y. Large-scale prediction of long non-coding RNA functions in a coding-non-coding gene co-expression network. Nucleic acids research. 2011; 39:3864–3878.
34. Ugrin M, Stojiljkovic M, Zukic B, Klaassen K, Katsila T, Vasiljevic J, Dokmanovic L, Janic D, Patrinos GP, Pavlovic S. Functional Analysis of an (A)gamma-Globin Gene Promoter Variant (HBG1: g.-225_-222delAGCA) Underlines Its Role in Increasing Fetal Hemoglobin Levels Under Erythropoietic Stress. Hemoglobin. 2016; 40:48–52.
35. Chen S, Liang H, Yang H, Zhou K, Xu L, Liu J, Lai B, Song L, Luo H, Peng J, Liu Z, Xiao Y, Chen W, et al. Long non-coding RNAs: The novel diagnostic biomarkers for leukemia. Environmental Toxicology and Pharmacology. 2017; 55:81–86
36. Trapnell C, Pachter L, Salzberg SL. TopHat: discovering splice junctions with RNA-Seq. Bioinformatics (Oxford, England). 2009; 25:1105–1111.
37. Parkhomchuk D, Borodina T, Amstislavskiy V, Banaru M, Hallen L, Krobitsch S, Lehrach H, Soldatov A. Transcriptome analysis by strand-specific sequencing of complementary DNA. Nucleic acids research. 2009; 37:e123.
38. Zhang X, Wu D, Chen L, Li X, Yang J, Fan D, Dong T, Liu M, Tan P, Xu J, Yi Y, Wang Y, Zou H, et al. RAID: a comprehensive resource for human RNA-associated (RNA-RNA/RNA-protein) interaction. RNA (New York, NY). 2014; 20:989–993.
39. Ashburner M, Ball CA, Blake JA, Botstein D, Butler H, Cherry JM, Davis AP, Dolinski K, Dwight SS, Eppig JT, Harris MA, Hill DP, Issel-Tarver L, et al. Gene ontology: tool for the unification of biology. The Gene Ontology Consortium. Nature genetics. 2000; 25:25–29.
40. Kanehisa M, Goto S, Sato Y, Furumichi M, Tanabe M. KEGG for integration and interpretation of large-scale molecular data sets. Nucleic acids research. 2012; 40:D109–114.
41. Lopez-Pajares V, Qu K, Zhang J, Webster DE, Barajas BC, Siprashvili Z, Zarnegar BJ, Boxer LD, Rios EJ, Tao S, Kretz M, Khavari PA. A LncRNA-MAF:MAFB transcription factor network regulates epidermal differentiation. Developmental cell. 2015; 32:693–706.
42. Lin MF, Jungreis I, Kellis M. PhyloCSF: a comparative genomics method to distinguish protein coding and non-coding regions. Bioinformatics (Oxford, England). 2011; 27:i275–282.