
INTRODUCTION
In the United States, breast cancer is the second most commonly diagnosed cancer and the second leading cause of cancer death in female. An estimated 252,710 new cases of breast invasive carcinoma and 40,610 breast cancer deaths are expected to occur among U.S. women in 2017 [1]. Over the past 20 years, breast cancer incidence and mortality rates increased rapidly in developing regions [2]. It was estimated that about half of the new breast cancer cases and 60 % of the breast cancer deaths occurred in developing countries.
Breast cancer is considered as a highly heterogeneous disease. WHO suggested 20 major tumor types and 18 minor subtypes based on morphological features [3]. A major drawback of this classification is that most of the all breast cancers belong to two major histopathological classes. Gene expression profiling or immuno-histochemical approaches have also been used to unveil the molecular basis for heterogeneity of breast cancer like basal-like, HER2-enriched and so forth [4].
The mutational theory of cancer proposes that driver mutations provide proliferative advantage, causing outgrowth of a neoplastic clone. Multiple mutational processes, including endogenous and exogenous mutagen exposures, aberrant DNA editing and so forth, are responsible for generating these mutations [5]. Recently, DNA sequencing has enabled systematic characterization of the mutation types including single nucleotide substitutions, small insertions or deletions and copy number changes. It was the foundation of the study of driver mutations and also contributed a lot to the clinical application.
In this study, we utilized the breast invasive carcinoma datasets from TCGA to study the impact of specific mutations on genes with mutation significance (MutSig) on the histo-clinical parameters, especially the breast classification, and the mRNA or protein expression levels. We aimed to identity how the specific mutations led to the different phenotypes like the histopathological classification. In further, our analysis might help a comprehensive understanding of the origins and consequences of somatic mutations in breast cancer.
RESULTS
The genes with mutation significance
The somatic mutations and copy number variation of the patients with at least one alterations in the 24 MugSig genes were shown in the Oncoprints (Figure 1). Individual genes were represented as rows, and individual cases were represented as columns. The SNPs, including truncated mutations, inframe deletion or insertion and missense mutations, were shown as green, purple and orange color with the one-thirds height, respectively. And the rectangle with full height showed the copy number variation: the red was amplification and the blue was the copy number loss.
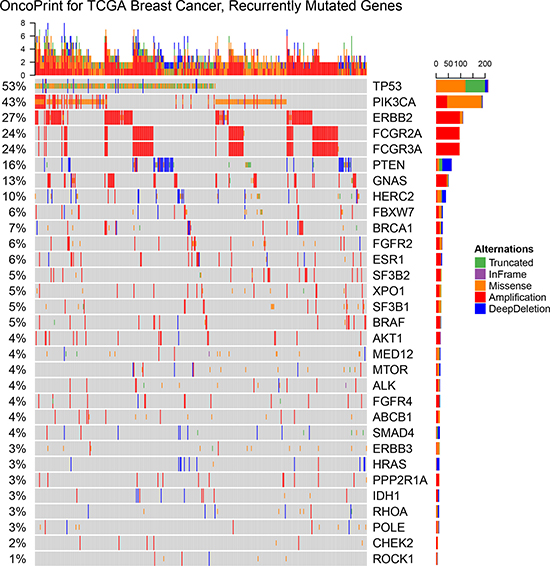
Figure 1: OncoPrint showing the distribution of genomic alterations in breast cancer. The OncoPrint provided an overview of genomic alterations (legend) in particular genes (rows) affecting individual samples (columns). The truncated mutations, inframe deletion or insertion, and missense mutations, were shown as green, purple and orange color with the one-thirds height. And copy number variations were annotated with the full height that amplification was red and the copy number loss was blue. The same color palettes of alterationswere used in the following graphs as well.
Theimpact of mutations on the mRNA and protein expression level
The top MugSig genes, including TP53, PIK3CA, ERBB2 and PTEN were selected to study the role of specific mutations played on the patients with breast cancer. The reason that FCGR2A and FCGR3A were excluded even though they had even more alteration cases than PTEN was that the genomic position of FCGR2A and FCRG3A were quite close and their alteration patterns were almost the same. It was reported that the CNV occurred in the locus where FCGR2A and FCRG3A were located. However, the amplification of FCGR2A and FCRG3A should not always occur simultaneously. For example, some population did have amplification of FCGR3A but not FCGR2A [6]. As a result, we tend to consider the high correlation of amplification of these two genes in this case would be artificial and they were excluded in the following analysis. The counts of cases in each group were listed in Table 1.
Table 1: The count of cases in each mutation types of TP53, PIK3CA, ERBB2 and PTEN
Wild type |
Missense |
In-frame |
Truncated |
Amplified |
Deleted |
Mixed |
|
|---|---|---|---|---|---|---|---|
TP53 |
631 |
146 |
5 |
95 |
0 |
11 |
4 |
PIK3CA |
608 |
228 |
5 |
2 |
30 |
1 |
18 |
ERBB2 |
768 |
12 |
0 |
0 |
109 |
1 |
2 |
PTEN |
811 |
14 |
1 |
15 |
4 |
47 |
0 |
We selected the top 2 mutation types for each gene, and their influence on their mRNA expression levels and protein expression levels were plotted in (Figure 2). First, the correlation between mRNA expression levels and protein expression levels was high in ERBB2 using Pearson correlation, while the correlation was low for the other three genes. Using the Kruskal–Wallis test, the mRNA expressions and protein expression levels were all significant among the wild-type and other mutation types of the four selected genes. The segmentation duplication of PIK3CA and ERBB2 led to high expression of both mRNA and protein, but the missense did not have influence. Both truncated mutations and copy number deletion of PTEN caused the low expression levels of mRNA and protein. One interesting finding was about TP53. The truncated mutations in TP53 led to low mRNA expression but had the similar protein expression as the wild-type. On the other hand, the missense mutations were related with high expression level of mRNA and protein. From the scatter plot, it was clear that patients with missense mutations on TP53 had totally different pattern compared with wild-type or with truncated mutations.
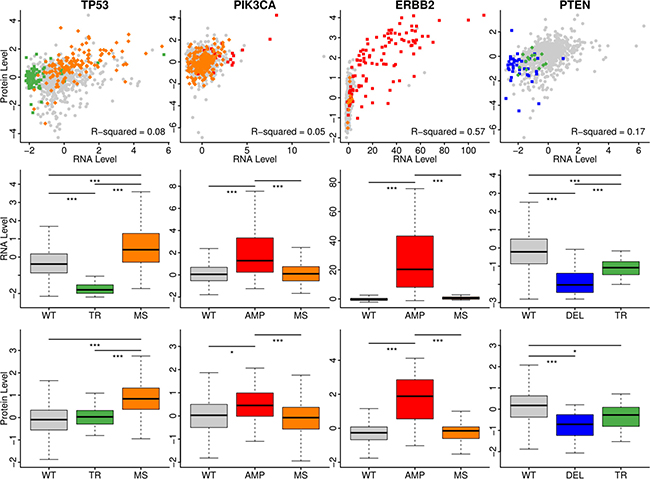
Figure 2: The impact of mutations on the mRNA and protein expression level. The mRNA levels and protein levels were plotted as scatter with the various color annotating the mutation types. The boxplot showed the different levels of mRNA or proteins in different groups. WT: wild-type; TR: truncated mutations; MS: missense mutations; AMP: CNV amplification; DEL: CNV deletion. The color palettes were the same as Figure 1. The stars annotated the scale of p-value. *: 0.01; **: 0.005; ***: 0.001.
When we investigated whether the survival status were correlated with the specific mutations (Figure 3), we were discouraged that there were no signification difference of survival time between patients with wild type and patients with specific mutations. However, we were still curious how the mutations influences other histo-clinical information.
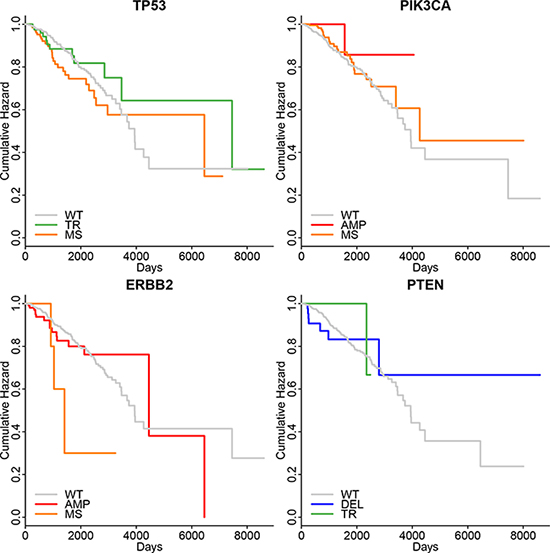
Figure 3: The Meier-Kaplan curve of survival status of patients in different mutation groups of selected genes. None of them had the p-value lower than 0.05. The abbreviations were the same as Figure 2.
The histo-clinical measures with TP53 and PIK3CA
Considering the relatively fewer cases with specific mutations, our foci were mainly put on missense mutations of TP53 and PIK3CA. The detailed truncated and missense mutations of TP53 and missense mutations of PIK3CA were plotted as lollipop plot (Figure 4). Though TP53 had much more mutations than PIK3CA and the exon length were shorter, the missense mutations on TP53 were relatively evenly distributed. On the other hand, PIK3CA were concentrated on several loci. There were 55 cases had missense mutation on the position of 1047 amino acid and the mutations were mainly H1047R. Actually, the missense mutation on this site were annotated as oncogenic mutations with gain of function in Precision Oncology Knowledge Base (OncoKB, http://oncokb.org/).
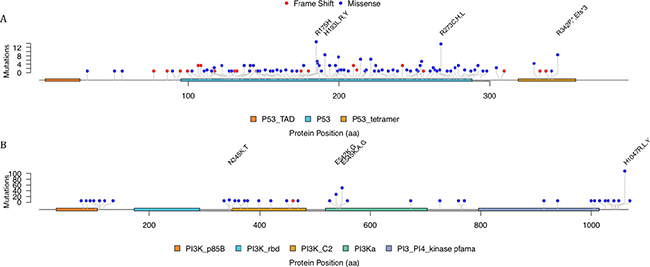
Figure 4: The mutation distribution over the TP53 and PIK3CA protein.
The correlation between specific mutations on TP53 or PIK3CA and the histo-clinical parameters were analyzed (Table 2). The missense mutations on TP53 were highly related with the morphology, race, ER status, PR status and HER2 Status, while the truncated mutations were highly related with the morphology, ER status and PR status. The missense mutation on PIK3CA were highly associated with the morphology, race, ER status and PR status. When we limited the missense mutation to the mutations on 1047 aa, the associated histo-clinical estimates were only race and PR status and the p-value for age at diagnosis was 0.027.
Table 2: The p value of the specific mutations on histo-clinical measures when compared with the wild-type
TP53 |
PIK3CA |
|||
|---|---|---|---|---|
Missense |
Truncated |
Missense |
H1047R |
|
survival |
1.40E-01 |
4.78E-01 |
2.86E-01 |
8.82E-01 |
age at diagnosis |
3.34E-01 |
1.42E-01 |
2.01E-01 |
2.74E-02 |
tumor stage |
8.25E-01 |
2.03E-01 |
3.92E-01 |
4.09E-01 |
morphology |
1.31E-07 |
7.50E-07 |
8.19E-03 |
4.24E-01 |
race |
4.61E-04 |
2.77E-01 |
9.18E-06 |
3.85E-03 |
ER status |
7.32E-16 |
2.20E-16 |
4.09E-07 |
1.99E-01 |
PR status |
2.32E-10 |
2.72E-13 |
1.74E-09 |
9.06E-05 |
HER2 Status |
2.82E-04 |
9.16E-02 |
1.24E-01 |
6.08E-01 |
Node Coded |
6.79E-01 |
3.94E-01 |
9.29E-01 |
7.16E-01 |
Metastasis |
7.11E-01 |
1.00E+00 |
5.67E-01 |
4.17E-01 |
T stage |
5.41E-01 |
1.23E-02 |
1.16E-01 |
9.72E-02 |
DISCUSSION
The missense and truncated mutations on TP53
Among 892 cases with sequencing data, 631 patients had wild-type TP53 gene even though the expression levels of mRNA or protein might aberrant or its function might be affected by the micro-environment. In other words, about 29.3% of patients with breast invasive carcinoma had mutations or copy number alterations on genes encoding TP53. Among these patients, most had missense mutations which accounted for around 55.9% and about 36.4% had truncated mutations which included nonsense mutations and frameshift deletion or insertion (Table 1).
One interesting finding is that the missense mutations on TP53 led to high expression levels of both the mRNA and protein of TP53, while truncated mutations only led to low mRNA expression levels. Such results suggested that these missense mutations had gain-of-function. In fact, TP53 had quite unique mutation patterns when compared with other tumor suppressor genes. Most of tumor suppressors were frequently inactivated by frame shift or nonsense mutations leading to either production of truncated proteins or complete elimination of the corresponding gene products just as other MugSig genes found in this study, while most of the mutations within the TP53 gene were missense mutations, resulting in the expression of full-length mutant p53 proteins. Moreover, the mutated p53 proteins became highly expressed in human cancers, which suggested the existence of a strong selection for mutant p53 overexpression in breast cancer. Functionally, TP53 missense mutations resulted in loss of the wild-type tumor suppressor activities, and also may suppress the function of the wild-type TP53 allele via a dominant-negative mechanism. It also was reported that TP53 missense might gain of oncogenic function [7].
The mutations of TP53 showed several hotspots even though most of mutations only appeared in one case. Such hotspot contains R175H, R273H and H193L,R,Y. It was shown that both R175H and R273H were oncogenic mutations. R175H mutation was a structural mutation which led to an unfolded DNA-binding domain while R273H were contact mutation by substituting the interacted residues. But H193L,R,Y seemed to be uncommon, and only H193R was annotated as likely to be oncogenic and might be loss-of-function according to OncoKB. It was also reported that there was mutant-specific p53 reactivator, like NSC319726. Yu, Vazquez [8] showed that this drug specifically targeted the p53 hotspot mutant R175H. It can restore wild-type conformation and trigger R175H-dependent cell death by apoptosis [9]. Further drug discovery should be put on other frequent p53 mutants, such as other hotspot we found like R273H and H193L,R,Y.
Theimpact of TP53 mutations onhisto-clinical measures
After analyzing the correlation with TP53 mutations and the histo-clinical parameters, the results showed that the missense mutations on TP53 were highly related with the morphology, race, ER status, PR status and HER2 Status, while the truncated mutations were highly related with the morphology, ER status and PR status.
Among cases with wild-type TP53, over 65% had morphology with a code of 8500/3, which meant as infiltrating duct adenocarcinoma without other specific and about 23% had a code of 8520/3 as lobular carcinoma without other specific (Table 3). However, in the patients with mutated TP53, the ratio of 8520/3 were lower than 5%. There were two studies which showed that out of total 48 breast cancers with TP53 mutations were all tumors of the ductal type but none of them were lobular type [10, 11]. Their results supported our findings that TP53 mutations predispose to duct adenocarcinoma but not to lobular carcinoma.
Table 3: The association of selected clinical parameters and TP53 mutations
Clinical Information |
WT |
MS |
TR |
|
|---|---|---|---|---|
Morphology |
8500 |
408 |
124 |
84 |
8520 |
144 |
6 |
2 |
|
8522 |
18 |
3 |
2 |
|
8523 |
13 |
1 |
2 |
|
other |
42 |
11 |
4 |
|
Race |
Asian |
29 |
21 |
8 |
Black or African American |
94 |
20 |
15 |
|
White |
458 |
97 |
66 |
|
ET |
Negative |
47 |
55 |
50 |
Positive |
375 |
63 |
32 |
|
PR |
Negative |
98 |
65 |
53 |
Positive |
322 |
54 |
27 |
|
HER2 |
Negative |
372 |
88 |
63 |
Positive |
47 |
30 |
14 |
|
On the meantime, missense and truncated mutations also performed differently according to the ER, PR and HER2 status. Our findings were in agreement with previous comparisons of the breast tumor intrinsic subtypes and TP53 mutation status. It was reported that about 44% of basal-like tumors and 43% of HER2+/ER− subtype tumors contained TP53 mutations, while lower than 23% of luminal were mutation-positive [12].
Though the tumor suppressor role of TP53 were quite clear, it was still unclear why the mutation patterns of TP53 were different from the different morphology or the presentation of antibody, whether the mutations had impacts on them and how the specific mutations might contribute.
The missense mutation of PIK3CA and H1047R
PIK3CA had obvious mutation hotspots and the most significant one was on H1047R. And the hotspots also included E545K. In fact PIK3CA were one of the most mutated genes in various cancers like breast, colon, glioblastomas and so forth. It was reported that about eighty percent of the mutations were H1047R or a cluster of 542 aa, 545 aa and 546 aa [13].
Meyer, Brinkhaus [14] found that expression of the PIK3CA mutant with H1047R was sufficient to induce tumor formation in transgenic mice. Also it was suggest that the mutant H1047R prevented cell death by increased PI3K/AKT pathway activation [15]. Gkeka, Evangelidis [16] presented a model of the over-activation mechanism of the H1047R based on structural and dynamic differences with the wild-type. All these studied illustrated the extreme importance of PIK3CA mutant H1047R.
The relationship between PIK3CA mutations, especially H1047R, and various histo-clinical parameters were identified using various statistical methods. Most of our results showed concordance with the previous studies. PIK3CA mutations had been found at similar frequencies in breast ductal and lobular carcinoma [17], though we found there were a small difference based on TCGA breast cancer dataset (Table 4). We had exact the same finding when it comes to the PR, ER and HER2 receptor. Pang, Cheng [18] carried out a meta-analysis involving 26 studies and they indicated the significant association between PIK3CA mutations and ER and PR expressions. In terms of HER2 status, most of studies demonstrated no association of PIK3CA with HER2 status [19].
Table 4: The association of selected clinical parameters and PIK3CA mutations
Clinical Information |
WT |
MS |
H1037R |
|
|---|---|---|---|---|
Morphology |
8500 |
434 |
149 |
69 |
8520 |
99 |
53 |
19 |
|
8522 |
12 |
11 |
5 |
|
8523 |
11 |
4 |
1 |
|
other |
47 |
9 |
7 |
|
Race |
Asian |
34 |
18 |
12 |
Black or African American |
111 |
14 |
8 |
|
White |
416 |
181 |
73 |
|
ER |
Negative |
117 |
16 |
11 |
Positive |
304 |
154 |
70 |
|
PR |
Negative |
171 |
27 |
15 |
Positive |
247 |
143 |
66 |
|
HER2 |
Negative |
343 |
155 |
68 |
Positive |
65 |
19 |
10 |
|
Even though PIK3CA was the most mutated genes in multiple cancers, there was few studies reporting the drug sensitivity or outcomes when the mutation was presented. As a result, more efforts were needed to tell how and whether specific mutations in MutSig genes affected the disease or the therapy.
MATERIALS AND METHODS
Breast cancer provisional data from GDC
There were totally 1098 cases in the provisional breast invasive carcinoma datasets from GDC data portal. The clinical information and classification of subtypes were retrieved using TCGAbiolinks on Jun 19, 2017 [20]. The level-3 legacy data of transcriptome profiling from Illumina RNA-Seq platform, processed mutation files from Exome sequencing and protein expression data from MDA RPPA (MD Anderson Reverse Phase Protein Array) Core were also downloaded using GDCquery [20].
Genes with mutation significance
The genes with mutation significance were calculated using the number of mutations and the number of covered bases for each gene. The genes with mutations or copy number alterations in at least of 1% patients were extracted.
The single-nucleotide polymorphism (SNP) and copy number variation of these 24 MutSig genes were visualized using OncoPrint [21, 22] and plotted with R package ComplexHeatmap [23]. In order to visualize the mutation positions and patterns, lollipop plot was created using R package trackViewer [24], where the x-axis was the position of amino acid and the y-axis was the occurrence of mutations on the given position and the dominant types of mutations were annotated by different colors.
The role of mutations on the RNA and protein expression level
The patients were separated into three groups according to their mutation types of TP53, PIK3CA, ERBB2 and PTEN. We selected these four genes because they had the lowest p-value that they were significantly mutated in patients when compared with normal samples except for FCGR2A and FCGR3A. The reason that FCGR2A and FCGR3A were excluded was that the genomic position of FCGR2A and FCRG3A were quite close and their alteration patterns were almost the same. Such similar pattern might be artificial by experimental strategy but not the genuine. We selected the top 2 mutation types for each gene, and studied their impacts on the expression levels of mRNA and protein.
The Kruskal-Wallis rank sum test, which was a non-parametric method for testing whether the location parameters of the distribution of cases were the same in each group without assumption of normal distribution, was utilized in order to figure out whether there were differences of mRNA or protein expression levels on patients with wild-type MugSig genes or with specific mutations [25]. And the scatter plot using mRNA expression data as x-axis and protein expression levels as y-axis were created and the mutation status were shown using different color. Wild-type, missense mutations, truncated mutations, copy number amplifications and copy number deletions were annotated by grey, orange, green, red and blue, respectively.
The relation between mutations with histo-clinical evaluation
We would like to identify whether specific type of mutations have different influence on the RNA expression level, protein expression levels, protein functions, and the histo-clinical features. Different statistical methods were used including two-sample Wilcoxon tests for age at diagnosis [25], log-rank test for survival status [26] and Fisher’s exact test for all other histo-clinical parameters [27]. In order to visualize the survival status, the Kaplan-Meier curves were plotted.
CONCLUSIONS
We obtained the genes, which were highly mutated in patients with breast cancer, and most of these genes have been reported to be associated with breast cancer. Furthermore, we studied the impact of different mutation on TP53 and PIK3CA on the mRNA or protein expression, and other clinical information. We found that missense mutations on TP53 were related with high expression levels of mRNA and protein. The mutations on TP53 and PIK3CA were highly related with the morphology, race, ER status, PR status and HER2 status. These results suggested that the different mutations on specific genes might have distinct impact on the phenotypes, which was able to help diagnosis and personal treatment.
CONFLICTS OF INTEREST
None.
REFERENCES
1. Siegel RL, Miller KD, Jemal A. Cancer Statistics, 2017. CA Cancer J Clin. 2017; 67:7–30.
2. Ma J, Jemal A. Breast Cancer Statistics. In: Ahmad A. (eds) Breast Cancer Metastasis and Drug Resistance. Springer, New York, NY. 2013; 1–18.
3. Sinn HP, Kreipe H. A Brief Overview of the WHO Classification of Breast Tumors, 4th Edition, Focusing on Issues and Updates from the 3rd Edition. Breast Care (Basel). 2013; 8:149–154.
4. Goldhirsch A, Ingle JN, Gelber RD, Coates AS, Thürlimann B, Senn HJ, and Panel Members. Thresholds for therapies: highlights of the St Gallen International Expert Consensus on the primary therapy of early breast cancer 2009. Ann Oncol. 2009; 20:1319–1329.
5. Viale G. The current state of breast cancer classification. Ann Oncol. 2012 (Suppl 10); 23:x207–10.
6. Moriya H, Saito K, Helsby N, Hayashi N, Sugino S, Yamakage M, Sawaguchi T, Takasaki M, Takahashi M, Kurosawa N. Single-nucleotide polymorphisms and copy number variations of the FCGR2A and FCGR3A genes in healthy Japanese subjects. Biomed Rep. 2014; 2:265–269.
7. Weisz L, Oren M, Rotter V. Transcription regulation by mutant p53. Oncogene. 2007; 26:2202–2211.
8. Yu X, Vazquez A, Levine AJ, Carpizo DR. Allele-specific p53 mutant reactivation. Cancer Cell. 2012; 21:614–625.
9. Soussi T, Wiman KG. TP53: an oncogene in disguise. Cell Death Differ. 2015; 22:1239–1249.
10. Evans DG, Moran A, Hartley R, Dawson J, Bulman B, Knox F, Howell A, Lalloo F. Long-term outcomes of breast cancer in women aged 30 years or younger, based on family history, pathology and BRCA1/BRCA2/TP53 status. Br J Cancer. 2010; 102:1091–1098.
11. Masciari S, Dillon DA, Rath M, Robson M, Weitzel JN, Balmana J, Gruber SB, Ford JM, Euhus D, Lebensohn A, Telli M, Pochebit SM, Lypas G, Garber JE. Breast cancer phenotype in women with TP53 germline mutations: a Li-Fraumeni syndrome consortium effort. Breast Cancer Res Treat. 2012; 133:1125–1130.
12. Carey LA, Perou CM, Livasy CA, Dressler LG, Cowan D, Conway K, Karaca G, Troester MA, Tse CK, Edmiston S, Deming SL, Geradts J, Cheang MC, et al. Race, breast cancer subtypes, and survival in the Carolina Breast Cancer Study. JAMA. 2006; 295:2492–2502.
13. Backer JM. The regulation of class IA PI 3-kinases by inter-subunit interactions. Curr Top Microbiol Immunol. 2010; 346:87–114.
14. Meyer DS, Brinkhaus H, Muller U, Muller M, Cardiff RD, Bentires-Alj M. Luminal expression of PIK3CA mutant H1047R in the mammary gland induces heterogeneous tumors. Cancer Res. 2011; 71:4344–4351.
15. Miller TW. Initiating breast cancer by PIK3CA mutation. Breast Cancer Res. 2012; 14:301.
16. Gkeka P, Evangelidis T, Pavlaki M, Lazani V, Christoforidis S, Agianian B, Cournia Z. Investigating the structure and dynamics of the PIK3CA wild-type and H1047R oncogenic mutant. PLoS Comput Biol. 2014; 10:e1003895.
17. Miled N, Yan Y, Hon WC, Perisic O, Zvelebil M, Inbar Y, Schneidman-Duhovny D, Wolfson HJ, Backer JM, Williams RL. Mechanism of two classes of cancer mutations in the phosphoinositide 3-kinase catalytic subunit. Science. 2007; 317:239–242.
18. Pang B, Cheng S, Sun SP, An C, Liu ZY, Feng X, Liu GJ. Prognostic role of PIK3CA mutations and their association with hormone receptor expression in breast cancer: a meta-analysis. Sci Rep. 2014; 4:6255.
19. Mukohara T. PI3K mutations in breast cancer: prognostic and therapeutic implications. Breast Cancer (Dove Med Press). 2015; 7:111–123.
20. Colaprico A, Silva TC, Olsen C, Garofano L, Cava C, Garolini D, Sabedot TS, Malta TM, Pagnotta SM, Castiglioni I, Ceccarelli M, Bontempi G, Noushmehr H. TCGAbiolinks: an R/Bioconductor package for integrative analysis of TCGA data. Nucleic Acids Res. 2016; 44:e71.
21. Gao J, Aksoy BA, Dogrusoz U, Dresdner G, Gross B, Sumer SO, Sun Y, Jacobsen A, Sinha R, Larsson E, Cerami E, Sander C, Schultz N. Integrative analysis of complex cancer genomics and clinical profiles using the cBioPortal. Sci Signal. 2013; 6:pl1.
22. Cerami E, Gao J, Dogrusoz U, Gross BE, Sumer SO, Aksoy BA, Jacobsen A, Byrne CJ, Heuer ML, Larsson E, Antipin Y, Reva B, Goldberg AP, et al. The cBio cancer genomics portal: an open platform for exploring multidimensional cancer genomics data. Cancer Discov. 2012; 2:401–404.
23. Gu Z, Eils R, Schlesner M. Complex heatmaps reveal patterns and correlations in multidimensional genomic data. Bioinformatics. 2016; 32:2847–2849.
24. Ou J. trackViewer: A bioconductor package with minimalist design for drawing elegant tracks or lollipop plot. R package version 1102. 2016.
25. Hollander M, Wolfe DA. Nonparametric statistical methods. Biomed J. 1975; 17:526.
26. Harrington DP, Fleming TR. A class of rank test procedures for censored survival data. Biometrika. 1982; 69:553–566.
27. Agresti A. Categorical Data Analysis Second Edition. John Wiley & Sons, Inc. 2002.